Acoustically transparent duct
Kristo´ f Tokaji and Csaba Horva´th
Abstract
Fans are widely used for industrial as well as household applications. As their numbers increase, so does their effect on our comfort and health via noise pollution. In most instances, these fans are built into a ducted environment, and therefore acoustic investigations should also be carried out in a ducted environment in order to guarantee proper flow conditions. On the other hand, localizing noise sources in a ducted environment is a difficult task. A useful method for localizing noise sources is the beamforming of phased array microphone data, but building an array of microphones into a duct runs with many complications. This has provided motivation for the design of an acoustically transparent duct, which provides a means for using a microphone array located outside of the duct system for the investigation of fan noise sources within the duct. The acoustically transparent duct section provides an acoustic window for the microphone array while guarantee- ing that the duct is hydrodynamically impenetrable. This investigation presents the design process as well as a case study of a low pressure fan in order to demonstrate the effectiveness of the design.
Keywords
Beamforming, phased array microphone, turbomachinery, turbomachinery noise, ducted system, noise source localization
Date received: 4 May 2017; accepted: 12 February 2018
Introduction
Currently, turbomachinery is considered to be one of the most dominant noise sources surrounding people in their daily lives. They make up some of the most important components in industrial ventilation systems, as well as everyday applications, such as air conditioning or computer systems, to name a few. As their numbers have increased, so has their disturbing effect, with the increased level of noise pollution leading to stricter laws and
Department of Fluid Mechanics, Faculty of Mechanical Engineering, Budapest University of Technology and Economics, Budapest, Hungary
Corresponding author:
Csaba Horva´th, H-1111 Bertalan Lajos Street 4-6, Budapest, Hungary.
Email: horvath@ara.bme.hu
International Journal of Aeroacoustics 2018, Vol. 17(3) 238–258
!The Author(s) 2018 Reprints and permissions:
sagepub.co.uk/journalsPermissions.nav DOI: 10.1177/1475472X18763859 journals.sagepub.com/home/jae
regulations. In order to reduce the level of noise pollution and meet the demands of society, steps need to be made toward localizing, understanding, and inevitably reducing the noise at its source.
Turbomachinery is often built into a ducted system. The flow in the duct is characteris- tically different from that which would be experienced if the turbomachinery were operated in an unducted environment. Therefore, the character of the aeroacoustic noise sources experienced for the same fan running under the same operating conditions will also be vastly different. For example, the uniform inlet velocity in a duct can result changes regarding the character of the leakage flow noise of a fan.1As the result of such differences, the noise of ducted fans needs to be investigated in a ducted setting.
In order to localize noise sources, one can use phased array microphones and beam- forming technology. This technology provides beamforming maps, which show the origins of the dominant noise sources.2While single microphone measurements provide informa- tion regarding the spectral content and directivity of the sound field, they cannot be used to localize the noise sources. Beamforming, on the other hand, takes a time series of simultaneously attained acoustic data and processes it in order to point the microphone array at a series of examined grid points and determines the source strength distribution.
The basic beamforming methodology utilizes the phase difference measured between the microphone signals to determine the direction of arrival of the wave fronts. By adjusting the phase shifts of the microphone signals relative to each other, a maximum correlation can be obtained between them. The phase shifts give information as to the direction of arrival of the wave fronts and hence point the user to the locations of the noise sources.
Explained differently, the method forms a sensitivity curve, called main lobe, which is directed toward possible compact monopole noise source positions by applying a phase adjustment. The possible source positions are defined by the user, providing focus points for the beamforming methodology, and the beamforming maps display the strengths of the investigated sources.
The literature provides suggestions for using microphone arrays in the investigation of ducted systems.3–7 In most applications the microphones are installed in the wall of the duct, as in literature.4,6 In such cases, the microphones are in direct contact with the flow, which can cause difficulties. First, the turbulence interacting with the surfaces of the micro- phones generates flow-induced self-noise, which disturbs the measurement results.8 Second, since the microphones are located in a very unsteady hydrodynamic pressure field, the fre- quency and the cost of servicing might also increase. Third, the acoustic duct modes resulting from the geometry of the duct also influence the results of the measurements,9 making it difficult to trace the sound back to the source with currently available beamforming methods, even for broadband noise sources.10,11
In other instances, the microphone arrays were located outside of the duct.3,7 In these measurements, the phased array was located at a sideline position, looking onto the inlet and outlet of the duct from the side,7or placed upstream/downstream of the inlet/outlet, respectively.3,7In this way the microphones were removed from the flow, therefore limiting the effect of flow-induced self-noise. Unfortunately, such methods are only effective if the duct of the turbomachinery is relatively short, in order to limit the effect of the duct on the radiation pattern of the noise.11Therefore only a few cases, such as certain turbofan engines, and industrial jet fans3can be investigated effectively using such methods.
The measurement technology suggested in this paper allows one to place the microphone array outside of the duct, but close to the rotor under investigation. The measurement
method requires an acoustically transparent duct (ATD) section, which can allow acoustic signals through to the array, while keeping the duct under investigation hydrodynamically sealed. If the amplitude of the signal reaching the microphone array is weak, it can impede the capabilities of the applied beamforming methods in localizing the dominant noise sources. Therefore, in order to guarantee the appropriate operating conditions on behalf of the microphone array, a novel ATD has been designed. This article presents the design methodology of the ATD section along with a low pressure fan case study in order to demonstrate the effectiveness of the design.
The design of an acoustically transparent yet hydrodynamically impenetrable duct is not an easy task. The duct needs to be capable of connecting to a fan, the object under investigation, as well as to other duct sections, in order to recreate the built-in environment of the low pressure fan. Moreover, the ATD has to maintain its shape during the measurements, which requires an appropriate structural strength, similar to that of normal ducts. Another feature, which is required of all duct sections, is that the surface be hydrody- namically impenetrable. The most significant difference between the new design and that of conventional ducts is that the ATD has to allow acoustic signals to pass through its walls to the microphone array, making it possible to collect microphone data, which can then be processed using beamforming technology in order to receive beamforming maps, which local- ize the dominant noise sources. This technology provides a novel method for investigating ducted turbomachinery using phased array microphones and beamforming technology, which can avoid the hardships associated with duct modes and flow-induced self-noise.
Overview of acoustically transparent material literature
The literature provides examples for microphone arrays being placed in the walls of wind tunnels.8,12–14These arrangements are similar to the one developed here, as a noise source is investigated in a flow environment with a microphone array which needs to be protected from the flow. The arrays are located outside of the tunnel, and need an acoustically transparent section on the wall, a window, in order to collect acoustic data. These windows need to let through most of the noise without generating any additional noise and at the same time must protect the microphones from hydrodynamic fluctuations. Earlier investigations8,14have shown that the two most acceptable materials are KevlarVR clothes and metallic clothes. These investigations have shown that both materials are able to protect against hydrodynamic fluctuations and their additional noise is minimal, but flow can pass through the woven surface if the pressure difference on the two sides is sufficient.
When mounted in a wind tunnel, the KevlarVR sheets need to be fastened tightly in order to avoid flapping, which makes it hard to form a duct from this material. In the case of metal clothes, reducing the size of the gaps between weaves in order to ensure a hydrodynamically impenetrable surface ruins the materials acoustic properties.15Based on these requirements, these acoustic window materials are not appropriate for the ATD.
Approaching the topic from a different perspective, there are many acoustic applications for ducts in an industrial environment, as they are often used in the design of sound attenu- ators for a ducted system. These attenuators are traditionally used to reduce the noise trav- eling through a ducted system. The two main components of attenuators are a perforated duct and a sound absorbing layer. The absorbing layer must absorb as much of the noise as possible, so that the harmful noise passing through the ducted system is reduced. It is placed in a layer surrounding the duct in which a gas is being transported. The perforated
sheet is used to separate the sound absorbing material from the cross-section in which the gas is flowing and must let through as much of the noise as possible so that it can be absorbed by the absorbing layer. A perforated duct could therefore be an appropriate component of the ATD, since one of its main design criteria is acoustic transparency. From among the other requirements of the ATD, the structural strength of a perforated duct could also be accept- able, if a thick enough material is chosen, but the impenetrability of the material is not sufficient. The perforations allow the flow through along with the acoustic signals.
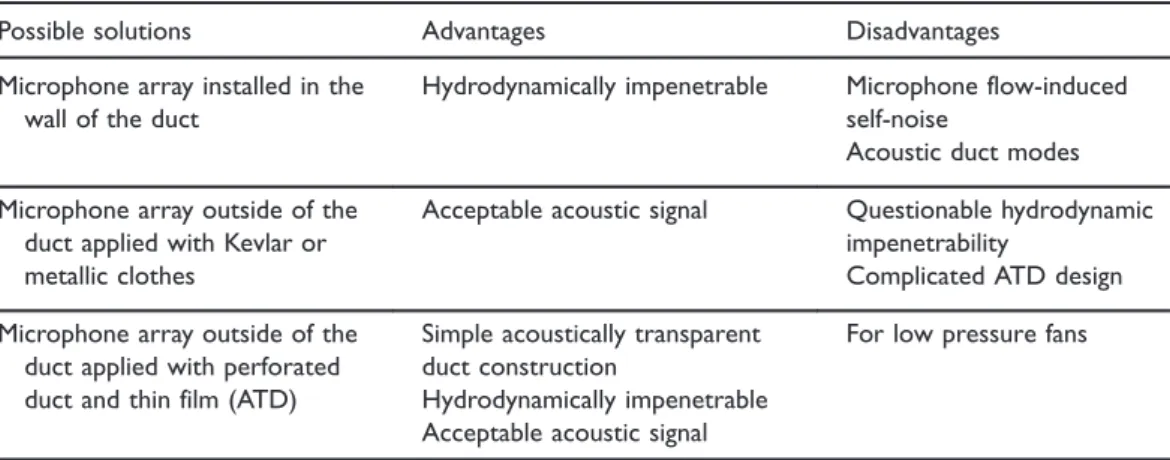
These holes must be closed off without ruining the acoustic features and therefore an impen- etrable material with low acoustic impedance must surround the perforated duct. The imped- ance of a material depends on its thickness and as a result, the acoustic transparency decreases with increasing thickness. For low pressure differences (fans), a thin layer of covering material, such as stretch film, can provide hydrodynamic impenetrability, with an acceptable level of acoustic transparency. For higher pressure differences (compressors and blowers) a thicker, more robust material is needed. Table 1 summarizes the advantages and disadvantages of the possible solutions for the investigation of the noise of a fan in ducted environment.
Design considerations
Perforated duct
Perforated sheets are available in many shapes and sizes, the acoustic characteristics of each being different, but can be determined based on Schultz’s equation (equation (1)).15Using this equation, perforated sheets with various perforations can be categorized based on their acoustic transparency. Equation (1) shows that thinner sheets with holes closer to each other, and with a larger percentage of open area, have a larger Transparency Index (TI) and therefore have better transparency features. On the other hand, apart from their acous- tic properties, the ducts must also keep their original shape. This means that the maximum size of the holes is also limited, even though less noise is blocked by a larger hole.
TI¼nd2
tl2 ¼0:04P
ptl2: (1)
Table 1. Possible solutions for investigating the noise of fans.
Possible solutions Advantages Disadvantages
Microphone array installed in the wall of the duct
Hydrodynamically impenetrable Microphone flow-induced self-noise
Acoustic duct modes Microphone array outside of the
duct applied with Kevlar or metallic clothes
Acceptable acoustic signal Questionable hydrodynamic impenetrability
Complicated ATD design Microphone array outside of the
duct applied with perforated duct and thin film (ATD)
Simple acoustically transparent duct construction
Hydrodynamically impenetrable Acceptable acoustic signal
For low pressure fans
ATD: acoustically transparent duct.
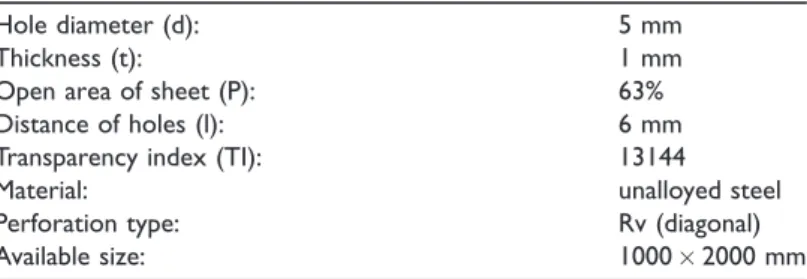
where n is the number of perforations per square inch, d is the diameter of the perforations (in),tis the thickness of the sheet (in),lis the shortest distance between holes (in) and P is the percentage of the open area of the sheet (%), as seen in Figure 1. According to Schultz,15 if a sheet of material has a Transparency Index value of TI¼10,000, then its acoustic attenuation is below 1 dB at a frequency of 10,000 Hz. For lower frequencies the attenuation is expected to be even less. This level of attenuation is acceptable in our case, and therefore the perforated material of the duct of the ATD should have a Transparency Index of at least TI¼10,000. Table 2 provides information regarding the characteristics of the perforated sheet chosen for application in the ATD under development.
The chosen perforated sheet has a TI value of 13,144, which is greater than the minimum value of 10,000. The perforation type refers to the arrangement of the holes, which is in this case Rv, or in other words diagonal. The diameter of each hole is 5 mm, which makes it possible for a sufficient amount of acoustic signal to pass through the sheet, while also ensuring a relatively smooth continuous surface, which takes on the required form of the duct shape. The 1 mm thickness of the material guarantees that the structure for the duct will be sufficiently sturdy. The perforated sheet was used to create a 1 m long section of duct having a diameter of 0.4 m, which is compatible with the spiral wound duct sections of the fan under investigation in the case study.
Covering film
A covering film is used to seal the holes of the perforations and therefore needs to be acoustically transparent while being hydrodynamically impenetrable. The building acoustics literature examines numerous high impedance materials and panels, providing information regarding properties that are important for acoustically absorbing materials, along with measurement techniques for determining them.16–20 In order to do the opposite and reduce the extent of reflected and absorbed sound, a thin and light material having a low acoustic attenuation should be chosen. The attenuation of thin materials will increase with
Figure 1. The geometry of the perforation.15
Table 2. Characteristics of the chosen perforated sheet.
Hole diameter (d): 5 mm
Thickness (t): 1 mm
Open area of sheet (P): 63%
Distance of holes (l): 6 mm
Transparency index (TI): 13144
Material: unalloyed steel
Perforation type: Rv (diagonal)
Available size: 10002000 mm
frequency, due to the fact that the impedance depends on frequency.21Initially, two cover- ing film materials were examined, a thicker and stiffer drop sheet and a thinner and more elastic, low-density polyethylene stretch film, having a thickness of 23mm. For the ATD, a material with a lower attenuation is preferred, in order to have a stronger signal at the microphone array, while the strength of the covering material needs to be sufficient in order to avoid rupture during testing.
Preliminary flow measurements
The perforated duct and the covering film, which is wrapped around outside of the duct, must provide an adequate ducted environment for the flow. The flow must stay inside of the duct and the film must not inflate or separate from the perforated duct. The fan under investigation in the present case study was therefore equipped with both the perforated duct and the covering film for test measurements. The investigated films were fixed with a surface as smooth as the material made it possible, and tensioned with enough strength to provide a hydrodynamically impenetrable duct wall, but the exact tension was not measured.
The stretch film did not inflate or flutter during the test measurement and did not show any sign of weakness. The drop sheet, on the other hand inflated and started to flutter, which is unacceptable for an ATD. The benefits of the stretch film come from its adhesive surface and the elastic features, and therefore, based on the results of the preliminary measurement, the stretch film was chosen as the better choice for the cover film of a low speed fan.
Spiral wound duct sections are often used in standard ducted systems. The seams of such spiral wound aluminum ducts consists of a 1 mm deep groove which winds along the length of the duct section. The perforations of the ATD on the other hand interact with the boundary layer all along the perimeter, having the same 1 mm depth as the seam of the spiral duct. The relative roughness and friction coefficients of such ducts can be calculated with the help of a Moody diagram. Both of the duct sections have approximately the same relative roughness and friction coefficients, and therefore the effect of the surface quality on the boundary layer should be approximately the same and the difference in pressure loss between the two cases is also negligible. In summary, both of the geometrical inconsistencies could disturb the boundary layer to some extent, but for low Reynolds number cases, such as those investigated here, the disturbance caused by such inconsistencies is negligible.
The additional effect of the ATD on boundary layer related noise levels and inlet turbulence related fan noise is thus neglected in this investigation, but should be kept in mind for cases having large Reynolds numbers.
Acoustic characteristic measurements
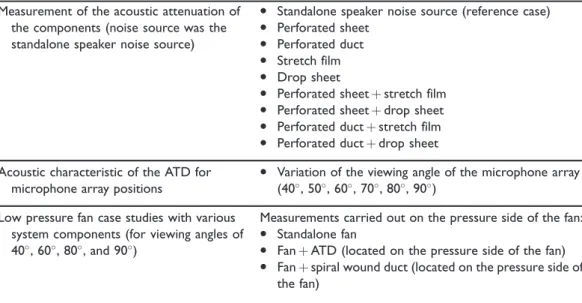
In order to define the acoustic characteristics of the ATD, numerous measurements were carried out. Table 3 summarizes the experimental program, the various elements of which are explained in greater detail in the following sections. The first set of measurements and results aim to show the characteristics of the components of the ATD and the assembled ATD under controlled circumstances. The fan case study shown further on presents the application of the system and the capability of the measurement method (ATD used togeth- er with a microphone array) to localize noise sources when applied in the investigation of turbomachinery.
Beamforming attenuation investigation
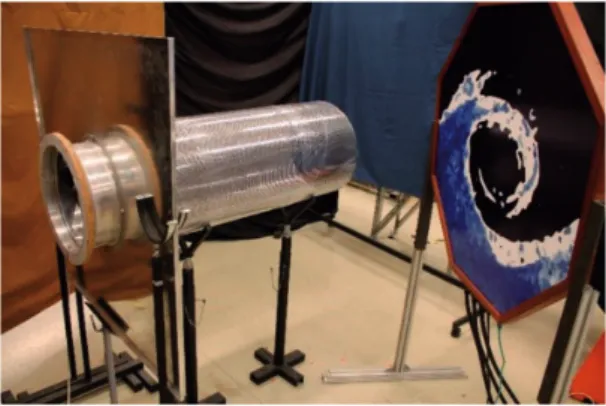
The goal of the first set of acoustic measurements presented here is to determine the acoustic characteristics of the materials built into the ATD. Beamforming data were therefore proc- essed in order to acquire beamforming attenuation information about the investigated materials analogously to single microphone acoustic attenuation measurement methods provided in the literature.16–20 Beamforming maps were also investigated in order to verify the capabilities of the method in localizing noise sources through the various materi- als. An OptiNav Array 24 phased array microphone system was used for the acoustic measurements. The octagonal array consists of 24 microphones and has an aperture of 0.7 m.22During the measurements a standalone speaker noise source was placed 1 m from the array. Flat sections of the materials under investigation were placed a distance of 0.2 m from the source, while ducts were placed over the noise source, positioning the noise source on the axis in the middle of the duct. The resulting distance between the source and the surface of the duct was therefore also 0.2 m. The measurement setup can be seen in Figure 2.
The measurements were carried out in a non-anechoic environment, taking advantage of the properties of beamforming technology, which filters out the disturbing effects of the back- ground noise and reflections, making possible the investigation of the noise sources in an investigated plane. In order to examine a wide frequency range, white noise was generated and investigated for every third octave band in the range of 250 Hz–16 kHz. The CLEAN- SC deconvolution technique was applied during the investigation,23,24with microphone data being collected at a sampling rate of 44 kHz for 20 s. The cross-spectral matrices created during the processing of the data were made using a transform length of 4096, with 6 (dB) being subtracted from the results to account for the pressure doubling at the phased array plate surface.
Table 3. Summary of the acoustic measurements.
Measurement of the acoustic attenuation of the components (noise source was the standalone speaker noise source)
• Standalone speaker noise source (reference case)
• Perforated sheet
• Perforated duct
• Stretch film
• Drop sheet
• Perforated sheetþstretch film
• Perforated sheetþdrop sheet
• Perforated ductþstretch film
• Perforated ductþdrop sheet Acoustic characteristic of the ATD for
microphone array positions
• Variation of the viewing angle of the microphone array (40, 50, 60, 70, 80, 90)
Low pressure fan case studies with various system components (for viewing angles of 40, 60, 80, and 90)
Measurements carried out on the pressure side of the fan:
• Standalone fan
• FanþATD (located on the pressure side of the fan)
• Fanþspiral wound duct (located on the pressure side of the fan)
ATD: acoustically transparent duct.
The first set of data pertains to the reference case of a standalone speaker noise source investigated without any materials placed between the microphone array and the noise source.
The noise source was a Monacor SPH-30X/8 loudspeaker. The BeamForming Peak (BFP) values of each beamforming map are presented in one plot on Figure 3 having an accuracy of 1 dB in accordance with the uncertainty of the microphone array. BFP values refer to those localized noise sources presented in each beamforming map which have the largest beamform- ing value on the given beamforming map. In the cases investigated herein, these should per- tain to the standalone speaker noise source under investigation. The beamforming attenuation of the various materials will be calculated as compared to these values. In our beamforming investigations, the localization of low frequency noise sources is associated with a large spatial uncertainty, since the aperture of the phased array applied in this investigation (0.7 m) is not large enough to localize very low frequency noise sources precisely.
In a next step, the components of the ATD are examined individually, and then combined together in order to study the effect of each component on the attenuation of the beamform- ing results. The beamforming attenuation of each configuration, as compared to the reference case, is calculated according to equation (2), whereBFPreferenceis the beamforming peak of the standalone speaker noise source,BFPcomponentthe measured beamforming peak and BAcomponent is the Beamforming Attenuation in the case of an examined component.
This equation is analogous to those seen in the literature for single microphone acoustic attenuation measurements.17–20
BAcomponent¼BFPreferenceBFPcomponent (2)
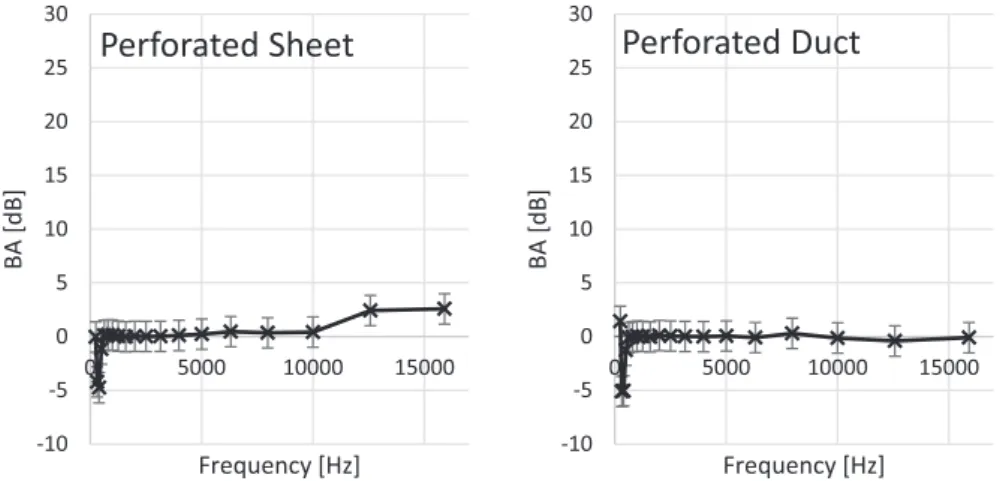
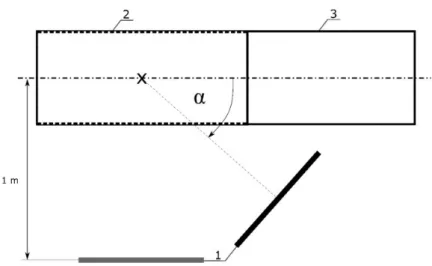
The beamforming attenuations are plotted as a function of frequency in Figures 4 to 6 with error bars of 1.41 dB, because of the uncertainty of the microphone array measurements (1 dB). According to the calculations carried out in thePerforated ductsection, the chosen flat perforated sheet should have little acoustic attenuation under 10 kHz. It is therefore expected Figure 2. The measurement setups (1: microphone array, 2: perforated sheet section, 3: perforated duct, X: noise source).
that the beamforming attenuation will also be minimal. The beamforming attenuation of the flat perforated sheet can be seen on the left hand side of Figure 4. The results oscillate around an almost constant value of zero as a function of frequency, and therefore the beamforming attenuation of the perforated sheet proved to be minimal. Since the perforated sheet used in the ATD will have a cylindrical shape, its acoustic features could differ slightly from those of a flat plate. The right hand side of Figure 4 shows the beamforming attenuation of the perfo- rated duct. The attenuation results are similar to those of the flat perforated sheet. In both cases, the attenuation is very small for the investigated frequency range. At higher frequencies, it is expected that the attenuation will increase, in accordance with Schultz,15which states that for a given TI the acoustic attenuation increases with frequency.
40 50 60 70 80 90 100
0 2000 4000 6000 8000 10000 12000 14000 16000
BFP [dB]
Frequency [Hz]
Figure 3. Spectrum of the beamforming peak values of the white noise generated by the standalone speaker noise source examined for each third octave band.
-10 -5 0 5 10 15 20 25 30
0 5000 10000 15000
BA [dB]
Frequency [Hz]
Perforated Sheet
-10 -5 0 5 10 15 20 25 30
0 5000 10000 15000
BA [dB]
Frequency [Hz]
Perforated Duct
Figure 4. The beamforming attenuation of the perforated sheet (left) and the perforated duct (right) investigated for each third octave band.
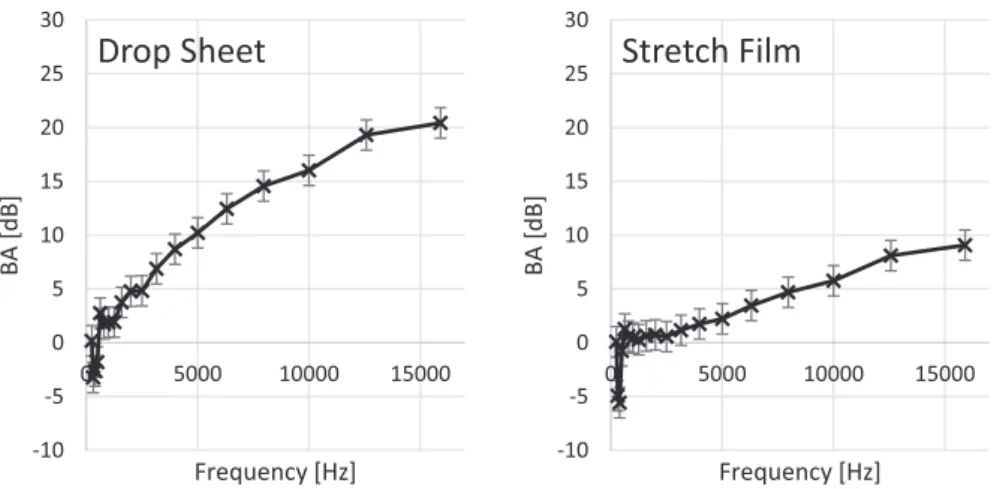
The acoustic characteristics of the films are also a function of frequency. The beamform- ing attenuations of the various films can be seen in Figure 5. These values increase with frequency. According to the data presented on the right side of Figure 5, the stretch film has a better beamforming transparency. The attenuation has lower values than in the case of the drop sheet.
In Figure 6, the diagrams show the beamforming attenuations of the various covering films mounted on the perforated duct. The frequency dependence of the various films appears in all the diagrams, confirming that the beamforming attenuation increases with increasing frequency as expected according to the literature.15,16,21For lower frequencies, resonances are present (values fluctuate), which is in agreement with Lamancusa,16 which shows a low frequency region (Region I), which can be characterized by resonances. It can
-10 -5 0 5 10 15 20 25 30
0 5000 10000 15000
BA [dB]
Frequency [Hz]
Drop Sheet
-10 -5 0 5 10 15 20 25 30
0 5000 10000 15000
BA [dB]
Frequency [Hz]
Stretch Film
Figure 5. The beamforming attenuation of the drop sheet (left) and the stretch film (right) investigated for each third octave band.
-10 -5 0 5 10 15 20 25 30
0 5000 10000 15000
BA [dB]
Frequency [Hz]
Duct + Drop Sheet
-10 -5 0 5 10 15 20 25 30
0 5000 10000 15000
BA [dB]
Frequency [Hz]
Duct + Stretch Film
Figure 6. The beamforming attenuation of the perforated duct with the drop sheet (left) and with the stretch film (right) investigated for each third octave band.
also be seen that the attenuation of the perforated duct and the stretch film is relatively small, while the drop sheet has higher attenuation values.
According to the beamforming attenuation measurements, and the technical features of the two covering materials, the appropriate choice for the covering film of the ATD is the stretch film. In other words, the beamforming attenuation of the stretch film is smaller, and the elasticity and the adhesive surface qualities make it easier to prepare the duct for measurements, making the stretch film the better choice for the covering film of the ATD.
Beamforming map investigation
Other than the beamforming attenuation results, the beamforming maps also need to be examined in order to verify that the ATD components do not hinder the beamforming method in accurately localizing the noise sources. The various components can have different effects on the results, just as in the beamforming attenuation results seen in Figures 4 to 6, and are therefore examined individually and then in a combined manner.
Only those beamforming maps are presented here, which depict the perforated duct, the stretch film, and the perforated duct equipped with the stretch film, as the previous section showed that the drop sheet is not suitable for such an application.
In Figure 7, three different beamforming maps can be seen. These maps were constructed from the same CLEAN-SC beamforming results as those investigated in the previous sec- tion. CLEAN-SC beamforming maps were used in order to provide clear results, which can be presented on a single figure, removing the effects of the sidelobes.24Nineteen third octave frequency bins were investigated, and all of the BFPs are displayed simultaneously in montages for the reference case (standalone speaker noise source), the perforated duct, and the perforated duct equipped with the stretch film. Table 4 gives the center frequencies of the examined third octave bins. The top beamforming map in Figure 7 presents the noise source localization for the reference noise source. The middle figure shows the results for the case of the perforated duct, and the bottom figure shows the results of the assembled ATD.
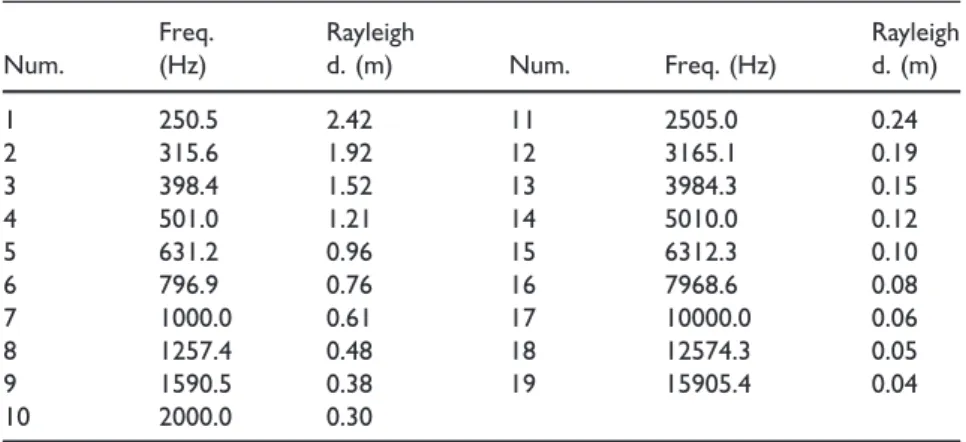
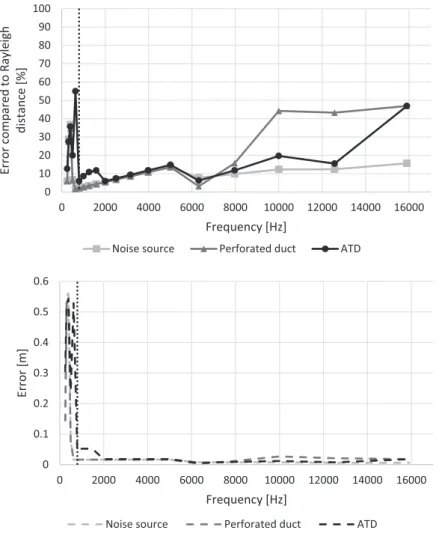
Figure 8 shows the true distance between the real location of the noise source and the location of the source on the beamforming map. The distances are also presented as a percentage of Rayleigh distance for each octave band center frequency. The Rayleigh distance (equation (3)) gives the theoretical resolution of the microphone array (smallest distance for which two noise sources can be distinguished).
r¼1:25kL
D (3)
whereris the Rayleigh distance (m),kis the wavelength (m),Lis the distance between the source and the microphone array (1 m) and D is the aperture of the array (0.7 m).
The Rayleigh distances for the center frequencies of the investigated third octave bands are shown in Table 4. For all of the third octave bands investigated here, the localizations meet the requirement of being closer to the real location of the noise source than one Rayleigh distance, as can be seen in the top part of Figure 8. Below 796.9 Hz (Num.6), the absolute distance between the localization and the true noise source location is much larger than the localizations at larger frequencies, as can be seen in the bottom part of Figure 8. Therefore, these localizations are not acceptable, and define a low frequency limit for the investigations. The reason behind these misaligned localizations is the inability
of the method to accurately localize sources at low frequencies if the phased array aperture is not suitable. According to the three beamforming maps and the diagrams, the accuracy of the localization is the same for all the cases in the range of 796.9–15905.4 Hz, and the ATD does not influence the localization.
Figure 7. Beamforming maps of the standalone speaker noise source (top), the noise source with the perforated duct (middle) and the noise source with the acoustically transparent duct (bottom) for the investigated frequencies. X marks the center of the standalone speaker noise source.
Table 4. The center frequency values and Rayleigh distances of the examined frequency bins.
Num.
Freq.
(Hz)
Rayleigh
d. (m) Num. Freq. (Hz)
Rayleigh d. (m)
1 250.5 2.42 11 2505.0 0.24
2 315.6 1.92 12 3165.1 0.19
3 398.4 1.52 13 3984.3 0.15
4 501.0 1.21 14 5010.0 0.12
5 631.2 0.96 15 6312.3 0.10
6 796.9 0.76 16 7968.6 0.08
7 1000.0 0.61 17 10000.0 0.06
8 1257.4 0.48 18 12574.3 0.05
9 1590.5 0.38 19 15905.4 0.04
10 2000.0 0.30
Effect of viewing angle
In the investigation of the acoustic features of the ATD, the measurements were carried out for a viewing angle (a) of 90 (defined in Figure 9), for which the microphone array is parallel with the axis of the ATD. Fan measurements on the other hand are generally carried out for a viewing angle of 0, which means that the plane of the microphone array should be perpendicular to the axis of the fan and hence the ATD. The investigation of a fan with a ducted environment makes the perpendicular measurements impossible, and hence the measurements must be carried out at a viewing angle of some degree. The characteristics of the ATD therefore have to be examined for different viewing angles.
In Figure 10, the noise source localization can be seen in the case of three different viewing angles (90, 60, 40), with the standalone speaker noise source located at a distance of 1 m from the microphone array and on the axis of the ATD. The measurements were conducted using a broadband white noise signal. The beamforming source maps were
0 10 20 30 40 50 60 70 80 90 100
0 2000 4000 6000 8000 10000 12000 14000 16000 Error compared to Rayleigh distance [%]
Frequency [Hz]
Noise source Perforated duct ATD
0 0.1 0.2 0.3 0.4 0.5 0.6
0 2000 4000 6000 8000 10000 12000 14000 16000
Error [m]
Frequency [Hz]
Noise source Perforated duct ATD
Figure 8. The absolute (bottom) and relative error of the source localization as compared to the Rayleigh distance (top) for the examined frequency range. The dotted lines show the lower frequency limit (800 Hz).
created using the CLEAN-SC deconvolution technique for the third octave bands within the frequency range of applicability of the system, 800–16,000 Hz. The center frequency values are shown in Table 4 (from number 6 to 19). The accuracy of the localization is quite similar for the three viewing angles. Based on the results of the investigation, the correctness of the noise source localization does not depend on the viewing angle, as the noise sources are localized with similar accuracy for all the viewing angles.
The spectral results also need to be examined along with the beamforming maps.
The attenuation of the ATD was calculated in accordance with equation (2) for each Figure 9. Definition of the viewing angle of the microphone array (a), where X marks the location of the standalone speaker noise source, 1: microphone array, 2: ATD, 3: spiral wound duct section.
ATD: acoustically transparent duct.
Figure 10. Noise source localization at various viewing angles for the defined frequency range (800–16,000 Hz) for each third octave band. The center frequency values are shown in Table 4 (from number 6 to 19) and X marks the center of the noise source.
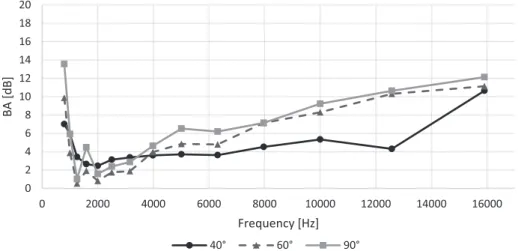
third octave band. In Figure 11, beamforming attenuation results are provided for various viewing angles.
According to Figure 11, the beamforming attenuation does not change drastically as a function of viewing angle. Therefore, taking all of the above information into consideration, the viewing angle does not have a significant effect on the beamforming attenuation or the noise source localization, and therefore the ATD can be applied in investigations which span a wide range of angles. Keep in mind that in every case the ATD needs to be calibrated for the given measurement setup and viewing angle for which it is to be applied. In the remaining part of the article, a viewing angle of 40will be used for the measurements, since this angle provides the most direct view of the fan.
Fan case study
The ATD presented in this paper has been designed for use in the investigation of low speed axial flow fans. This section introduces an axial fan case study in order to showcase the capabilities of the system and to check for any further limitations. Various configurations (Table 3) have been measured in order to provide a comparison of the unducted, ducted, and ATD cases for the same fan. Figure 12 presents the measurement setup with the fan, the microphone array, and the ATD. The other two measurement set-ups provide an oppor- tunity for; (A) The measurement of all the noise radiating from the fan, without any abatement, having the lack of the duct environment (Figure 13); (B) the measurement of the proper flow field experienced in a normal duct, which is limited by the acoustic shielding and duct modes experienced as a result of the ducts’ material (Figure 14). The ATD is designed to bridge the gap between A and B, and is therefore expected to guarantee a proper flow field while allowing for the radiation of most of the noise to the phased array microphone system (Figure 15).
The fan under investigation is a small industrial axial flow fan, which produces a small pressure rise. It is a rotor-only configuration having five forward-skewed blades, built into a
0 2 4 6 8 10 12 14 16 18 20
0 2000 4000 6000 8000 10000 12000 14000 16000
BA [dB]
Frequency [Hz]
40° 60° 90°
Figure 11. The attenuation of the ATD in the case of three different viewing angles (40, 60, 90) for the defined frequency range (800–16,000 Hz).
ATD: acoustically transparent duct.
short duct with the help of a support, which spans the diameter of the duct. The fan has a diameter of 300 mm, a hub-to-tip ratio of 0.30, a tip clearance (relative to the span) of 0.066, and has a rotational speed of 1430 r/min, resulting in a global flow coefficient (annulus area- averaged axial velocity normalized by blade tip velocity) of 0.316. The fan chosen for the case study has been the subject of multiple case studies, and its geometrical, aerodynamic, as well as acoustic properties are therefore well documented.25–27The ATD will provide a new means for analyzing the fan in order to study the effect of the ducted flow on the acoustic properties of the fan. The beamforming maps will be analyzed in future investigations in order to define the typical noise generation mechanisms of the fan in a ducted environment, for instance turbulence ingestion noise, boundary layer noise, trailing edge noise, tip noise.26 As seen in the measurement set-up presented in Figure 12, the same OptiNav Array 24 phased array microphone system is used for the investigation as was used in the measure- ments presented in earlier sections.22 The array is located at a distance of 1.2 m from the center of the fan, at an angle of 40 with regard to the downstream axis of the fan.
Figure 12. Measurement setup with the microphone array, the fan, and the acoustically transparent duct.
Figure 13. Beamforming map of the isolated fan at a central frequency value of 3014.6 Hz, and a bandwidth of 21.5 Hz with a BFP value of 52.1 dB.
BFP: beamforming peak.
Acoustic measurements were carried out for 2 s with a sampling rate of 44 kHz. The micro- phone data were processed using Delay-and-sum beamforming in the frequency domain2 with a transform length of, 4096 and with 6 dB being subtracted from the results to account for the pressure doubling at the phased array plate surface. During the processing of the measurements, the convection effects of the in-duct flow were neglected due to the low velocity of the flow, which was below 5 m/s. Narrowband results are presented in this section.
The plane under investigation is the one which passes through the center of the fan.
Comparing the three beamforming maps presented in Figures 13 to 15, it can be seen that the results of the test cases are somewhat different, while having many similarities.
The unducted case presented in Figure 13 shows the capabilities of the beamforming method in localizing noise sources to the fan when a clear view of the noise source is available. Mind you that the beamforming maps were created using Delay-and-sum Figure 15. Beamforming map of the fan equipped with the acoustically transparent duct at the central frequency value of 3014.6 Hz, and a bandwidth of 21.5 Hz with a BFP value of 51.0 dB.
Figure 14. Beamforming map of the fan with a spiral wound duct at a central frequency value of 3014.6 Hz, and a bandwidth of 21.5 Hz with a BFP value of 42.0 dB.
BFP: beamforming peak.
beamforming in the frequency domain, and therefore the noise sources cannot be localized to individual blade sections, as would be possible with other more advanced beamforming methods, designed for turbomachinery applications, such as ROSI.27,28Such investigations are beyond the scope of this study, since the investigation of the acoustic features of the ATD is the topic of this report and not the investigation of the noise sources of a fan.
The beamforming map of the ATD presented in Figure 15 is very similar to that of the unducted case, confirming the applicability of the ATD in turbomachinery testing. Notice that the difference in level is minimal between the two cases. The case of the normal duct is presented in Figure 14. The localization of the noise sources in this case is expected to be unsuccessful, due to the limited acoustic transparency of the duct. The distribution of the noise sources on the beamforming map supports this hypothesis, and they are therefore either sidelobes of the duct modes radiating from the end of the duct, or vibroacoustic noise sources located on the support structure, neither of which provide us with any useful information regarding the localization of the noise sources. On the other hand, it is interesting to notice that the amplitudes are significantly weaker than those seen for the unducted case and the case of the ATD. It is therefore important to investigate this amplitude difference, since the ATD is expected to remove this effect from the results, only minimally altering the acoustic signals which are radiating from the fan.
Figure 16 presents the BFP Level spectra of the three cases presented above. The spec- trum of the ambient noise (dotted light gray curve), which can be below zero according to the beamforming calculations (not to be confused with sound pressure level calculations), is also shown on the diagram. The difference between the spectral results of the three cases and the ambient noise is over 20 dB for the entire frequency range under investigation, and therefore its influence on the measurement results is negligible. The black curve shows the spectra of the isolated fan while the dotted black curve presents that of the spiral wound duct. Comparing the two curves, in the investigated frequency range the duct limits the amount of noise reaching the array. The difference between the two curves can reach values
-10 0 10 20 30 40 50 60 70 80 90 100
0 1000 2000 3000 4000 5000 6000 7000 8000
BFpeak [dB]
Frequency [Hz]
Isolated fan Fan with acouscally transparent duct
Ambient noise Fan with spiral wound duct
Figure 16. Beamforming peak spectra of the isolated fan (black), the fan with a spiral wound duct (dotted black), the fan with the acoustically transparent duct (light gray), and the ambient noise (dotted light gray).
of up to 10 dB along a large frequency range. The BFP measured for the case of the ATD therefore needs to show similar qualities to that of the unducted fan.
The light gray curve presented in Figure 16 presents the BFP of the ATD. This curve is located between the curves of the other two cases, but located much closer to the curve of the unducted case in the range under investigation (800–7000 Hz in accordance with the lower limit of the ATD and with former studies3,26). The amplitudes of these two test cases are not required to be identical, because the flow conditions are different, but the amplitudes of the acoustic signals for most of the frequencies should be similar, as they are. Such results support the findings described in the earlier sections and verify the effectiveness of the ATD when applied in the investigation of a low pressure fan case study.
The results of this investigation, confirm that there is a wide frequency range (from approximately 800 Hz to 7000 Hz), in which the newly developed ATD provides a means for accurately collecting phased array microphone data with a microphone array placed outside of the duct of the turbomachinery. The acoustic data can be processed using beam- forming technology in order to localize the noise sources, avoiding hardships associated with in duct measurements. The data collected below the lower frequency limit need to be treated with caution, though custom ATD and array designs should be able to expand or shift the range of applicability as necessary.
Conclusions
The aim of this research was to create a testbed, which makes it possible to investigate turbomachinery, as a noise source, in a ducted environment using a freestanding micro- phone array. An ATD was therefore designed, providing the microphone array with a window for collecting acoustic signals and a ducted environment for the flow. The final design, for the low pressure case, is a perforated duct covered with a stretch film. Thanks to the perforated plate, the duct has a sturdy duct shape and lets through most of the acoustic signal, as could be seen in the beamforming attenuation results. The chosen covering film has low acoustic impedance, which ensures a small level of acoustic attenuation, while being strong enough to ensure the hydraulic impenetrability of the duct for cases such as low pressure fans. The attenuation is low, and the localization of the noise sources using beam- forming technology has been shown to be accurate over a wide frequency range (800–
16,000 Hz). According to the results of the fan case study, the newly developed ATD meets the requirements set before it, successfully localizing fan noise sources, making it possible to investigate low pressure fans, localizing, understanding, and then eliminating noise sources. Designs for high pressure test cases are also under development, but require further examination.
Acknowledgements
We would like to extend our appreciation to Bob Dougherty for suggesting the idea of an acoustically transparent duct. We would also like to thank Bence Papp for taking part in the measurements. The work relates to the scientific programs “Development of quality-oriented and harmonized RþDþI strategy and the functional model at BME” (Project ID: TA´MOP-4.2.1/B-09/1/KMR-2010–0002) and “Talent care and cultivation in the scientific workshops of BME” (Project ID: TA´MOP-4.2.2/
B-10/1–2010-0009).
Declaration of conflicting interests
The author(s) declared no potential conflicts of interest with respect to the research, authorship, and/or publication of this article.
Funding
The author(s) disclosed receipt of the following financial support for the research, authorship, and/or publication of this article: This work has been supported by the Hungarian National Research, Development and Innovation Centre under contract No. K 119943, and the Ja´nos Bolyai Research Scholarship of the Hungarian Academy of Sciences, and the Kor€€os Campus Foundation.
References
1. Benedek T and Vad J. Study on the effect of inlet geometry on the noise of an axial fan, with involvement of the phased array microphone technique. In: Proceedings of ASME turbo expo, Seoul, South Korea, 13–17 June 2016, paper no. GT2016-57772.
2. Mueller TJ.Aeroacoustic measurements. Berlin: Springer–Verlag, 2002, pp.62–97.
3. To´th B and Vad J. Challenges in evaluating beamforming measurements on an industrial jet fan.
In: Proceedings of conference on modelling fluid flow, Budapest, Hungary, 1–4 September 2015, p.186.
4. Dougherty RP, Walker BE and Sutliff DL. Locating and quantifying broadband fan sources using in-duct microphones. In: 16th AIAA/CEAS aeroacoustics conference, Stockholm, Sweden, 7–9 June 2010, paper no. AIAA–2010–3736.
5. Sutliff DL. Turbofan duct mode measurements using a continuously rotating microphone rake.
Int J Aeroacoustics2007; 6: 147–170.
6. Heo Y-H, Ih J-G, Bode´n H. In-duct identification of a rotating sound source with high spatial resolution.J Sound Vibr2015; 357: 51–73.
7. Podboy GG and Horva´th C. Phased array noise source localization measurements, made on a Williams International FJ44 engine. In:15th AIAA/CEAS aeroacoustics conference (30th AIAA aeroacoustics conference), Miami, Florida, 11–13 May 2009, paper no. AIAA 2009-3183.
8. Jaeger SM, Horne WC and Allen CS. Effect of surface treatment on array microphone self-noise.
In:AIAA/CEAS aeroacoustics conference, 12–14 June 2000, paper no. AIAA-2000-1937.
9. Tyler JM and Sofrin TG. Axial flow compressor, noise.SAE technical paper, 1962.
10. Benedek T and To´th P. Beamforming measurements of an axial fan in an industrial environment.
Per Pol Mech Eng2013; 57: 37–46.
11. Lowis CR and Joseph PF. Determining the strength of rotating broadband sources in ducts by inverse methods.J Sound Vibr2006; 295: 614–632.
12. Horva´th C, Envia E and Podboy GG. Limitations of phased array beamforming in open rotor noise source imaging.AIAA J2014; 52: 1810–1817.
13. Horva´th C. Beamforming investigation of dominant counter-rotating open rotor tonal and broad- band noise sources.AIAA J2015; 53: 1602–1611.
14. Fleury V, Coste L and Davy R. Optimization of microphone array wall mountings in closed- section wind tunnels.AIAA J2012; 50: 2325–2335.
15. Schultz TJ.Acoustical uses for perforated metals: principles and applications, 1986.
16. Lamancusa JS.Noise control: transmission of sound through structures, www.mne.psu.edu/laman cusa/me458/ (2000).
17. Beranek LL and Ver IL. Noise and vibration control engineering: principles and application.
New York: John Wiley & Sons, 1992.
18. Cobo P, Ranz C, Santiago JS, et al. Insertion loss measurements of an acoustical enclosure by using sound power and MLS methods.J Acoust Soc Am1998; 103.
19. ISO 3741:2010. Acoustics: determination of sound power levels and sound energy levels of noise sources using sound pressure – precision methods for reverberation test rooms.
20. Piana EA and Marchenisini A. A simple test, procedure to determine the sound transmission loss of precast panels. In: Proceedings of ISMA2012-USD2012, Leuve, Belgium, 17–19 September 2012.
21. Morse PM, Ingard KU.Theoretical acoustics. Princeton, New Jersey: Princeton University Press, 1968, pp.261–270.
22. Optinav Inc., Phased array 24, www.optinav.info/Array-24.htm.
23. Sijtsma P. CLEAN based on spatial source coherence. In:13th AIAA/CEAS aeroacoustics con- ference, Rome, Italy, 21–23 May 2007, paper no. AIAA 2007-3634.
24. Yardibi T, Zawodny NS, Bahr C, et al. Comparison of microphone array processing techniques for aeroacoustic measurements.Int J Aeroacoustics2010; 9: 733–762.
25. Benedek T and Vad J. Concerted aerodynamic and acoustic diagnostics of an axial flow industrial fan, involving the phased array microphone technique. In: ASME turbo expo, Du¨sseldorf, Germany, 16–20 June 2014, paper no. GT2014-25916.
26. Benedek T and Vad J. Spatially resolved acoustic and aerodynamic studies upstream and down- stream of an industrial axial fan with involvement of the phased array microphone technique. In:
Proceedings of 11th European conference on turbomachinery fluid dynamics and thermodynamics, Madrid, Spain, 23–25 March 2015, paper no. 128.
27. Benedek T and Vad J. An industrial onsite methodology for combined acoustic-aerodynamic diagnostics of axial fans, involving the phased array microphone technique.Int J Aeroacoustics 2016; 15: 81–102.
28. Sijtsma P, Oerlemans S and Holthusen H. Location of rotating sources by phased array measure- ments. In:Proceedings of the 7th AIAA/CEAS aeroacoustics conference, Maastricht, Netherlands, 28–30 May 2001, paper no. AIAA 2001-2167.