Nanoscale
COMMENT
Cite this:Nanoscale, 2018,10, 20863
Received 22nd March 2018, Accepted 10th October 2018 DOI: 10.1039/c8nr02377h rsc.li/nanoscale
Comment on “ Causation or only correlation?
Application of causal inference graphs for
evaluating causality in nano-QSAR models ” by N. Sizochenko, A. Gajewicz, J. Leszczynski and T. Puzyn, Nanoscale , 2016, 8, 7203
Domonkos Attila Tasi, *aJózsef Csontos,bBalázs Nagy, cZoltán Kónya cand Gyula Tasi c
In this comment we show that the accuracy of a recent nano-QSAR model for toxicity predictions of metal oxide nanoparticles towards bacteria E. colican be greatly improved. On one hand, the experi- mental ionization energies of metal atoms could be substituted for the erroneous semi-empirically derived heat of formation values of metal ions as descriptors to construct a more reliable nano-QSAR model based on weighted linear least-squares fittings. On the other hand, if no experimental data is available, a model relying on ionization energy descriptors from quantum chemical calculations could also be used producing exactly the same toxicity values as the experimental model.
In a recent paper,1 Leszczynski et al. have studied causality relations among toxicity data of metal oxide nanoparticles (NPs) towards bacteriaE. coliand several descriptors character- izing the whole chemical structures of metal oxide NPs and their atomic constituents (e.g., standard enthalpies of for- mation of gaseous metal ions, in the same oxidation states as in the oxides, charges, radii and polarization powers of the metal ions in question, etc.). For the computation, the PM6 semi-empirical quantum chemical method2 was used. Of the twelve quantum chemical descriptors studied, however, the standard enthalpy of formation of gaseous metal ions (ΔHMe+) turned out to be the most reliable one.3 Causality analysis revealed that there was a strong causality relation between these descriptors and the toxicity data of the metal oxide NPs.1 Finally, they concluded that the enthalpy of formation of metal ions was the most relevant descriptor determining the toxicity of the metal oxide NPs.
Let us consider the ionization process of a gaseous metal atom:
Me!Meqþþqe ð1Þ
According to this process, the standard enthalpy of for- mation of the metal ion is as follows:
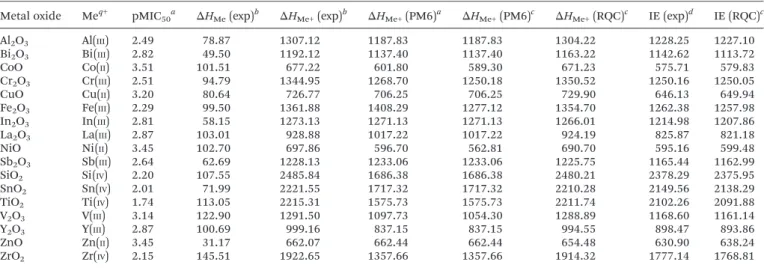
ΔHMeþ¼ΔHMeþIE ð2Þ whereΔHMeand IE are the standard enthalpy of formation of the gaseous metal atom and the cumulative ionization energy needed to remove the electrons from the neutral atom, respect- ively. Lots of ΔHMe and IE experimental data for atoms and atomic ions are available in the literature.4Table 1 contains all the data used in this study. The pMIC50toxicity, which is the negative decimal logarithm of the minimum inhibitory concentration, where 50% of the isolates are inhibited, and ΔHMe+(PM6) data in column 6 of Table 1 were taken from the paper1of Leszczynskiet al.
A careful analysis of their published data1reveals that 9 of the 17 PM6 standard enthalpies of formation are in error. In five cases–Co(II), Cr(III), Fe(III), Ni(II), V(III)–the spin multipli- cities assigned for the ground states of atomic ions differ from the real ones, and the standard enthalpies of formation obtained are too high. The largest deviation is more than 130 kcal mol−1 for Fe(III). For ions with the highest positive charges, Si(IV), Sn(IV), Ti(IV), Zr(IV), the computed standard enthalpies of formation are too low: the differences are more than 500 kcal mol−1with respect to the experimental values. It is especially high for Si(IV): ∼800 kcal mol−1. These errors warrant us to replace the PM6 standard enthalpies of for- mation in question with experimental or more sophisticated computed ones.
aDepartment of Physical Chemistry and Materials Science, University of Szeged, Rerrich Béla tér 1, H-6720 Szeged, Hungary. E-mail: dtasi@chem.u-szeged.hu
bDepartment of Physical Chemistry and Materials Science, Budapest University of Technology and Economics, P.O. Box 91, H-1521 Budapest, Hungary
cDepartment of Applied and Environmental Chemistry, University of Szeged, Rerrich Béla tér 1, H-6720 Szeged, Hungary
This journal is © The Royal Society of Chemistry 2018 Nanoscale, 2018,10, 20863–20866 | 20863
Open Access Article. Published on 16 October 2018. Downloaded on 3/25/2019 5:51:52 AM. This article is licensed under a Creative Commons Attribution 3.0 Unported Licence.
View Article Online
View Journal | View Issue
The quality of the experimental standard enthalpies of for- mation and ionization energies can be guessed with the help of our computed results. Table 1 also contains our computed standard enthalpies of formation and ionization energies for ions and atoms, respectively, by relativistic quantum chemistry (RQC). The def2-TZVPP and def2-QZVPP basis sets of Ahlrichs and associates,5,6and for bismuth the segmented all-electron relativistically contracted (SARC) basis set of Neese and co- workers7 were utilized in the quantum chemical calculations.
The Hartree–Fock energies were assumed to be converged with the def2-QZVPP basis set. However, the MP2, CCSD, CCSD(T), CCSDT, and CCSDT(Q) correlation energies were extrapolated to the complete basis set limit using the inverse cubic formula of Helgaker and coworkers8 along with the def2-TZVPP and def2-QZVPP basis sets.
For third- and fourth-row elements scalar relativistic effects were described with the help of the second-order Douglas–
Kroll–Hess (DKH) Hamiltonian.9,10 In these calculations the so-called point charge nucleus model was utilized. For elements below the fourth row, scalar relativistic contributions were included by means of the Stuttgart-Dresden effective core potentials (ECP).11,12 Nonrelativistic and ECP results were obtained with the MRCC suite of quantum chemical programs,13 while DKH computations were performed using the ORCA package.14 In the calculations all electrons were correlated, except, of course, the core electrons described by ECPs. We also repeated the PM6 calculations for all heat of formation values of metal ions with the proper settings. For these calculations the MOPAC2016 package15was used.
Fig. 1 shows the correlation between the experimental and our corrected PM6- and RQC-computed ionization energies.
The exceptionally good performance of the RQC over PM6 can clearly be seen. (For RQC the regression coefficient is 0.995 ± 0.002; Pearson’s correlation coefficient (r) is 0.9999; and the standard deviation (sr) is 7.90 kcal mol−1. For PM6 the
regression coefficient is 0.804 ± 0.067; Pearson’s correlation coefficient (r) is 0.9373; and the standard deviation (sr) is 177.07 kcal mol−1.) The same is true for the computed standard enthalpies of formation. It is worth noting that due to fortuitous error cancellations, energy differences, e.g., ionization energies, can be more precisely obtained by quantum chemistry than discrete energy values,e.g., standard enthalpies of formation. That is why ionization energies are more favorable than enthalpies of formation as descriptors.
PRESS and R statistics16performed on the set of toxicity data in relation to the ionization energies revealed that two Table 1 Toxicity data for the metal oxide NPs and descriptor values for the constituent metal atoms and ions (heats of formation and ionization energies in kcal mol−1)
Metal oxide Meq+ pMIC50a ΔHMe(exp)b ΔHMe+(exp)b ΔHMe+(PM6)a ΔHMe+(PM6)c ΔHMe+(RQC)c IE (exp)d IE (RQC)c
Al2O3 Al(III) 2.49 78.87 1307.12 1187.83 1187.83 1304.22 1228.25 1227.10
Bi2O3 Bi(III) 2.82 49.50 1192.12 1137.40 1137.40 1163.22 1142.62 1113.72
CoO Co(II) 3.51 101.51 677.22 601.80 589.30 671.23 575.71 579.83
Cr2O3 Cr(III) 2.51 94.79 1344.95 1268.70 1250.18 1350.52 1250.16 1250.05
CuO Cu(II) 3.20 80.64 726.77 706.25 706.25 729.90 646.13 649.94
Fe2O3 Fe(III) 2.29 99.50 1361.88 1408.29 1277.12 1354.70 1262.38 1257.98
In2O3 In(III) 2.81 58.15 1273.13 1271.13 1271.13 1266.01 1214.98 1207.86
La2O3 La(III) 2.87 103.01 928.88 1017.22 1017.22 924.19 825.87 821.18
NiO Ni(II) 3.45 102.70 697.86 596.70 562.81 690.70 595.16 599.48
Sb2O3 Sb(III) 2.64 62.69 1228.13 1233.06 1233.06 1225.75 1165.44 1162.99
SiO2 Si(IV) 2.20 107.55 2485.84 1686.38 1686.38 2480.21 2378.29 2375.95
SnO2 Sn(IV) 2.01 71.99 2221.55 1717.32 1717.32 2210.28 2149.56 2138.29
TiO2 Ti(IV) 1.74 113.05 2215.31 1575.73 1575.73 2211.74 2102.26 2091.88
V2O3 V(III) 3.14 122.90 1291.50 1097.73 1054.30 1288.89 1168.60 1161.14
Y2O3 Y(III) 2.87 100.69 999.16 837.15 837.15 994.55 898.47 893.86
ZnO Zn(II) 3.45 31.17 662.07 662.44 662.44 654.48 630.90 638.24
ZrO2 Zr(IV) 2.15 145.51 1922.65 1357.66 1357.66 1914.32 1777.14 1768.81
aRef. 1.bRef. 4.cThis work.dBy eqn (2) usingΔHMe(exp) andΔHMe+(exp) from this table.
Fig. 1 Correlation between the experimental and calculated ionization energies.
Comment Nanoscale
20864|Nanoscale, 2018,10, 20863–20866 This journal is © The Royal Society of Chemistry 2018 Open Access Article. Published on 16 October 2018. Downloaded on 3/25/2019 5:51:52 AM. This article is licensed under a Creative Commons Attribution 3.0 Unported Licence.
View Article Online
toxicity values were outliers (SiO2 and V2O3). After removing them, our training set consists of data for 15 metal oxide NPs.
Let us perform simple linear regressions16based on ordin- ary linear least-squares method (OLLS), with model function pMIC50=aIE +b, for the toxicity data using ionization energies (or standard enthalpies of formation) as descriptors. The first four lines of Table 2 show the statistics for these fittings.
According to Table 2, all the models have almost equal goodness. It is known that the application of the OLLS method requires error-free independent variables and a dependent variable with uniform error. We can also perform, however, weighted linear least-squares (WLLS) fittings16with the follow- ing weights for the toxicity data:
wi¼ ðpMIC50Þ2i
Pm
k¼1ðpMIC50Þ2k
ð3Þ
It can be seen that 0 <wi≤1, and higher toxicity involves higher precision. The last two rows of Table 2 have been obtainedviaWLLS fittings using eqn (3) as weights. It is to be seen that the two models are equivalent in their performance.
Because, in several cases, the PM6 results carry consider- able errors neither the OLLS nor the WLLS method can be used for linear regression.
Recently, Leszczynskiet al.have also considered two metal oxide NPs which do not belong to the training set:17Mn2O3
and WO3. Unfortunately, no experimental toxicity data are available for them. For the Mn atom, both experimental4 (1308.50 kcal mol−1) and theoretical ionization energies (1302.76 kcal mol−1, this study) are available. The reported predicted value for its toxicity is 2.84 based on PM6 standard enthalpy of formation.17The models corresponding to the last two rows of Table 2 supply a slightly lower value: 2.58. As for WO3, no experimental ionization energy is available for W(VI).
Our computed value is 4639.17 kcal mol−1. Considering the range of the ionization energies in Table 1, this is out of the domain of the training set. Since every model is only valid in its own IE range used to construct the model, in other words, only interpolation is allowed in this domain, therefore no reliable prediction for WO3 can be made via the nano-QSAR models. The same holds for SiO2, where the IE of Si atom is slightly out of range considering that both the experimental and RQC-computed values are around 2380 kcal mol−1. For
V2O3, which was also an outlier, the experimental pMIC50is 3.14, while our computed value is 2.73 with both the RQC- and the experimental-IE-based models. Assuming that our nano- QSAR models yield accurate toxicity for every NP, where the IE of the constituent metal atom is in the range of the training set, the experimental pMIC50 for V2O3 is very likely to be in error, and repetition of this toxicity measurement is recommended.
In summary, we discussed that the recently published PM6-based heat of formation values used as descriptors for nano-QSAR models were in error for many transition metal ions, therefore toxicity predictions for metal oxide NPs based on them are not reliable. In this comment we revealed that by using the weighted linear least-squares method, it is possible to construct better nano-QSAR models based on either experi- mentally or quantum chemically derived atomic ionization energies instead of the ionic enthalpies of formation from semi-empirical calculations.
Con fl icts of interest
There are no conflicts to declare.
References
1 N. Sizochenko, A. Gajewicz, J. Leszczynski and T. Puzyn, Nanoscale, 2016,8, 7203–7208.
2 J. J. P. Stewart,J. Mol. Model., 2007,13, 1173–1213.
3 T. Puzyn, B. Rasulev, A. Gajewicz, X. Hu, T. P. Dasari, A. Michalkova, H.-M. Hwang, A. Toropov, D. Leszczynska and J. Leszczynski,Nat. Nanotechnol., 2011,6, 175.
4 W. M. Haynes,CRC handbook of chemistry and physics, 96th Edition (Internet Version 2016), CRC Press/Taylor and Francis, Boca Raton, FL, 2016.
5 A. Schäfer, H. Horn and R. Ahlrichs,J. Chem. Phys., 1992, 97, 2571–2577.
6 F. Weigend and R. Ahlrichs,Phys. Chem. Chem. Phys., 2005, 7, 3297–3305.
7 D. A. Pantazis and F. Neese,Theor. Chem. Acc., 2012,131, 1292.
8 T. Helgaker, W. Klopper, H. Koch and J. Noga, J. Chem.
Phys., 1997,106, 9639–9646.
Table 2 Statistics for the ordinary (OLLS) and weighted (WLLS) linear least-squaresfittings of the toxicity data using experimental (exp) and quantum chemically calculated (RQC) descriptorsa
Descriptor Method sr r â bˆ F
IE (exp) OLLS 0.1798 −0.9469 −0.510 ± 0.048 2.721 ± 0.046 113
ΔHMe+(exp) OLLS 0.1728 −0.9510 −0.512 ± 0.046 2.721 ± 0.045 123
IE (RQC) OLLS 0.1799 −0.9468 −0.510 ± 0.048 2.721 ± 0.046 112
ΔHMe+(RQC) OLLS 0.1732 −0.9508 −0.512 ± 0.046 2.721 ± 0.045 122
IE (exp) WLLS 0.0442 −0.9521 −0.549 ± 0.053 2.731 ± 0.048 126
IE (RQC) WLLS 0.0444 −0.9517 −0.550 ± 0.053 2.730 ± 0.048 125
asr: standard deviation;r: Pearson’s correlation coefficient;aandb: regression coefficients;F: F-test statistic.
Nanoscale Comment
This journal is © The Royal Society of Chemistry 2018 Nanoscale, 2018,10, 20863–20866 | 20865
Open Access Article. Published on 16 October 2018. Downloaded on 3/25/2019 5:51:52 AM. This article is licensed under a Creative Commons Attribution 3.0 Unported Licence.
View Article Online
9 M. Douglas and N. M. Kroll,Ann. Phys., 1974,82, 89–155.
10 B. A. Hess,Phys. Rev. A, 1986,33, 3742–3748.
11 D. Andrae, U. Häußermann, M. Dolg, H. Stoll and H. Preuß,Theor. Chim. Acta, 1990,77, 123–141.
12 B. Metz, H. Stoll and M. Dolg, J. Chem. Phys., 2000, 113, 2563–2569.
13 Mrcc, a quantum chemical program suite written by M. Kállay, Z. Rolik, J. Csontos, P. Nagy, G. Samu, D. Mester, J. Csóka, B. Szabó, I. Ladjánszki, L. Szegedy, B. Ladóczki, K. Petrov, M. Farkas, P. D. Mezei, and B. Hégely. See also.
Z. Rolik, L. Szegedy, I. Ladjánszki, B. Ladóczki and
M. Kállay, J. Chem. Phys., 2013, 139, 094105, as well as:
http://www.mrcc.hu.
14 F. Neese,Wiley Interdiscip. Rev.: Comput. Mol. Sci., 2012,2, 73–78.
15 J. J. P. Stewart, MOPAC2016, Stewart Computational Chemistry, Colorado Springs, CO, USA, 2016. http://
OpenMOPAC.net.
16 R. H. Mayers, Classical and Modern Regression with Applications, Higher Education Press, Beijing, 2nd edn., 2005.
17 S. Kar, A. Gajewicz, K. Roy, J. Leszczynski and T. Puzyn, Ecotoxicol. Environ. Saf., 2016,126, 238–244.
Comment Nanoscale
20866|Nanoscale, 2018,10, 20863–20866 This journal is © The Royal Society of Chemistry 2018 Open Access Article. Published on 16 October 2018. Downloaded on 3/25/2019 5:51:52 AM. This article is licensed under a Creative Commons Attribution 3.0 Unported Licence.
View Article Online