SOCIALLY RESPONSIBLE CONSUMPTION IN HUNGARY
Ildikó Kovács
Abstract
The significance of socially responsible consumption as well as the question of the knowledge and information that consumers may have about producers of consumer product are increasingly appearing in the literature. In the case of companies, responsible corporate operation and to examine how information could be transferred to consumers from companies have become key issues especially in the last decade.
Socially responsible consumption, which is the incorporation of social and environmental concerns by individuals in their consumption choices, is growing. The aim of this research is to verify the existence of different profiles of socially conscious consumers and to study their social representation of consumption.
Keywords: sustainable consumption, conscious consumption, Corporate Social Responsibility, consumer segments.
Introduction
Promoting corporate social responsibility (CSR) and sustainable consumption are parts of the European Sustainable Development Strategy. There are several programmes aiming at shaping the attitude of consumers for promoting sustainable consumption. Targets of these programmes can be facilitating conscious product choice and frugal consumption. Corporate social responsibility and conscious product choice can have a common effect towards sustainable consumption.
In our research, we have concentrated on two aspects: first the attitudes that Hungarian consumers have for the activities of socially conscious companies, and second we have examined if there are separate consumer segments that are receptive to certain areas of CSR.
Corporate social responsibility and consumption
The main idea of the corporate social responsibility (CSR) concept is that there are other roles of the companies in the society beyond manufacturing products, providing services and making profit. These roles include society and environmentally driven actions and commercial activities that increase the well-being of the community (Robins, 2005).
However, the companies have to achieve these goals at the same time, one related to profit making and the other to social interests.
According to Rondinelli and Berry (2000), CSR has four levels:
“(1) Commercial self-interest: Adhering to all laws and regulations and selecting those activities that benefit stakeholders and communities directly contributes to profitability and competitiveness.
(2) Expanded self-interest with immediate benefits: Undertaking activities that go beyond normal business concerns to benefit stakeholders and communities in ways that also provide measurable short- and medium-term benefits to the company.
(3) Expanded self-interest with long-term benefits: Supporting community activities, such as education and training that will have important impacts on continuing business success.
(4) Promoting the common good: Supporting or participating in activities that improve conditions in the community, or for stakeholders with no expectation of direct tangible benefits to the company.”
The proliferation of corporate social responsibility leads to a cohesive society and a sustainable economic system. Therefore, the European Commission has created a new definition of CSR as “the responsibility of enterprises for their impacts on society” (EU, 2011).
The EU also recognized the importance of consumer decisions: „Consumer attention to CSR- related issues has grown in recent years, but significant barriers remain, such as insufficient awareness, the need sometimes to pay a price premium, and lack of easy access to the information necessary for making informed choices. Some enterprises play a pioneering role in helping consumers to make more sustainable choices. The revision of the Sustainable Consumption and Production Action Plan may provide an opportunity to identify new measures to facilitate more responsible consumption.”(EU, 2011)
In the last decade, due to regulations and market expectations – beside financial performance reports – statements on CSR have appeared in which the companies report on their social and environmental performance. Several researchers agree that CSR investments and attitudes will eventually help the company to perform better economic performance. (Metaxas – Metaxas, 2010; Granek – Hassanali, 2005; Hall, 2000; Rondinelli – Berry, 2000).
Several researches argue that the most important stakeholders of the European companies are the employees and so they are the main target group of the CSR activities. Therefore, the CSR activities towards the consumers are of secondary importance and those aiming at the consumers are regarded to be rather PR activities. (Dawkins – Lewis, 2003)
Doane (2005) argues that CSR is not efficient because the companies imitate the CSR activities of other companies instead of finding there own pattern of CSR. Voluntary reporting of the companies would lead to the recognition of socially conscious companies and it would change the consumption pattern of them. So, the consumers drive the change of businesses to perform in a more sustainable manner. Doene is sceptic in this sense because of the imitation of other companies that makes CSR inefficient.
Socially responsible consumer
Definitions in the literature are not consistent in the content of social responsibility. Some sources argue that only environmentally conscious purchase and social responsibility are related to the concept of social responsible consumption while others say that reducing the volume of consumption should also be part of the responsible consumer behaviour.
The definition of socially responsible consumer and the importance of research in this area came up first in the seventies when Anderson and Cunningham separated the consumers with high social consciousness according to demographic and social-psychological characteristics in 1972. They express that the socially conscious consumers are consumers who consider not only their own satisfaction but they also take into account the social welfare when making purchase decisions.
Roberts (1996) defined the socially responsible consumer as “one who purchases products and services perceived to have a positive (or less negative) influence on the environment or who
patronizes businesses that attempt to effect related positive social change”. This definition assumes two dimensions: environmental concern and a more general social concern.
Although consumption in general is in itself harmful to the environment, even those who are committed to sustainable consumption recognize that reduction of consumption or additional costs in order to lower the environmental pressure are not likely. (Láng, 2003)
Sustainable consumption is interpreted to mean consuming less and a kind of alternative or conscious consumption (Jackson, 2004). The authors express that welfare does not depend on the volume of consumption. The expenditure of consumers has more than doubled in the UK in the last thirty years, but life-satisfaction does not show a significant change (Donovan et al., 2003). Various previous researches argue that more and more consumers consider “green”
and socially conscious consumption important (Vágási, 2000; Pakainé Kováts – Herczeg, 1999; Borsi, 1997).
Mohr et al. (2001) defined socially responsible consumer behaviour based on the concept of CSR. An approach to define CSR involves an attempt to list the major responsibilities of companies.According to Pepper et al., the pillars of sustainable consumption are as follows:
pro environmental, pro social, and frugal (2009). Other researchers (McDonald et al., 2006) also argue the decrease of consumption and the „frugal lifestyle” (Lastoviczka et al., 1999).
Webb et al. (2008) distinguish between three possible dimensions of socially responsible consumption: (1) purchases based on the corporate social responsibility activities of the companies, (2) recycling, (3) avoiding and reducing products harmful to the environment.
Based on these dimensions, the Socially Responsible Purchase and Disposal (SRPD) scale has been developed. This scale measures four dimensions of responsible purchase: 1) influence of the companies’ CSR performance on the purchases, 2) recycling activity of the consumers, 3) beside the traditional procurement criteria (price, availability, quality), other concerns related to responsibility emerge (e.g. environmental issues), 4) purchase criteria based on the environmental effects of the products.
Several researches argue that there is a gap between the attitude and behaviour and also between the values and actions (Young et al., 2010; Spaargaren – Koppen, 2011; Öbereder et al., 2011). Young et al. claim that the ‘attitude–behaviour gap’ or ‘values–action gap’ is present at 30% of consumers who are concerned about environmental issues very much but
they do not realize this in their purchases. Companies should have an active role in turning consumers socially conscious. For more sustainable consumption patterns, consumers need new ideas and information. The producers and retailers of products have a responsibility in providing the consumers with information and orientation on the possibilities of green consumption. (Hume, 2010)
According to analyses of consumer attitude, there is positive motivation and willingness towards socially responsible companies but the actual consumption is lagging behind. Several researches, that include analyses of both attitude and consumption, have reached the same conclusion. (Devinney et al., 2006; Eckhardt et al., 2010). CSR still has a minor affect on consumption decisions (Mohr et al., 2001).
Previous researches on the effect of CSR on purchasing decisions
There are not too many researches in the literature on the effect of CSR on consumer decisions. Several researches reveal that consumers attach more and more importance to the consumption of responsible products and monitoring of CSR activities of the firms. (Carrigan – Attalla, 2001; Maignan, 2001). Increased attention on CSR has a considerable effect on purchases (Brown – Dacin, 1997; Sen – Bhattacharya, 2001; Mohr – Webb, 2005).
There is a considerable difference between the supply and demand sides of the market. On the supply side, firms are more and more engage themselves in CSR activities while on the demand side, consumers pay more attention to irresponsible corporate behaviour (Snider et al., 2003). Irresponsible corporate actions have a greater impact on consumers’ purchases than responsible behaviour (Biehal – Sheinin, 2007; Brown – Dacin, 1997; Marin – Ruiz, 2007;
Bhattacharya – Sen, 2004).
Survey methodology
The aim of the survey was to analyse the attitude of Hungarian consumers to CSR. The survey was carried out in Hungary on a sample of 510 respondents. The responses were weighted according to regions, types of settlements, age, sex and level of education and therefore are representative for these variables. 11 variables of the research model contained Likert scale questions on consumer opinions about the socially responsible activities of the companies.
Based on the survey, latent variables could be created about the description of themes of responsible consumption. The awareness of social responsibility was surveyed by nominal scale while the importance of its areas by ordinal scale. The survey contained the following personal characteristics: sex, age, age group, level of education and residence.
The age of respondents was between 18 and 69 years. The distribution of respondents according to age groups was as follows: 18-29 years (26.1%), 30-39 years (20.4%), 40-49 years (21.0%), over 50 years (32.5%). Bearing in mind the topic of the survey, a core aspect of the selection of respondents was that they should take part in the decisions related to purchase of goods and services. 46.9% of the respondents were men and 53.1% of them are women. Primary school was the highest level of education for 10.2%, vocational training school for 24.7%, secondary school for 40.2% and higher education for 24.3% of the respondents. The place of residence is Budapest for 12.6%, county towns for 17.6%, other towns for 28.3% and villages for 41.4%.
Consumer segments created according to the variables of CSR and their characteristics
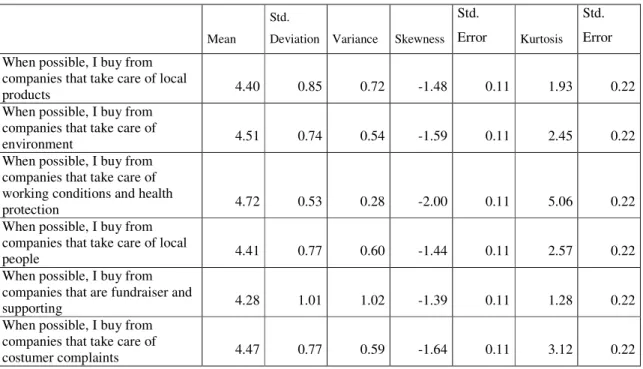
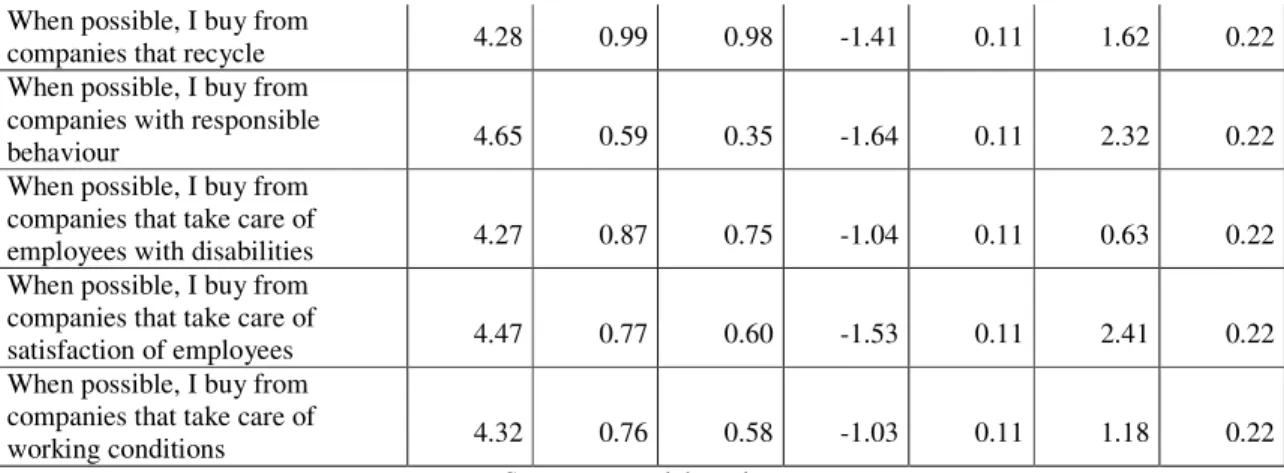
According to the responses for the questions related to social responsibility of companies, the respondents have a positive attitude towards the responsible activities of companies (Table 1).
Table 1 Characteristics of the variables
Mean
Std.
Deviation Variance Skewness Std.
Error Kurtosis Std.
Error When possible, I buy from
companies that take care of local
products 4.40 0.85 0.72 -1.48 0.11 1.93 0.22
When possible, I buy from companies that take care of
environment 4.51 0.74 0.54 -1.59 0.11 2.45 0.22
When possible, I buy from companies that take care of working conditions and health
protection 4.72 0.53 0.28 -2.00 0.11 5.06 0.22
When possible, I buy from companies that take care of local
people 4.41 0.77 0.60 -1.44 0.11 2.57 0.22
When possible, I buy from companies that are fundraiser and
supporting 4.28 1.01 1.02 -1.39 0.11 1.28 0.22
When possible, I buy from companies that take care of
costumer complaints 4.47 0.77 0.59 -1.64 0.11 3.12 0.22
When possible, I buy from
companies that recycle 4.28 0.99 0.98 -1.41 0.11 1.62 0.22
When possible, I buy from companies with responsible
behaviour 4.65 0.59 0.35 -1.64 0.11 2.32 0.22
When possible, I buy from companies that take care of
employees with disabilities 4.27 0.87 0.75 -1.04 0.11 0.63 0.22 When possible, I buy from
companies that take care of
satisfaction of employees 4.47 0.77 0.60 -1.53 0.11 2.41 0.22
When possible, I buy from companies that take care of
working conditions 4.32 0.76 0.58 -1.03 0.11 1.18 0.22
Source: own elaboration
The analysis of social responsibility of the companies was carried out by factors of variables.
According to Cronbach’s alfa and Kolmogorov–Smirnov tests (these tests show the reliability of the scale), the variables were suitable for the conditions of factor analysis. The KMO test showed that the data were suitable for factor analysis (KMO=0.755). According to the Bartlett test, the correlation matrix was significantly different from zero (Sig=0.000). The communality of variables contributes to the explanation of factors at a strong or medium level. The total variance explained by the factors is 74.59%, which is acceptable.
Table 2 Factor structure matrix
Social Environmental Employees Costumers
Variance explained 37.8% 15.0% 11.6% 10.2%
When possible, I buy from companies that
take care of employees with disabilities 0.823 0.166 0.339 0.021
When possible, I buy from companies that
are fundraiser and supporting 0.816 0.317 0.262 0.307
When possible, I buy from companies that
take care of local people 0.672 0.236 0.293 0.467
When possible, I buy from companies that
take care of local products 0.185 0.904 0.312 0.257
When possible, I buy from companies that
take care of environment 0.397 0.860 0.274 0.312
When possible, I buy from companies that
take care of satisfaction of employees 0.210 0.367 0.876 0.172
When possible, I buy from companies that
take care of working conditions 0.536 0.147 0.785 0.221
When possible, I buy from companies that 0.242 0.291 0.197 0.955
take care of costumer complaints
Extraction Method: Principal Component Analysis. Rotation Method: Promax with Kaiser Normalization.
Source: own elaboration
Table 2 shows the factor structure. The Social factor has high coefficients in case of companies that take care of employees with disabilities and that are fundraiser and supporting.
At the Environmental factor, both variables are important: the companies that take care of environment and of local products. The factor of Employees has high coefficients for the companies that take care of both employees’ satisfaction and working conditions. The coefficient of the companies that take care of costumer complaints is important for the Costumer factor. Table 3 presents the correlation matrix between the factors.
Table 3 Component Correlation Matrix
Component Social Environmental Employees Costumers
Social 1.000 0.268 0.381 0.286
Environmental 0.268 1.000 0.297 0.306
Employees 0.381 0.297 1.000 0.204
Costumers 0.286 0.306 0.204 1.000
Extraction Method: Principal Component Analysis. Rotation Method: Promax with Kaiser Normalization.
Source: own elaboration
Distinction between the CSR consumer groups by cluster analysis
In our research, we have tried to analyse whether the respondents can be grouped according to their characteristics. For this purpose, the data from factor analysis was used. The cluster analysis was carried out with K-means clustering. As a result, 4 clusters were separated, which are described below.
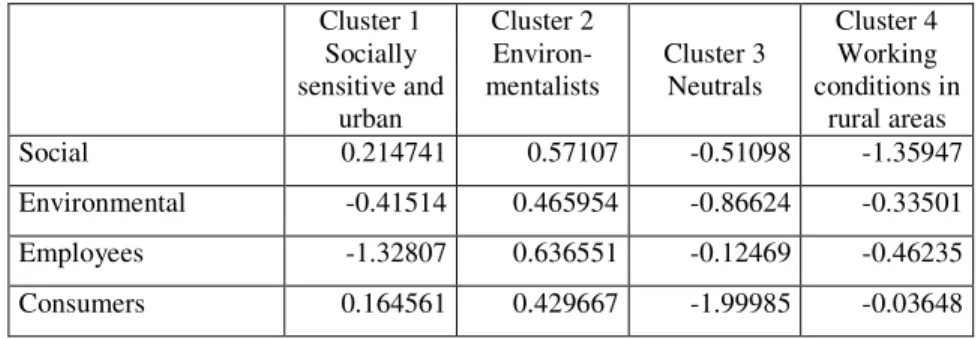
Cluster centres and the analysis of variance are presented in tables 4 and 5 and in figure 1.
Description of the segments by their demographic characteristics is summarised in tables 6-9.
Cluster 1 – Socially sensitive and urban Ratio in the sample: 16.7%.
This group mainly relates the social responsibility of the companies with the importance of social aspects. They consider taking care of the working conditions very important. They also consider the two other characteristics, fundraising and supporting the local people very much likeable. The group evaluates environment protection neutral while the satisfaction of employees gets lower scores and the costumer relations higher scores than the average.
Most of the respondents in the group live in Budapest and in large cities; their age is typically over 40 and they have higher education.
Cluster 2 – Environmentalists Ratio in the sample: 51.5%.
The group considers the manufacturing of environment friendly products (99.3%) and the use of local products (95.3%) essential. 87.1% of the respondents think that it is important to reuse materials. Social concerns are also important and the responsible behaviour with employees and costumers is regarded to be valuable compared to other groups.
The respondents in the group mainly live in Budapest and in other major cities; 59.2% of them are women and the majority has secondary or higher education.
Cluster 3 – Neutrals Ratio in the sample: 12.1%.
Social responsibility of the companies is considered to be less important in this cluster. The only environmental characteristic that is regarded to be important is the reuse and recycling of materials. Handling of customer complaints is of less or neutral importance for 81% of the respondents in this group.
The respondents in this group are close to the average sample population in terms of age structure. Respondents with secondary education and those living in small towns are overrepresented while there is an equal number of men and women in the cluster.
Cluster 4 – Working conditions in rural areas Ratio in the sample: 19.7%.
Social concerns are of less importance in this group. Within social concerns, supporting the local people is regarded to be less important. Fundraising and supporting is considered to be neutral or less important for 57.4% which is under the ratio of other clusters. Satisfaction of employees receives the main attention in this cluster.
The typical respondent in this cluster is a man under 40 years with primary or secondary education and lives in a small town.
Table 4 Final cluster centres Cluster 1
Socially sensitive and
urban
Cluster 2 Environ-
mentalists Cluster 3 Neutrals
Cluster 4 Working conditions in
rural areas
Social 0.214741 0.57107 -0.51098 -1.35947
Environmental -0.41514 0.465954 -0.86624 -0.33501
Employees -1.32807 0.636551 -0.12469 -0.46235
Consumers 0.164561 0.429667 -1.99985 -0.03648
Source: own elaboration
Figure 1 Final cluster centres
-2,5 -2 -1,5 -1 -0,5 0 0,5 1
1 2 3 4
Social Environmental Employees Consumers Source: own elaboration
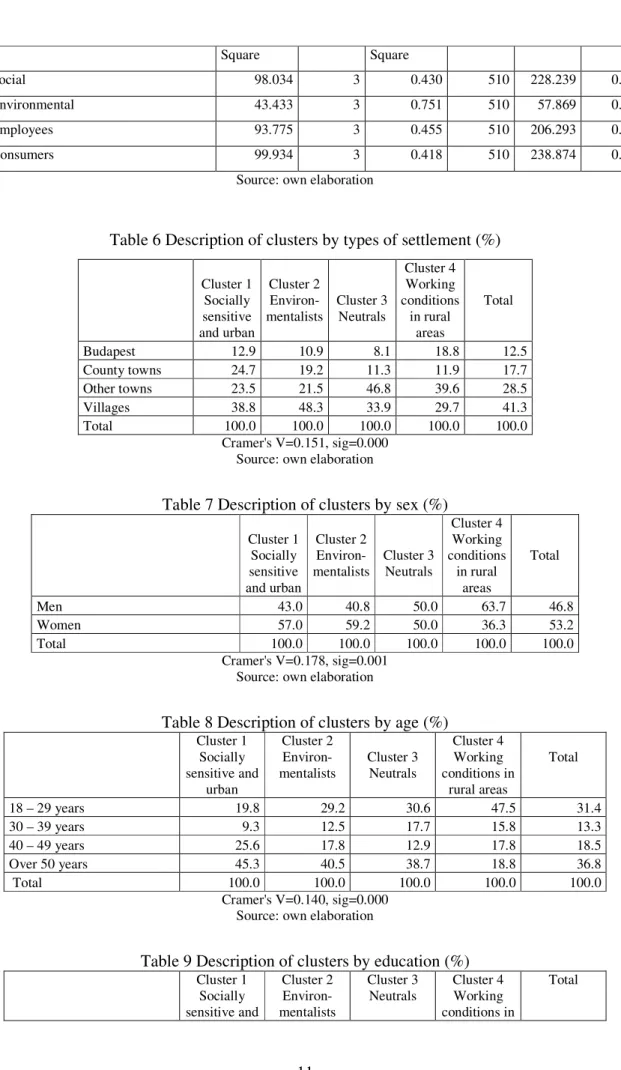
Table 5 Analysis of variance
Cluster Error F Sig.
Mean Df Mean df
Square Square
Social 98.034 3 0.430 510 228.239 0.000
Environmental 43.433 3 0.751 510 57.869 0.000
Employees 93.775 3 0.455 510 206.293 0.000
Consumers 99.934 3 0.418 510 238.874 0.000
Source: own elaboration
Table 6 Description of clusters by types of settlement (%)
Cluster 1 Socially sensitive and urban
Cluster 2 Environ- mentalists
Cluster 3 Neutrals
Cluster 4 Working conditions
in rural areas
Total
Budapest 12.9 10.9 8.1 18.8 12.5
County towns 24.7 19.2 11.3 11.9 17.7
Other towns 23.5 21.5 46.8 39.6 28.5
Villages 38.8 48.3 33.9 29.7 41.3
Total 100.0 100.0 100.0 100.0 100.0
Cramer's V=0.151, sig=0.000 Source: own elaboration
Table 7 Description of clusters by sex (%)
Cluster 1 Socially sensitive and urban
Cluster 2 Environ-
mentalists Cluster 3 Neutrals
Cluster 4 Working conditions
in rural areas
Total
Men 43.0 40.8 50.0 63.7 46.8
Women 57.0 59.2 50.0 36.3 53.2
Total 100.0 100.0 100.0 100.0 100.0
Cramer's V=0.178, sig=0.001 Source: own elaboration
Table 8 Description of clusters by age (%)
Cluster 1 Socially sensitive and
urban
Cluster 2 Environ-
mentalists Cluster 3 Neutrals
Cluster 4 Working conditions in
rural areas
Total
18 – 29 years 19.8 29.2 30.6 47.5 31.4
30 – 39 years 9.3 12.5 17.7 15.8 13.3
40 – 49 years 25.6 17.8 12.9 17.8 18.5
Over 50 years 45.3 40.5 38.7 18.8 36.8
Total 100.0 100.0 100.0 100.0 100.0
Cramer's V=0.140, sig=0.000 Source: own elaboration
Table 9 Description of clusters by education (%)
Cluster 1 Socially sensitive and
Cluster 2 Environ- mentalists
Cluster 3 Neutrals
Cluster 4 Working conditions in
Total
urban rural areas
Primary school 50.0 44.7 27.5 40.0 42.5
Vocational training school 20.9 17.8 33.9 14.0 19.5
Secondary school 20.9 24.6 32.2 33.0 26.5
Higher education 8.1 12.9 6.4 13.0 11.3
Total 100.0 100.0 100.0 100.0 100.0
Cramer's V=0.133, sig=0.008 Source: own elaboration
Validation of the segments by discriminant analysis
In order to validate the segments created by cluster analysis, a canonical discriminant analysis has been carried out. The aim of the analysis was to control if the respondents fall in the same groups. The significance levels of the functions are presented in table 10.
Table 10 Wilks’ Lambda, Chi Square, degree of freedom and significance levels of the discriminant functions
Wilks'
Lambda F Df1 Df2 Sig.
Social 0.427 228.239 3 510 0.000
Environmental 0.746 57.869 3 510 0.000
Employees 0.452 206.293 3 510 0.000
Customers 0.416 238.874 3 510 0.000
Source: own elaboration
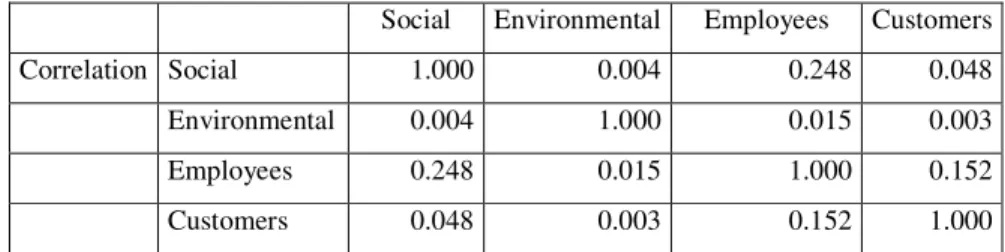
The results of the discriminant analysis are summarised in tables 11, 12 and 13.
Table 11 Pearson correlation coefficient matrix
Social Environmental Employees Customers
Correlation Social 1.000 0.004 0.248 0.048
Environmental 0.004 1.000 0.015 0.003
Employees 0.248 0.015 1.000 0.152
Customers 0.048 0.003 0.152 1.000
Source: own elaboration
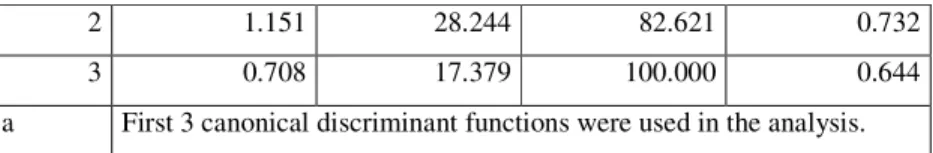
Table 12 Eigenvalues, variances and canonical correlation values of the three discriminant functions
Function Eigenvalue % of Variance Cumulative % Canonical Correlation
1 2.217 54.376 54.376 0.830
2 1.151 28.244 82.621 0.732
3 0.708 17.379 100.000 0.644
a First 3 canonical discriminant functions were used in the analysis.
Source: own elaboration
Table 13 Wilk’s Lambda, Chi-square, degree of freedom and Significance values of the discriminant functions
Test of
Function(s) Wilks'
Lambda Chi-square Df Sig.
1 through 3 0.085 1257.920 12 0.000
2 through 3 0.272 662.918 6 0.000
3 0.585 272.762 2 0.000
Source: own elaboration
The results of the classification were validated by discriminant analysis, which showed that the regrouping only resulted minor differences compared to those of the cluster analysis. The two classifications resulted the same group for 95.4% of the respondents. The classification according to the cluster analysis was justified; because the two methods gave almost the same results (table 14).
Table 14 Classification results according to cluster and discriminant analysis
Cluster 1 Socially sensitive and
urban
Cluster 2 Environ- mentalists
Cluster 3 Neutrals
Cluster 4 Working conditions in
rural areas
Total
Original
Count
1 84 0 0 2 86
2 9 250 4 3 265
3 2 1 59 1 62
4 1 0 1 100 101
%
1 97 0 0 3 100
2 3 94 1 1 100
3 2 1 95 1 100
4 1 0 1 98 100
Cross-validated
Count
1 84 0 0 2 86
2 9 249 4 4 265
3 2 2 58 1 62
4 1 0 1 100 101
%
1 97 0 0 3 100
2 3 94 1 1 100
3 2 2 94 1 100
4 1 0 1 98 100
Source: own elaboration
Conclusions
In this research the attitudes related to the CSR activities of the firms was analysed on a representative sample of respondents in Hungary. The value structure of consumers is presented by factor analysis. The four factors are the social, environmental, employees and costumers factors. The consumers were segmented according to these factors and their demographic characteristics. The segmentation was carried out by cluster analysis and the success of the classification was validated by a discriminant analysis.
In our research it is proved that it is possible to separate and describe those consumers who are receptive to certain areas of the CSR activities of companies. Four segments are discriminated: socially sensitive, environmentalists, neutrals and those who find the working conditions the most important. There is generally a positive attitude of the consumers to the socially responsible companies.
Decision makers in the business sphere more and more take into account the attitudes of consumers related to corporate social responsibility of the firms. It is a competitive advantage if a firm can identify consumers likely to respond to socially responsible corporate behaviour.
Research was supported/subsidized by the TÁMOP 4.2.2/B-10/1-2010-011 „Development of a complex educational assistance/support system for talented students and prospective researchers at the Szent István University” project.
s
References
Anderson, W. T. JR. – Cunningham, W. H. (1972): The Socially Conscious Consumer, Journal of Marketing, 36, (3) p. 23-31.
Bhattacharya, C. B. – Sen, S. (2004): Doing Better at Doing Good: When, Why and How Consumers Respond to Corporate Social Initiatives, California Management Review, 47 (Fall) p. 9-25.
Biehal, G. J. – Sheinin, D. A. (2007): The Influence of Corporate Messages on the Product Portfolio, Journal of Marketing, Vol. 71, No. 2, p. 12-25.
Borsi, K. (1997): Zöld stratégiák – Green strategies, Hungarian Journal of Marketing &
Menedzsment, 31, p. 66-68.
Brown, T. J. – Dacin, P. A. (1997): The Company and the Product: Corporate Associations and Consumer Product Responses, Journal of Marketing, 61 (January), p. 68-84.
Carrigan, M. – Attalla, A. (2001): The myth of the ethical consumer – do ethics matter in purchase behaviour?, Journal of Consumer Marketing, 18 (7), p. 560-577.
Dawkins, J – Lewis, S. (2003): CSR in stakeholder expectations: And their implication for company strategy, Journal of Business Ethics; May 2003; 44, 2/3; ABI/INFORM Global, p.
185-193.
Devinney, T. M. – Auger, P. – Eckhardt, G. M. – Birtchnell, T. (2006): The Other CSR:
Consumer Social Responsibility, Stanford Social Innovation Review, 70, (3), p. 299-326.
Doane, D. (2005): Beyond corporate social responsibility: minnows, mammoths and markets, Futures, 37, p. 215-229.
Donovan, N. – Halpern, D. – Sergeant, R. (2003): Life Satisfaction: The State of Knowledge and Implications for Government, Discussion Paper, Strategy Unit, Government UK psychology', Russell Sage Foundation, New York, p. 3-25.
Eckhardt, G. M. – Belk, R. – Devinney, T. M. (2010): Why don't consumers consume ethically?, Journal of Consumer Behaviour, 9, (6), p. 426-436.
EU (2011): Communication from the Commission to the European Parliament, the Council, the European Economic and Social Committee and the Committee of the Regions – A Renewed EU Strategy 2011-14 for Corporate Social Responsibility, COM(2011) 681 final, Brussels, 25.10.2011
Granek, F. – Hassanali, M. (2005): The Toronto Region Sustainability Program: insights on the adoption of pollution prevention practices by small to medium-sized manufacturers in the Greater Toronto Area (GTA), Journal of Cleaner Production, 14, p. 572-579.
Hall, J. (2000): Environmental supply chain dynamics, Journal of Cleaner Production, 8, p.
455–471.
Hume, M. (2010): Compassion without action: Examining the young consumers consumption and attitude to sustainable consumption, Journal of World Business, 45, (4), October 2010, p.
385-394.
Jackson, T. (2005): Motivating Sustainable Consumption: A review of evidence on consumer behaviour and behavioural change, a report to the Sustainable Development Research Network, January 2005
Láng, I. (2003): A fenntartható fejlődés Johannesburg után – Sustainable development after Johannesburg, Agrinform Kiadóház, p. 147.
Maignan, I. (2001): Consumers' Perceptions of Corporate Social Responsibilities: A Cross- Cultural Comparison, Journal of Business Ethics, 30 (1), p. 57-72.
Lastovicka, J. – Bettencourt, L. – Hughner, R. – Kuntze, R. (1999): "Lifestyle of the tight and frugal", The Journal of Consumer Research, 26, (1), p. 85-98.
Marin, L. – Ruiz, S. (2007): “I Need You Too!” Corporate Identity Attractiveness for Consumers and the Role of Social Responsibility, Journal of Business Ethics, 71 p. 245-260.
McDonald, S. – Oates, C. J. – Young, C. W. – Hwang, K. (2006): Toward Sustainable Consumption: Researching Voluntary Simplifiers, Psychology and Marketing, 23, (6), p. 515- 534.
Metaxas, T. – Metaxas, M. (2010): Corporate Social Responsibility in Europe: Denmark, Hungary and Greece, Journal of Contemporary European Studies, 18 (1), p. 25-46.
Mohr, L. A. – Webb, D. J. (2005): The Effects of Corporate Social Responsibility and Price on Consumer Responses, Journal of Consumer Affairs, 39 (1), p.121-147.
Mohr, L. A. – Webb, D. J. – Harris, K. E. (2001): Do Consumers Expect Companies to be Socially Responsible? The Impact of Corporate Social Resposibility on Buying Behaviour, The Journal of Consumer Affairs, 35, (1), p. 45-72.
Öbereder, M. – Schlegelmilch, B. B. – Gruber, V. (2011): Why Don’t Consumers Care About CSR?: A Qualitative Study Exploring the Role of CSR in Consumption Decisions, Empirical Paper, Journal of Business Ethics, 104 (4), p. 449-460.
Pakainé Kováts, J. – Herczeg, J. (1999): Ökotudatos üzleti magatartás – Ecoconscious business behaviour. In: Gidai, E.,Nováky, E., Tóth, A. (Eds.), Magyarország az ezredforduló után. MTA Jövőkutatási Bizottság, Budapest.
Pepper, M. – Jackson, T. – Uzzell, D. (2009): An examination of the values that motivate socially conscious and frugal consumer behaviours, International Journal of Consumer Studies, 33, p. 126-136.
Roberts, J. A. (1996): Will the Real Socially Consumer Please Step Forward?, Business Horizons, 39, (1), p. 79-83.
Robins, F. (2005): The Future of Corporate Social Responsibility, Asian Business &
Management, 4, p. 95-115.
Rondinelli, D. A. – Berry, M. A. (2000): Environmental citizenship in multinational corporations: social responsibility and sustainable development – the two approaches of sustainability applied on micro level, European Management Journal, 18, p. 70-84.
Sen, S. – Bhattacharya, C. B. (2001): Does Doing Good Always Lead to Doing Better?
Consumer Reactions to Corporate Social Responsibility, Journal of Marketing Research, 38 (2), p. 225-243.
Snider, J. – Paul, R. H. – Martin, D. (2003): Corporate Social Responsibility in the 21st Century: A View from the World's Most Successful Firms, Journal of Business Ethics, 48 (2), p.175-187.
Spaargaren, G. – Kris van Koppen, C. S. A. (2011): Provider Strategies and the Greening of Consumption Practices: Exploring the Role of Companies in Sustainable Consumption, In:
The new Middle Classes, Springer Netherlands, p.81-100., 306 p.
Vágási, M. (2000): A fenntartható fogyasztás és a környezettudatos fogyasztói magatartás – Sustainable consumption and environmentally conscious consumer behaviour, Hungarian Journal of Marketing and Management, 34, p. 39–44.
Webb, D. J. – Mohr, L. A. – Harris, K. E. (2008): A Re-examination of Socially Responsible Consumption and its Measurement, Journal of Business Research, 61, (2), p. 91-98.
Young, W. – Hwang, K. – McDonald, S. – Oates, C. J. (2010): Sustainable consumption:
green consumer behaviour when purchasing products, Sustainable Development, 18, (1), p.
20-31.