*For correspondence:
gtamas@bio.u-szeged.hu Competing interests:The authors declare that no competing interests exist.
Funding:See page 20 Received:10 December 2020 Preprinted:11 December 2020 Accepted:14 July 2021 Published:26 July 2021 Reviewing editor: Marco Capogna, University of Aarhus, Denmark
Copyright Ozsva´r et al. This article is distributed under the terms of theCreative Commons Attribution License,which permits unrestricted use and redistribution provided that the original author and source are credited.
Predominantly linear summation of metabotropic postsynaptic potentials follows coactivation of neurogliaform interneurons
Attila Ozsva´r, Gergely Komlo´si, Ga´spa´r Ola´h, Judith Baka, Ga´bor Molna´r, Ga´bor Tama´s*
MTA-SZTE Research Group for Cortical Microcircuits of the Hungarian Academy of Sciences,, Department of Physiology, Anatomy and Neuroscience, University of Szeged, Szeged, Hungary
Abstract
Summation of ionotropic receptor-mediated responses is critical in neuronal computation by shaping input-output characteristics of neurons. However, arithmetics ofsummation for metabotropic signals are not known. We characterized the combined ionotropic and metabotropic output of neocortical neurogliaform cells (NGFCs) using electrophysiological and anatomical methods in the rat cerebral cortex. These experiments revealed that GABA receptors are activated outside release sites and confirmed coactivation of putative NGFCs in superficial cortical layers in vivo. Triple recordings from presynaptic NGFCs converging to a postsynaptic neuron revealed sublinear summation of ionotropic GABAAresponses and linear summation of metabotropic GABABresponses. Based on a model combining properties of volume transmission and distributions of all NGFC axon terminals, we predict that in 83% of cases one or two NGFCs can provide input to a point in the neuropil. We suggest that interactions of metabotropic
GABAergic responses remain linear even if most superficial layer interneurons specialized to recruit GABABreceptors are simultaneously active.
Introduction
Each neuron in the cerebral cortex receives thousands of excitatory synaptic inputs that drive action potential (AP) output. The efficacy and timing of excitation is effectively governed by GABAergic inhibitory inputs that arrive with spatiotemporal precision onto different subcellular domains. Syn- chronization of GABAergic inputs appears to be crucial in structuring cellular and network excitation and behaviorally relevant rhythmic population activity (Klausberger and Somogyi, 2008). Diverse subpopulations of GABAergic neurons contribute to network mechanisms at different temporal win- dows and synchronized cells of particular interneuron types appear to fire in a stereotyped fashion (Klausberger and Somogyi, 2008). In general, this frequently results in coactivation of similar (and asynchronization of dissimilar) GABAergic inputs arriving to target neurons (Jang et al., 2020;
Karnani et al., 2016;Kvitsiani et al., 2013), which leads to postsynaptic summation of GABAergic responses synchronously activated by presynaptic cells of the same type. Most GABAergic cell types exert inhibitory control through ionotropic GABAA receptors allowing Cl ions to pass rapidly through the membrane (Barker and Ransom, 1978) and depending on the magnitude of GABA release and/or the number of synchronously active presynaptic interneurons, synaptic and extrasy- naptic GABAAreceptors could be recruited. The integration of ionotropic inhibitory signals on the surface of target cell dendrites is temporally precise and spatially specific (Bloss et al., 2016;Klaus- berger, 2009; Mu¨ller et al., 2012). Summation of ionotropic receptor-mediated responses are
RESEARCH ARTICLE
extensively studied in the neocortex and predominantly characterized by nonlinear rules of interac- tion (Jadi et al., 2012;Koch et al., 1983;London and Ha¨usser, 2005;Qian and Sejnowski, 1990;
Silver, 2010). In addition to GABAA receptors, metabotropic GABABreceptor activation can occur during synchronized and/or long-lasting activation of GABAergic inputs (Dutar and Nicoll, 1988;
Isaacson et al., 1993;Mody et al., 1994;Scanziani, 2000;Thomson and Destexhe, 1999).
Among the various interneuron subtypes identified in the neocortex neurogliaform cells (NGFCs) form a large subset of interneuron population (Petilla Interneuron Nomenclature Group et al., 2008; Markram et al., 2004; Schuman et al., 2019). Compared to other interneuron subtypes, NGFCs form dense axonal arborization with an unusually high presynaptic bouton density that is highly interconnected with other neighboring neurons. NGFCs are known to be especially effective in recruiting metabotropic GABABreceptors in addition to ionotropic GABAAreceptors by sporadic firing using single cell triggered volume transmission in the microcircuit (Ola´h et al., 2009;
Tama´s et al., 2003).
GABA binding to GABABreceptors catalyzes GDP/GTP exchange at the Gasubunit and the sep- aration of Gbg (Bettler et al., 2004). The Gbg subunits – as membrane-anchored proteins – locally diffuse in the plasma membrane and up to four Gbgsubunits bind cooperatively to G-protein gated inward rectifier potassium (GIRK) channels and trigger a channel opening that drives the membrane potential toward the K+ reverse potential (Dascal, 1997; Inanobe and Kurachi, 2014;
Stanfield et al., 2002; Wang et al., 2016;Wickman and Clapham, 1995). Activation of GABAB
receptors by NGFCs controls the firing of dendritic spikes in the distal dendritic domain in pyramidal cells (PCs) (Larkum et al., 1999;Palmer et al., 2012a;Wozny and Williams, 2011) and activity in the prefrontal cortex is effectively controlled by the strong feed-forward GABABinhibition mediated by NGFCs (Jackson et al., 2018). Moreover, GABABreceptors contribute to termination of persis- tent cortical activity (Craig et al., 2013) and slow inhibition contributes to theta oscillations in the hippocampus (Capogna and Pearce, 2011).
Relative to the summation of ionotropic responses, postsynaptic summation properties of metab- otropic receptors are unexplored and to date, there has been no experimental analysis of how neu- rons integrate electric signals that are linked to inhibitory metabotropic receptors. We set out to test the summation of metabotropic receptor-mediated postsynaptic responses by direct measure- ments of convergent inputs arriving from simultaneously active NGFCs and to characterize the likeli- hood and arithmetics of metabotropic receptor interactions in a model of population output by incorporating experimentally determined functional and structural synaptic properties of NGFCs.
Results
Quantal and structural characteristics of GABAergic connections established by individual NGFCs
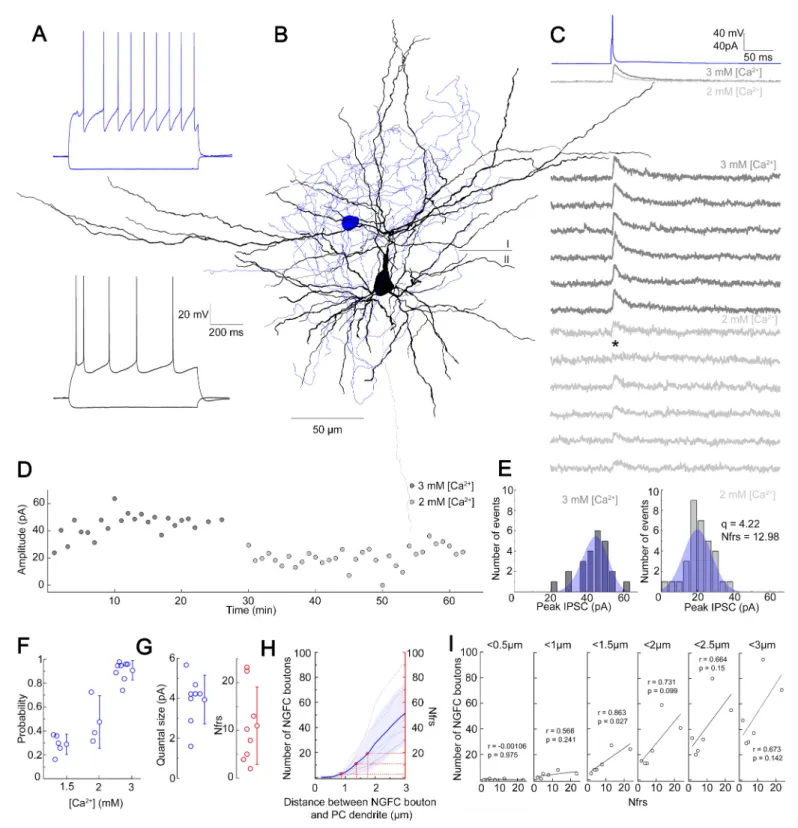
NGFCs are capable of activating postsynaptic receptors in the vicinity of their presynaptic boutons via volume transmission (Ola´h et al., 2009). To gain insight into the possible effective radius of vol- ume transmission, we characterized properties of NGFC-PC connections. In vitro simultaneous dual whole-cell patch clamp recordings were carried out on synaptically connected L1 NGFC to L2/3 PC pairs in brain slices from the somatosensory cortex of juvenile male Wistar rats. Pre- and postsynap- tic cells were chosen based on their characteristic passive membrane and firing properties (Figure 1A) and recorded neurons were filled with biocytin, allowing post hoc anatomical recon- struction of recorded cells and estimation of putative synaptic release sites (Figure 1B,H). Single APs triggered in NGFCs elicit biphasic GABAAand GABABreceptor-mediated responses on the tar- get neurons (Tama´s et al., 2003). To determine the number of functional release sites (Nfrs), we recorded induced pluripotent stem cells (IPSCs) under different release probability by varying extra- cellular Ca2+ and Mg2+ concentrations (Figure 1C,F). NGFC evoked inhibitory postsynaptic potentials (IPSPs) show robust use-dependent synaptic depression, therefore we limited the intervals of AP triggered in NGFCs to 1 min (Karayannis et al., 2010;Tama´s et al., 2003). We collected a dataset of n = 8 L1 NGFC to L2/3 PC pairs with an average of 65.5±5.26 trials per pair and 32.75± 4.16 trials for a given Mg2+/Ca2+ concentration per conditions. The limited number of trials due to the use-dependent synaptic depression of NGFCs restricted our approach to Bayesian quantal analy- sis (BQA) previously shown to be robust for the estimation of quantal parameters (Bhumbra and
Figure 1.Quantal and structural characteristics of GABAergic connections established by individual neurogliaform cells (NGFCs). (A–E) Quantal and structural properties of a neurogliaform to pyramidal cell (PC) connection. (A) Firing patterns of the presynaptic L1 NGFC (blue) and postsynaptic L2/3 PC (black). (B) Three-dimensional anatomical reconstruction of a recorded L1 NGFC (soma and axon blue) and L2/3 PC (soma and dendrites black, axon gray). Horizontal line indicates the border of layer 1 (I) and layer 2 (II). (C) Presynaptic action potentials of the L1 NGFC (top, blue) elicited of unitary induced pluripotent stem cells (IPSCs) in the postsynaptic L2/3 PC at 50 mV holding potential in different Ca2+concentrations (middle, dark gray: 3 mM Ca2+, 1.5 mM Mg2+, light gray: 2 mM Ca2+, 2 mM Mg2+). Bottom: Representative consecutive traces of elicited unitary IPSCs. Asterisk marks synaptic transmission failure. (D) Single IPSC peak amplitudes recorded in high (3 mM Ca2+, 1.5 mM Mg2+, dark gray) and low release probability conditions (2 mM Ca2+, 2 mM Mg2+, light gray), respectively. (E) Distribution of IPSC peak amplitudes in 3 mM Ca2+, 1.5 mM Mg2+(left) and 2 mM Figure 1 continued on next page
Research article Neuroscience
Beato, 2013). As expected, IPSC peak amplitudes were modulated by elevated (3 mM Ca2+and 1.5 mM Mg2+; mean amplitude: 32.7±22.17 pA; rise time: 6.47±1.34 ms; decay time: 12.27±2.42 ms) and reduced (1.5 mM Ca2+ and 3 mM Mg2+; mean amplitude: 13.58 ±6.95 pA; rise time: 7.64± 3.53 ms; decay time: 11.79±3.21 ms or 2 mM Ca2+and 2 mM Mg2+; mean amplitude: 12.47±10.9 pA; rise time: 6.95±1.52 ms; decay time: 15.5±10.54 ms) extracellular Ca2+concentrations consis- tent with the decline in release probability (Figure 1D). Distributions of IPSC amplitudes detected in paired recordings were in good agreement with the estimated quantal amplitude distribution derived from the BQA (Figure 1E). According to BQA, the estimated mean Nfrs was 10.96 ±8.1 with a mean quantal size (q) of 3.93±1.21 pA (Figure 1G). We performed n=4 experiments in which the use of low extracellular Ca2+reduced release probability to a level at which postsynaptic uniqan- tal events appeared in response to NGFC activation. We evaluated our uniquantal event detection dataset by measuring multiple parameters of each event. We measured the slope of fitted line on the initial phase of events/failures, amplitude (averaged maximum), and the area of events. Using K-means cluster analysis on the three parameters, we managed to separate the events into three groups having failures, uniquantal and multiquantal responses as separate groups. Having separated uniquantal events this way, we found that averaged quantal amplitude was 4.59±0.73 pA (n=4) which is statistically not different (p=0.68, Mann-Whitney test) from quantal amplitude measured with BQA. (Figure 1—figure supplement 1). Full reconstruction of functionally connected NGFC-PC pairs (n = 6) allowed comparisons of the Nfrs estimated by BQA and the number of putative release sites by counting the number of presynaptic boutons located within increasing radial distances mea- sured from postsynaptic dendrites (Figure 1H). Previous experiments showed that direct synaptic junctions are not required for functional NGFC to PC connections (Ola´h et al., 2009) and GABA reaches receptors up to 3 mm from the release site (Farrant and Nusser, 2005; Overstreet- Wadiche and McBain, 2015; Overstreet et al., 2000). In agreement with earlier observations (Ola´h et al., 2009), direct appositions were not observed in most NGFC to PC pairs and the number of NGFC axonal boutons potentially involved in eliciting postsynaptic responses increased by sys- tematically increasing the radial distance from the dendrites of PCs. Projecting the range of BQA- derived Nfrs estimates over the number of NGFC boutons putatively involved in transmission for the same connections (Figure 1H, red lines) suggests an effective range of 0.86–1.75mm for nonsynaptic volume transmission from NGFCs to PCs supporting previous reports on distances covered by extra- synaptic GABAergic communication (Farrant and Nusser, 2005;Overstreet-Wadiche and McBain, 2015; Overstreet et al., 2000). Moreover, we detected linear correlation (r = 0.863, p = 0.027) between BQA-derived Nfrs and the number of NGFC boutons putatively involved in transmission at radial distances <1.5 mm from PC dendrites; decreasing or increasing the distance resulted in the loss of correlation (Figure 1I).
Structural characteristics of GABAergic connections established by the population of layer 1 NGFCs
To have a better idea about how does the volume transmission radius potentially affect the fraction of converging outputs of L1 NGFC population to the same space, we developed a model to assess the overall output of NGFCs located in the supragranular layers of the neocortex. Unitary volume transmission by NGFCs is limited to their extremely dense axonal arborization (Ola´h et al., 2009;
Ro´zsa et al., 2017) Therefore, we determined the three-dimensional (3D) distribution of axon lengths of individual NGFCs with Sholl analysis (Figure 2A). By superimposing individual NGFC Figure 1 continued
Ca2+, 2 mM Mg2+(right), with projected binomial fits (blue). (F) Estimated release probability values in different experimental conditions (n = 8). (G) Estimated quantal size (3.93±1.22 pA) and number of functional release sites (Nfrs; 10.96±8.1) derived from Bayesian quantal analysis in each experiment (n = 8). (H) Number of NGFC boutons in the proximity of postsynaptic PC dendrites from anatomical reconstructions of connected NGFC to PC pairs (n = 8; gray, individual pairs; blue, average, and SD). For comparison, red lines indicate mean±SD of Nfrs shown on panel F corresponding to distances between presynaptic NGFC boutons and PC dendrites. (I) Number of NGFC boutons counted at increasing distances from PC dendrites in NGFC to PC pairs. Correlation to Nfrs in the same pairs is best when counting boutons closer than 1.5mm from PC dendrites.
The online version of this article includes the following figure supplement(s) for figure 1:
Figure supplement 1.A representative single experiment for quantal amplitude measurement during low release probability.
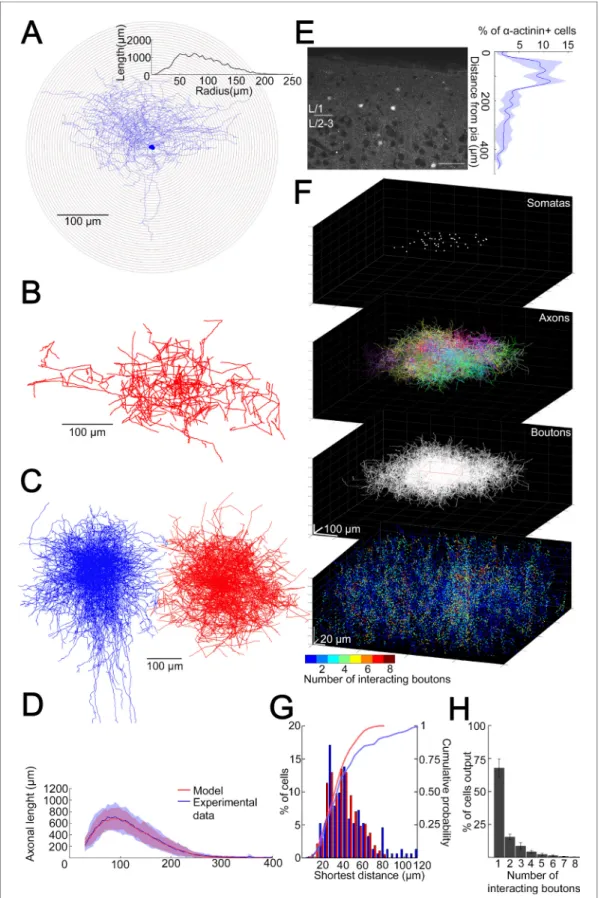
Figure 2.Structural characteristics of collective GABAergic output formed by the population of layer 1 neurogliaform cells (NGFCs). (A) Sholl analysis on the axonal arborization of an individual NGFC. Inset, axonal lengths measured in concentric shells of increasing radius (step, 10mm). (B) Three- dimensional arborization of a model generated axon. (C) Superimposition of three-dimensionally reconstructed axonal arborizations of NGFCs (n = 16, blue) and the computer generated model NGFCs (n = 16, red) aligned at the center of somata. (D) Comparison of manually reconstructed axonal Figure 2 continued on next page
Research article Neuroscience
reconstructions centered by their somata (n = 16;Figure 2C), a representative distribution of axons was calculated as a function of distance from the soma (Figure 2D). We also assessed the distance between axonal boutons (n = 1456) along reconstructed axons of NGFCs (n = 6) and found that interbouton distances were 3.36±2.54mm (Figure 2—figure supplement 1). Next, we developed an algorithm that generates model NGFCs (n = 52) by growing axon arborizations similar (p = 0.99, two-sided K-S test,Figure 2D) to the population of the experimentally reconstructed representative distribution of NGFC axons (n = 16) using interactions of segment lengths, branch point locations, and segment orientations while keeping the density of axonal boutons along axon segments (Figure 2B,C). In order to achieve a relatively complete representation of all NGFC axon terminals in a model at the population level, we performed immunhistochemical labeling ofa-actinin2, which is known to label the overwhelming majority of supragranular NGFCs in the neocortex (Uematsu et al., 2008). Somata immunoreactive for a-actinin2 in superficial cortical layers showed distribution along the axis perpendicular to the surface of the cortex with a peak at~50–150mm dis- tance from the pia mater (Figure 2E). According to this radial distribution and with no apparent ten- dency along the horizontal axis, we placed NGFC somatas in a 354 354 140 mm3volume to create a realistic spatial model of L1 NGFC population (Figure 2F). 3D pairwise shortest distances betweena-actinin2 + somata (n = 152) and distances between somata placed into the model space (n = 374) were similar (p = 0.51, two-sided K-S test,Figure 2G). We then used the axon growing algorithm detailed above from each soma position to model a population-wide distribution of NGFC axonal release sites. Quantal and structural properties of NGFC to PC connections shown above sug- gest a volume transmission distance of~1.5mm from potential sites of release (Figure 1H,I), thus we mapped the coverage of surrounding tissue with GABA simultaneously originating from all NGFC terminals with a 1.5mm of transmitter diffusion in the model. Using these conditions in simulations (n = 36), less than eight NGFC axonal terminals contributed as effective GABA sources at any loca- tion in the superficial neocortex (Figure 2H). Moreover, these boutons originated from a limited number of presynaptic NGFCs; when considering the extreme case of population-level cooperativity, that is, when all putative NGFCs were active, most frequently a single NGFC release site serves as a GABA source (67.7±7%) and potential interactions between two, three, or more different NGFCs take place in limited occasions (15.34±2.1%, 8.5±2.6%, and 8.45±3.16%, respectively). The out- come of these simulations is consistent with earlier results suggesting that single cell-driven volume transmission covers only the close proximity of NGFCs (Ola´h et al., 2009) but also indicates poten- tial interactions between a restricted number of neighboring NGFCs.
Coactivation of putative NGFCs in L1 somatosensory cortex in vivo
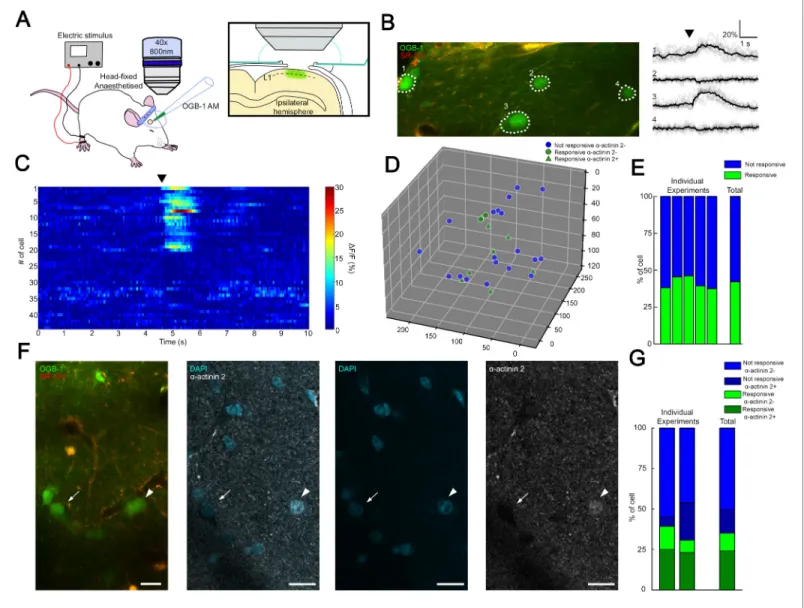
Transcallosal fibers establish interhemispheric inhibition that operates via GABABreceptor activation located on apical dendrites (Palmer et al., 2012b) and it has been suggested that this massive GABABreceptor recruitment in the superficial layers includes the activation of NGFCs (Palmer et al., 2012b). To assess the fraction of synchronously active putative NGFCs under close to physiological conditions, we applied in vivo two-photon Ca2+imaging. We monitored the activity of L1 neurons bulk-loaded with calcium indicator Oregon Green BAPTA-1-AM (OGB-1-AM) (Figure 3A) during hin- dlimb stimulation, which results in the activation of transcallosal inputs in L1 of the somatosensory cortex of urethane-anesthetized rats (n = 5). Stimulation of the ipsilateral hindlimb (200 mA, 10 ms) evoked Ca2+signals in a subpopulation of neurons in L1 (n = 114 neurons; n = 46 versus 68 respon- sive versus non-responsive neurons, respectively; data pooled from six animals; Figure 3B and C).
Figure 2 continued
arborizations of NGFCs (n = 16; blue, mean; light blue, SD) and model generated axons (n = 52; red, mean; light red, SD). (E) Left:a-Actinin2 immunohistochemistry in supragranular layers of the neocortex (scale bar, 100mm). Right: Distribution ofa-actinin2 immunopositive somata. (F) Top:
Three-dimensional model of NGFCs somata, axonal arborizations, and bouton distributions in a 354354140mm3volume. Bottom: heat map showing the number of axonal boutons interacting at distances of <1.5mm. (G) Distribution of the shortest distance between somata in the model (red) and ina-actinin2 immunohistochemistry experiments (blue). (H) Percentage distribution of the number of interacting boutons within 1.5mm distance from each NGFC.
The online version of this article includes the following figure supplement(s) for figure 2:
Figure supplement 1.Calculation of neurogliaform cells (NGFCs) interbouton interval.
On average, 38.2 ±5.2% of the L1 neurons were active following ipsilateral hindlimb stimulation, which is remarkably similar to the proportion found earlier (Palmer et al., 2012b;Figure 3E). To fur- ther identify L1 neurons active during hindlimb stimulation, we performed immunohistochemistry for the actin-binding proteina-actinin2 (Uematsu et al., 2008;Figure 3D and F) using the same cortical area of L1 on which two-photon imaging was performed previously. Mapping a-actinin2 positive Figure 3.Coactivation of neurogliaform cell population in L1 somatosensory cortex in vivo. (A) Experimental setup. Head-fixed anesthetized rats were placed under a two-photon microscope having a cranial window above the hindlimb somatosensory cortex. OGB-1 AM and SR 101 were injected into L1. Ipsilateral hindlimb stimulation was performed with an electric stimulator. (B) Two-photon image of neurons that were labeled with OGB-1 in L1. SR 101 labeled astrocytes. Right:DF/F changes of Ca2+signals (gray: individual traces; black: mean of 10 consecutive traces) during series of ipsilateral stimulation (black arrowhead). Traces correspond to the marked cells. (C) Time-series heat map of 44 L1 interneurons evokedDF/F changes in Ca2+
signals during ipsilateral hindlimb stimulation in a single experiment (black arrowhead). (D) Scatter plot showing the spatial location of L1 interneuron somata in a single experiment. Colors are corresponding to the responsiveness shapes to the molecular identity (not responsive anda-actinin2 , blue dots; responsive anda-actinin2 , green dots; responsive anda-actinin2+, green triangles). (E) Stack columns show the fraction of responsive versus not responsive cells in different experiments (n = 5 animals). Far-right columns show the mean value. (F) In vivo two-photon image showing imaged neurons. To the right, confocal images from the same area show immunohistochemical detection ofa-actinin2+ neurons (arrowhead).a-Actinin2 cells were visualized by exclusive DAPI (40,6-diamidino-2-phenylindole) staining (arrow). Scale bar, 20mm. (G) Stack columns show the proportion ofa- actinin2 immunoreactivity among responsive versus not responsive cells (n = 2 animals). Far-right columns show the mean value.
The online version of this article includes the following figure supplement(s) for figure 3:
Figure supplement 1.Spatial relationship of responsive and not responsive L1 interneurons during ipsilateral hindlimb stimulation.
Research article Neuroscience
cells among in vivo two-photon Ca2+ imaging monitored interneurons (Figure 3D) showed that closely located presumed NGFCs were active (on average 216.09±77.93mm soma to soma distance from two experiments,Figure 3—figure supplement 1) allowing summation of outputs by presump- tive NGFCs. Cross-examination of neurons responsive/non-responsive to hindlimb stimulation versus neurons immunopositive/negative for a-actinin2 revealed that the majority of the active neurons werea-actinin2 positive (10 out of 15 neurons, 67%, n = 2 animals) and the majority of inactive neu- rons werea-actinin2 negative (22 out of 26 neurons, 85%,Figure 3G) suggesting that a substantial fraction of L1 NGFCs are activated during hindlimb stimulation. Combination of the datasets derived from the structural analysis of GABAergic connections established by the population of layer 1 NGFCs above and the in vivo mapping of coactivated putative NGFCs suggests that summation of NGFC output is feasible and, at the same time, is dominated by GABA released from boutons of a one or two NGFCs: having approximately two-thirds of NGFCs simultaneously active further sup- presses the potentially synchronous contribution of three or more NGFCs (8.5% and 8.45%, see above) already constrained by structural properties in a point of the cortex.
Summation of convergent, unitary IPSPs elicited by NGFC
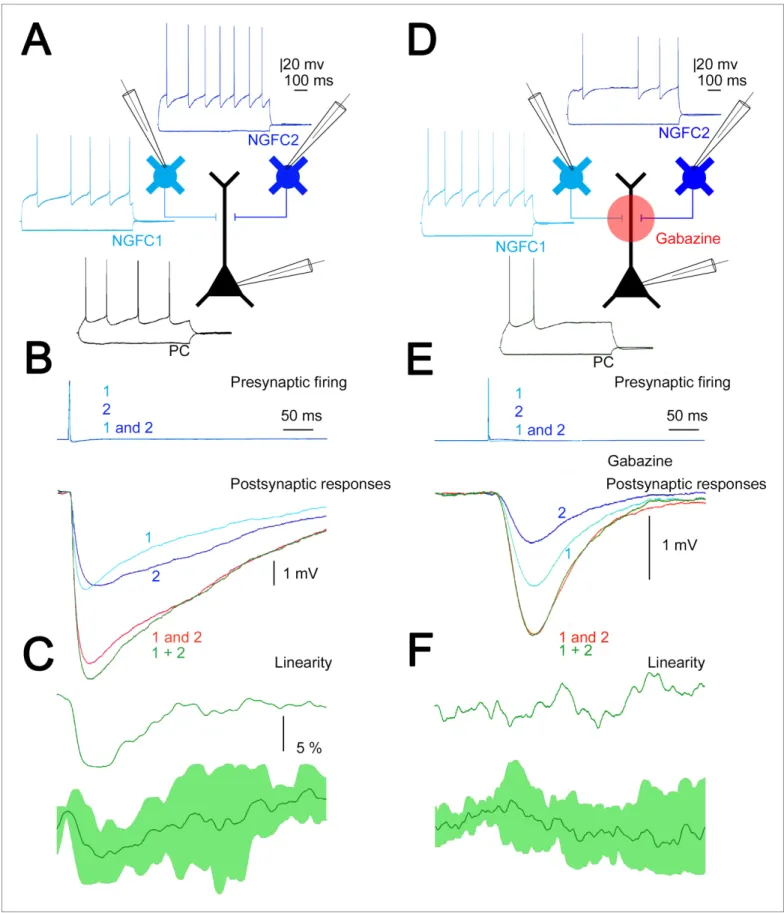
Our in vivo measurements above corroborate earlier results (Palmer et al., 2012b) on widespread simultaneous activation of putative L1 NGFCs in response to transcallosal inputs. To directly measure the summation of converging inputs from superficial NGFCs, in vitro simultaneous triple recordings were performed from two presynaptic NGFCs and a target PC (n = 4,Figure 4A). First, we mea- sured the amplitude of unitary IPSPs (n = 8) elicited by single L1 NGFCs in the target L2/3 PC and found that smaller and bigger inputs in a triplet were 1.68±1.51 and 2.19±1.33 mV (rise time:
4.66±2 ms; half-width: 19.29±5.76 ms; decay time: 8.94 ±2.91 ms), respectively. Next we acti- vated the two L1 NGFC inputs synchronously (0.17±0.05 ms) and such coactivation resulted in mod- erately sublinear summation of convergent IPSPs (maximal nonlinearity, 9.1±4.3%) measured as the difference of calculated ( 3.81±2.76 mV) and experimentally determined ( 3.57 ±2.55 mV) sums of convergent single inputs (n = 4,Figure 4B). These results are in line with experiments show- ing moderately sublinear interactions between identified, single cell evoked fast IPSPs (Tama´s et al., 2002). Interestingly, the time course of sublinearity followed the fast, presumably GABAAreceptor- mediated part of the unitary and summated IPSPs (Figure 4C) suggesting that ionotropic and metabotropic GABAergic components of the same input combinations might follow different rules of summation. To test the interaction of unitary GABAB receptor-mediated IPSPs directly, we repeated the experiments above with the application of the GABAA receptor antagonist gabazine (10 mM). Pharmacological experiments on the output of NGFCs are very challenging due to the extreme sensitivity of NGFC triggered IPSPs to presynaptic firing frequency (Capogna, 2011;
Tama´s et al., 2003) forcing us to collect the data in a different set of triple recordings (n = 8, Figure 4D). As expected (Tama´s et al., 2003) unitary, gabazine-insensitive, slow IPSPs had onset latencies, rise times, and half-widths similar to GABAB receptor-mediated responses (49.42 ±5.8, 86.95±8.82, and 252.27±36.92 ms, respectively, n = 16,Figure 4E). Peak amplitudes of converg- ing smaller and bigger slow IPSPs were 0.66±0.22 and 0.94±0.37 mV, respectively. Synchronous activation of two presynaptic L1 NGFC converging onto the same L2/3 PC resulted in linear ( 1.6± 6.6%) summation of slow IPSPs as peak amplitudes of calculated sums of individual inputs versus experimentally recorded compound responses were 1.58±0.53 and 1.60±0.55 mV, respectively (Figure 4F). Taken together, our triple recordings in gabazine versus control conditions suggest sig- nificantly different (p=0.021, two-sided MW U-test) linear interactions between slow, GABABIPSPs as opposed to sublinearly summating fast, GABAAIPSPs elicited by the same presynaptic interneu- ron population.
Integration of GABA
Breceptor-mediated responses are not affected by HCN channel and GABA reuptake
The predominant target area of the superficial NGFCs, the distal apical dendritic membrane of PCs, express voltage-dependent hyperpolarization-activated cyclic nucleotide-gated channel 1 (HCN1) known to attenuate dendritic signals (Berger et al., 2001;Kalmbach et al., 2018;Lo¨rincz et al., 2002;Robinson and Siegelbaum, 2003;Sheets et al., 2011). To investigate whether HCN1 chan- nels contribute to mechanisms of interactions between GABAB receptor-mediated postsynaptic
Figure 4.Summation of convergent, unitary inhibitory postsynaptic potentials (IPSPs) elicited by neurogliaform cells (NGFCs). (A) Schematic experimental setup of triplet recordings. Firing pattern of two presynaptic NGFCs (light blue and blue) and a postsynaptic pyramidal cell (PC) (black).
(B) Action potential triggered under control conditions in the NGFCs individually (1, 2) or synchronously (1 and 2) elicited unitary (1, 2) and convergent (1 and 2) IPSPs in the postsynaptic PC. Below, the time course of the difference between the measured (1 and 2) and calculated (1 + 2) sums of Figure 4 continued on next page
Research article Neuroscience
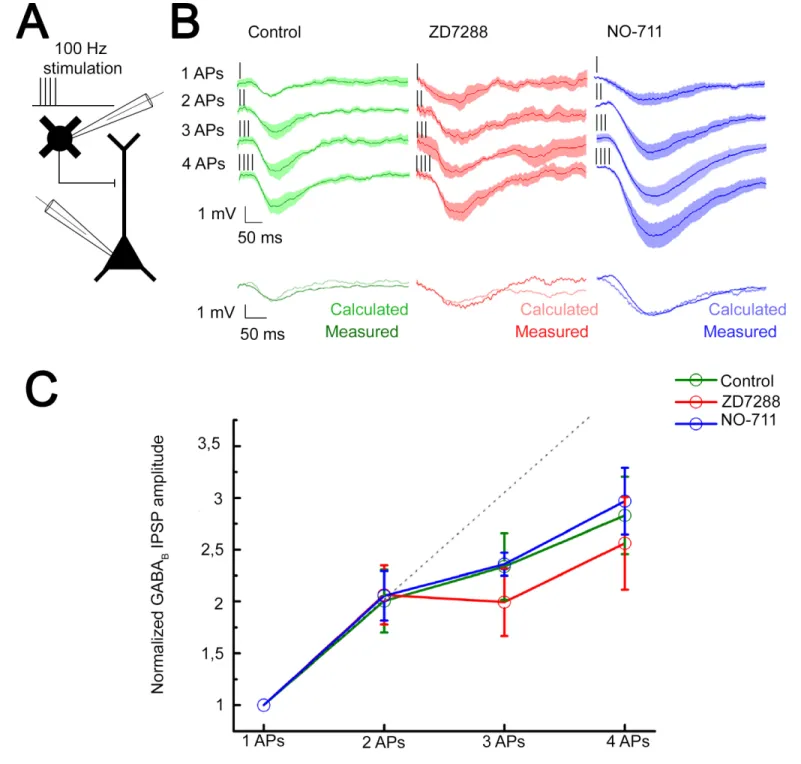
responses, we performed experiments on NGFC-to-PC pairs and evoked one to four APs in a single presynaptic NGFC at 100 Hz. The high stimulus frequency allows to induce GABA release with up to four APs and still remain within the time window where the presynaptic GABABreceptors are not yet activated and unable to inhibit voltage-dependent Ca2+ channels (Chen and van den Pol, 1998).
This ensures that short-term plasticity does not have a presynaptic effect that could hinder the release of GABA by later APs (Karayannis et al., 2010). This experimental configuration mimics the extreme conditions when multiple presynaptic release sites converge in a tight space and creating excessive GABABreceptor-mediated inhibition (Figure 5A). Triggering a single spike in the presence of gabazine (10mM) did not saturate postsynaptic GABABreceptors since the postsynaptic response induced by two spikes was proportional to the arithmetic sum of unitary postsynaptic responses (experimental sums: 1.25 mV calculated sums: 1.26 mV; unitary IPSP rise time: 78.69±27.28 ms;
decay time: 56.27 ± 15.88 ms), apparently showing linear summation properties similar to triple recordings testing summation convergent inputs above. However, further increase in the number of evoked APs to 3 and 4 introduced sublinearity to summation (n = 6, 1AP: 0.63±0.50 mV, 2APs:
1.25 ±1.06 mV, 3APs: 1.53±0.84 mV, 4APs: 1.61±1.09 mV,Figure 5B; normalized values:
2APs: 2.00±1.08, 3APs: 2.34±1.16, 4APs: 3.17±1.26,Figure 5C). Importantly, recordings in the presence of HCN1 channel blocker, ZD7288 (10mM) showed summation properties similar to con- trol, summation was linear with two APs and changed to slightly sublinear upon the 3rd to 4th spike (n = 5, 1AP: 0.82±0.63 mV, 2APs: 1.59±0.76 mV, 3APs: 1.66±0.72 mV, 4APs: 1.90±1.07 mV, unitary IPSP rise time: 97.7±29.05 ms and decay time: 103.57±48.94 ms;Figure 5B; normal- ized values and its comparison to control: 2APs: 2.06± 1.06, p = 0.983; 3APs: 1.99 ±1.17, p = 0.362; 4APs: 2.56±1.6, p = 0.336; two-sided MW U-test,Figure 5C). These experiments suggest that when a physiologically probable number of NGFCs are simultaneously active, HCN1 channels are locally not recruited to interfere with the summation of GABABreceptor-mediated responses.
Previous experiments suggested that a single AP in an NGFC is able to fill the surrounding extra- cellular space with an effective concentration of GABA (Ola´h et al., 2009) and, in turn, extracellular GABA concentration producing GABABreceptor activation is tightly regulated via GABA transport- ers (GAT-1) (Gonzalez-Burgos et al., 2009; Isaacson et al., 1993; Ro´zsa et al., 2017;
Szabadics et al., 2007). Therefore, we tested whether GAT-1 activity affects the summation of GABABreceptor-mediated responses potentially limiting the number of GABAB receptors reached by GABA released by NGFCs. Selective blockade of GAT-1 with NO-711 (10 mM) increased the amplitude of GABAB receptor-mediated IPSP; however, it did not influence summation properties (n = 6, 1AP: 1.11±0.62 mV, 2APs: 2.28±1.07 mV, 3APs: 3.1±0.40 mV, 4APs: 3.54±1.59 mV, unitary IPSP rise time: 118.85±37.58 ms; decay time: 80.54±40.94 ms;Figure 5B; normalized values and its comparison to control: 2APs: 2.06±1.17, p = 0.853; 3APs: 2.36±0.31, p = 0.645;
4APs: 2.97±1.54, p = 0.515; two-sided MW U-test,Figure 5C). Accordingly, interactions between an in vivo realistic number of simultaneously active NGFCs lead to linear GABABresponse summa- tion even if increased concentration of GABA is present in the extracellular space.
Subcellular localization of GABA
Breceptor-GIRK channel complex determines summation properties
High-resolution quantitative electron microscopy showed that GABABreceptors and GIRK channels are segregated on dendritic shafts; however, receptor-channel complexes colocalize on dendritic spines (Kulik et al., 2006). Theoretical studies suggest that the distance between the receptor and effector limits the recruitment of effector molecules to the vicinity of receptors (Brinkerhoff et al., 2008;Kulik et al., 2006), thus we asked if summation properties were influenced by the relative location of of GABAB receptors and GIRK channels when several presynaptic inputs converge. To this end, we constructed a simulation environment based on a previously published 3D Figure 4 continued
convergent IPSPs. (C) The linearity of response summation in a single experiment (top) and on populations of convergent NGFC triggered IPSPs (bottom) recorded in control conditions (n = 4) (dark green, population average; light green, SD). (D) Same as experimental setup as (A) on a different set of cells but in the presence of GABAAreceptor antagonist, gabazine. (E) Identical stimulation protocol as (B), note the disappearance of the difference between the measured (1 and 2) and calculated (1 + 2) sums of convergent IPSPs. (F) Same as (C), but under blocking GABAAreceptors with gabazine (n = 8) (dark green, population average; light green, SD).
Figure 5.Integration of GABABreceptor-mediated responses are not affected by HCN channel and GABA reuptake. (A) Schematic experimental setup of paired recordings. Bursts of up to four action potentials (APs) were elicited in neurogliaform cells (NGFCs) at 100 Hz in the presence of gabazine. (B) NGFC to pyramidal cell (PC) paired recordings showed similar linear GABABreceptor-mediated summation under control conditions. Top: Individual traces showing inhibitory postsynaptic potential (IPSP) kinetics upon AP burst protocol (vertical lines indicating the triggered APs) during control (green traces, n = 6), in presence of hyperpolarization-activated cation (HCN) channel blocker ZD7288 (red traces, n = 5) or GABA reuptake blocker NO-711 (blue traces, n = 6). Bottom: Traces show measured IPSP from two consecutive presynaptic stimulation (measured) and the arithmetic sum of two unitary IPSP (calculated). (C) Summary of normalized IPSP peak amplitudes. Compare to control conditions (2APs: 2.00±1.08; 3APs: 2.34±1.16; 4APs: 3.17± 1.26), summation properties of GABABmediated unitary IPSPs are neither affected by application of ZD7288 (2APs: 2.06±1.06, p = 0.983; 3APs: 1.99± 1.17, p = 0.362; 4APs: 2.56±1.6, p = 0.336; two-sided MW U-test) nor NO-711 (2APs: 2.06±1.17, p = 0.853; 3APs: 2.36±0.31, p = 0.645; 4APs: 2.9 7±
1.54, p = 0.515; two-sided MW U-test). Dashed line indicates the linearity.
Research article Neuroscience
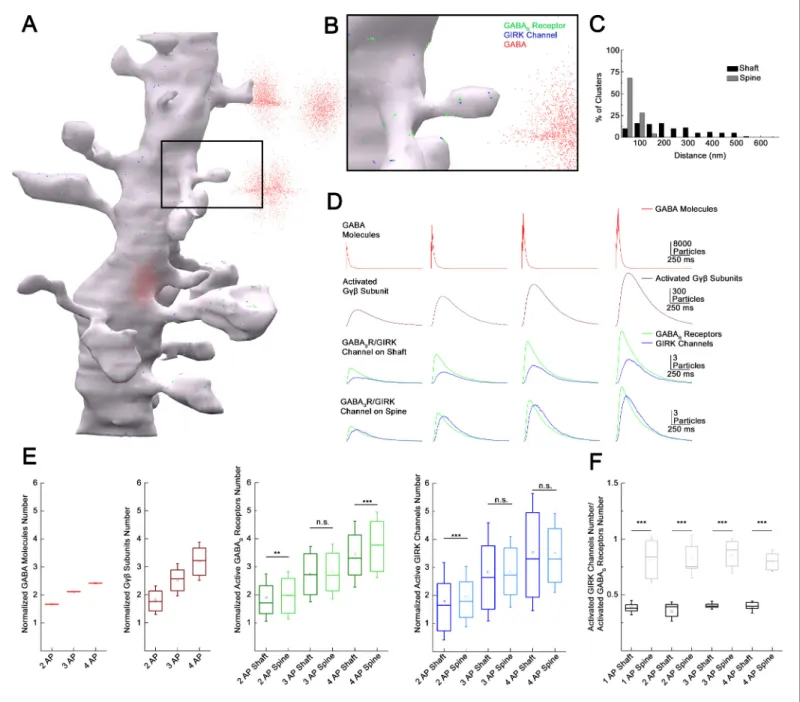
reconstruction of a postsynaptic dendritic segment (Edwards et al., 2014) targeted by realistically positioned release sites of NGFCs (Figure 6A and B). Molecular interactions in this spatially realistic system were modeled using Monte Carlo algorithms to simulate movements and reactions of mole- cules (Kerr et al., 2008). Membranes of the postsynaptic dendritic segment were populated (see Materials and methods,Figure 6—figure supplement 1) with GABABreceptors and GIRK channels according to compartment-dependent data from SDS-digested freeze-fracture replica immunolabel- ing (Kulik et al., 2006;Figure 6C). Neurotransmitter diffusion in the brain is influenced by tissue tor- tuosity and the fraction of extracellular space in total tissue volume (Sykova´ and Nicholson, 2008), thus we simulated realistic molecular diffusion in tortuous extracellular space (Tao et al., 2005) (see Materials and methods). The number and position of NGFC presynaptic boutons around the post- synaptic dendritic segments in the model were used according to structural characteristics of GABAergic connections established by individual NGFCs (n = 4 boutons 1.2±0.7mm from the den- drite; Figure 1I,H, Figure 6—figure supplement 2) and according to the bouton density deter- mined for the overall output of NGFC population (Figure 2F). Previous work suggests that a single AP in an NGFC generates GABA concentrations of 1–60 mM lasting for 20–200 ms (Karayannis et al., 2010). In our model, the amount of released GABA was consistent from release event to release event and dropped off exponentially with distance from the synapse ([GABA]: 0.0 mm, 1 mM; 0.5mm, 60mM; 2.0mm, 1mM;Figure 6—figure supplement 3,Supplementary file 1, 2). The GABA exposure time was 114.87±2.1 ms with decay time constants of 11.52±0.14 ms. Our modeling trials show that single AP triggered GABA release can activate a total of 5.82 ± 2.43 GABABreceptors (2.81±1.55 on spine, 3.01±1.71 on the shaft). Furthermore, activation of GABAB
receptors triggers intracellular mechanisms and the initial GDP/GTP exchange at the Ga subunit separates the G-protein heterotrimeric protein and produces Gbg subunits (peak number of Gbg subunits for single AP: 338.54±138.75). Lateral membrane diffusion of Gbgsubunits lead to the acti- vation of 3.66 ± 2.17 GIRK channels in total (2.47 ± 1.88 on spine, 1.17 ±1.26 on the shaft) in response to single AP. Next, consecutive GABA releases were induced with 10 ms delays to repli- cate the 100 Hz stimulation protocol used in the experiments above (Figure 5A). The increased GABA concentration from two sequential stimuli raised the number of active GABAB receptors to 11.29 ±3.48 (5.57 ±2.36 on spine, 5.72±2.52 on the shaft). Three and four consecutive releases activated a total of 16.19±3.88 and 20.99 ±4.99 GABAB receptors, respectively (7.96±2.74 on spine, 8.23±2.97 on the shaft and 10.62 ±3.28 on spine, 10.37±3.53 on the shaft, respectively).
When modeling consecutive GABA releases, massive amount of Gbg subunits were produced together with a decline in relative production efficacy per APs, possibly due to the limited number of G-proteins serving as a substrate in the vicinity of active receptor clusters (peak number of Gbg subunits for 2AP: 612.10±171.95; 3AP: 857.78±194.14; 4AP: 1081.81 ±229.57). Two consecutive APs resulted in the activation of 6.98±3.29 GIRK channels (2.13±1.63 on dendritic shaft and 4.85± 2.65 on spine) in the simulations. Importantly, this number of activated GIRK channels in response to two APs was close to the arithmetic sum of the number of GIRK channels activated by two single AP responses ( 4.87% in total, 1.86% on spines and 9.86% on the shaft; Figures 4E and 5A). Further increase in the GABA exposure proportional to three and four APs leads to the activa- tion of 10.39 and 12.89 GIRK channels, respectively (7.01±3.11 and 8.68±3.46 on spines and 3.37
±2.08 and 4.21±2. 48 on the shaft, respectively). These numbers of GIRK channels corresponded to 5.68% and 13.58% of the arithmetic sum of GIRK channels activated by three and four single AP responses ( 5.71% and 13.82% on spines and 4.15% and 11.16% on the shaft). The increased lin- earity of total GIRK channel activation relative to experimental results could be a result of several unknown properties of the cascade linking GABABreceptors to GIRK channels and/or due to vesicle depletion in terminals of NGFCs during multiple rapid release of GABA not incorporated into our model.
GABAB receptor and GIRK channel complexes located in particular subcellular compartments appeared to have different effectiveness of recruiting GABABreceptors and active GIRK channels in our simulations (Figure 6D). We observed different numbers of GABABreceptors activated on the shaft and spine (normalized values to 1AP: 2APs: shaft: 1.91±0.84, spine: 1.98±0.84, n = 534, p = 0.009; 3APs: shaft: 2.74±0.99, spine: 2.84±0.98, n = 1871, p = 0.173; 3APs: shaft: 3.45±1.18, spine: 3.78±1.17, n = 709, p< 0.005, two-sided MW U-test,Figure 6E). The recruitment of GIRK channels was more effective on spines compared to shafts when triggering two APs (normalized val- ues to 1AP: shaft: 1.8±1.37, spine: 1.96±1.07, n=534, p<0.005); the trend was similar in response to
Figure 6.Subcellular localization of GABABreceptor-G-protein gated inward rectifier potassium (GIRK) channel complex determines summation properties. (A) Visualization of the complete MCell-based model in the course of GABA release. (B) Magnified view of the model. (C) Distribution of GABABreceptors and GIRK channel clusters on the dendritic membrane in the model (gray bars: dendritic spine; black bars: dendritic shaft). (D) Overview of the molecular interactions during increasing GABA release. Top to bottom: NGFC output simulated by releasing GABA (red) in the extracellular space proportional to one to four action potential (AP) stimulation. Below, the total number of produced Gbgsubunits (brown) by activated GABABreceptors (green) located on the dendritic shaft and spine. After lateral diffusion in the plasma membrane, Gbgsubunits bind to GIRK channels (blue). (E) Boxplot of GABA, Gbgsubunits, GABABreceptors, and GIRK channels quantity normalized to 1AP (GABA: 2APs: 1.67±0.004, 3APs: 2.12± 0.005, 4APs: 2.42±0.006, Gbgsubunits: 2APs: 1.85±0.51, 3APs: 2.53±0.57, 4APs: 3.2±0.68; GABABreceptor shaft: 2APs: 1.91±0.84, 3APs: 2.74± 0.99, 4APs: 3.45±1.18; GABABreceptor spine: 2APs: 1.98±0.84, 3APs: 2.84±0.98, 4APs: 3.78±1.17; GIRK channel shaft: 2APs: 1.8±1.37, 3APs: 2.84± 1.75, 4AP: 3.55±2.09; GIRK channel spine: 2APs: 1.96±1.07, 3APs: 2.84±1.26, 4APs: 3.52±1.4). Square indicates the mean, line shows the median inside the boxplot. (F) Quantification of the signaling effectiveness on the shaft and spine region of the model dendrite during increasing GABA release (1AP: shaft: 0.39±0.06, spine: 0.82±0.21, p < 0.005, n = 1164, two-sided MW U-test; 2AP: shaft: 0.35±0.086, spine: 0.84±0.19, p < 0.005, n = 534, two-sided MW U-test; 3AP: shaft:±0.41±0.036, spine: 0.85±0.15, p < 0.005, n = 1871, two-sided MW U-test; 4AP: shaft: 0.39±0.05, spine: 0.81±0.01, p < 0.005, n = 709, two-sided MW U-test). Square indicates the mean, line shows the median inside the boxplot.
The online version of this article includes the following figure supplement(s) for figure 6:
Figure supplement 1.GABABreceptor and G-protein gated inward rectifier potassium (GIRK) channel distribution, created by a cascade reaction.
Figure 6 continued on next page
Research article Neuroscience
three and four APs, but results were not significant (normalized values to 1AP: 3AP: shaft: 2.84±1.75, spine: 2.84±1.26, n = 1871, p = 0.109; 4AP: shaft: 3.55 ±2.09, spine: 3.52 ±1.4, n = 709, p = 0.216, two-sided MW U-test,Figure 6E). The compartment-specific effectiveness of signaling as the ratio of activated GIRK channels and active GABABreceptors (Figure 6F) shows that spines repre- sent the preferred site of action corroborating earlier suggestions (Qian and Sejnowski, 1990).
Discussion
The unique inhibitory communication via volume transmission separates NGFC interneurons from other interneuron classes in the neocortex. Numerous observations support the idea of volume transmission (Overstreet-Wadiche and McBain, 2015). (1) NGFC activation generates an unusually prolonged inhibition on the postsynaptic cell (Karayannis et al., 2010; Man´ko et al., 2012;
Ola´h et al., 2009; Szabadics et al., 2007). (2) Released GABA acts on synaptic and extrasynaptic GABA receptors (Karayannis et al., 2010; Ola´h et al., 2009; Price et al., 2005; Tama´s et al., 2003), (3) as well as on nearby presynaptic terminals (Ola´h et al., 2009). (4) NGFCs show a very high rate of functional coupling between the neighboring neurons (Jiang et al., 2015;Ola´h et al., 2009).
(5) Ultrastructural observations showed the lack of clearly defined postsynaptic elements in the apposition of the NGFC boutons (Man´ko et al., 2012;Ola´h et al., 2009; Vida et al., 1998). (6) NGFCs act on astrocytes within the reach of their axonal arborization through nonsynaptic coupling (Ro´zsa et al., 2017). The distance of effective operation through NGFC-driven volume transmission, however, is not clear. Here, we used functional and structural characterization of NGFC-PC inhibitory connections and suggest that GABA released from NGFC axonal terminals activates GABA recep- tors up to about~1.8mm, a result remarkably similar to previous estimations for the range of extra- synaptic action of synaptically released GABA (Farrant and Nusser, 2005;Overstreet-Wadiche and McBain, 2015;Overstreet et al., 2000). Given that our distance estimates are not based on ultra- structural evidence and we cannot exclude that fraction of anatomically defined boutons were not functional, the accuracy of our prediction for the range of volume transmission is limited. Our experi- ments also shed light to some quantal properties of NGFC’s GABA release. These experiments are constrained by the robust use-dependent depression mediated by NGFCs (Karayannis et al., 2010;
Tama´s et al., 2003), therefore implementation of multiple probability fluctuation analysis (Sil- ver, 2003), the gold standard for quantal analysis, was not feasible and BQA (Bhumbra and Beato, 2013) was needed as an alternative. The revealed linear correlation between BQA-derived Nfrs and the number of NGFC boutons putatively involved in transmission is compatible with the release of a single docked vesicle from individual NGFC boutons. However, our light microscopic methods applied in this study are insufficient for definitive claims concerning single or multivesicular release from neurogliaform boutons, especially in the light of studies highlighting the inaccuracy of compar- ing the Nfrs with the anatomical synaptic contacts detected by light microscopy (Ola´h et al., 2009, Molna´r et al., 2016,Holler et al., 2021).
The functional distance of volume transmission is particularly important for the characterization of interactions between NGFCs and for understanding the population output of NGFCs. Realistic representation of an entire subpopulation of neurons is considered essential for the interpretation of network functions (Karnani et al., 2014;Markram et al., 2015) and pioneering full-scale data-driven models were effective in deciphering emerging functions of interneuron populations (Bezaire et al., 2016). However, network diagrams addressing the function of NGFCs exclusively based on synaptic connectivity underestimate the spread of output without incorporating volume transmission by an order of magnitude (Ola´h et al., 2009). Although the concept of blanket inhibition has been sug- gested for networks of interneuron populations having overlapping axonal arborizations and dense synaptic output (Karnani et al., 2014), our spatial model based on high-resolution reconstructions of labeled NGFCs takes the concept to its extremes and reveals an unprecedented density of release sites for a population of cortical neuron and shows that the overwhelming majority of the superficial Figure 6 continued
Figure supplement 2.Calculation of the neurogliaform cell (NGFC) release site density for the MCell model.
Figure supplement 3.Estimated GABA spatial concentration profiles during multiple releases.
cortical space is effectively covered by at least one NGFC. At the same time, the redundancy of the NGFC population is limited and a single cortical spatial voxel is reached by GABA released from a limited number of individual NGFCs,~83% of space is covered by one or two NGFCs. Our relatively simple in vivo approach to gauge potential synchronous action of NGFCs gave positive results. This is in line with earlier observations suggesting widespread action of putative NGFCs in terminating persistent activity (Craig et al., 2013), or powerfully suppressing dendritic Ca2+ dynamics in L2/3 and L5 (Palmer et al., 2012a;Wozny and Williams, 2011). Strong cholinergic neuromodulation of NGFCs (Poorthuis et al., 2018) and frequent gap junctional coupling between NGFCs (Simon et al., 2005) further facilitate concerted action and are likely to play a major role in synchro- nizing the NGFC network (Yao et al., 2016).
When studying simultaneous action of NGFCs, our direct measurements of two converging NGFC inputs on L2/3 PC from simultaneous triple whole-cell patch clamp recordings revealed sublin- ear summation properties for ionotropic GABAA receptor-mediated responses. These results sup- port classic theories on synaptic input interactions (Jadi et al., 2012;Koch et al., 1983;London and Ha¨usser, 2005;Qian and Sejnowski, 1990;Silver, 2010) and are in line with earlier experiments measuring interactions of anatomically identified inputs converging to neighboring areas of the den- dritic tree of the same postsynaptic cell (Hao et al., 2009;Tama´s et al., 2002). Mechanisms of inter- action between convergent inputs from NGFCs might be similar to those suggested for short-term synaptic depression of GABAA responses such as local drops in Cl driving force and membrane conductance (Huguenard and Alger, 1986; McCarren and Alger, 1985; Staley and Proctor, 1999). To our knowledge, the simultaneous triple recordings of two presynaptic NGFCs targeting the same postsynaptic PC represent the first direct experimental attempt addressing the summation of metabotropic receptor-mediated postsynaptic interactions. To date, scarce computational model studies were aimed to explore the integration properties of GABAB receptor-mediated responses and suggested a highly supralinear interaction through the amplification effect of G-protein cooper- ativity (Destexhe and Sejnowski, 1995). Our experimental approach indicates linear interactions between GABABreceptor-mediated responses in case the number of converging presynaptic cells corresponds to the number of NGFCs cooperating during in vivo network operations. This suggests that converging afferents that act on inhibitory metabotropic receptors in the same postsynaptic voxel show linear or slightly sublinear summation, conserving the impact of individual inputs. How- ever, we cannot exclude the possibility that widespread synchronization across various interneuron populations might shift the summation arithmetic in a nonlinear fashion.
Intrinsic properties of postsynaptic PCs might also contribute to the regulation of summation.
HCN1 channels are known to be enriched in the distal dendrites of PCs and mediate K+cationic cur- rent activated by membrane hyperpolarization (Kalmbach et al., 2018; Lo¨rincz et al., 2002;
Robinson and Siegelbaum, 2003). Our experiments presented above show that summation proper- ties in response to synchronized inputs from NGFCs are not significantly affected by HCN1 channels, presumably due to the relatively moderate local hyperpolarization arriving from NGFCs; again, fur- ther studies are needed to test the influence of additional interneuron classes coactivated together with NGFCs. We predict that further GABAergic activity is unlikely to change summation arithmetics based on our negative results when blocking the high-affinity plasma membrane GABA transporters concentrated in the perisynaptic and extrasynaptic areas (Melone et al., 2015) effective in modulat- ing GABA-mediated inhibition through extrasynaptic GABA spillover (Barbour and Ha¨usser, 1997;
Hamann et al., 2002;Scanziani, 2000;Szabadics et al., 2007). Despite having similar summation arithmetics of two consecutive APs to the triple-recording configuration, it remains undefined as to what extent multiple presynaptic APs resemble synchronous activation of individual release sites.
Presynaptic GABABreceptor-mediated decrease in Ca2+is unlikely (Karayannis et al., 2010); how- ever, depletion of the readily releasable pool of vesicles leading to synaptic depression cannot be ruled out – this may contribute to the apparent inconsistency between the simulation and the experi- mental data concerning summation during more than three repetitive APs, since our model does not incorporate short-term synaptic depression. As suggested by pioneering simulations on the summa- tion of GABABreceptor-mediated signaling (Destexhe and Sejnowski, 1995), a crucial intrinsic fac- tor in the postsynaptic cells is the molecular cascade linking GABABreceptors to the GIRK channels through G-proteins. Our experimental evidence for close to linear or slightly sublinear summation of GABABreceptor-mediated responses suggests that even if amplification through G-proteins plays a role, it is unable to overturn local membrane or K+ concentration-dependent factors promoting
Research article Neuroscience
sublinearity (Dascal, 1997;Inanobe and Kurachi, 2014;Stanfield et al., 2002;Wickman and Clap- ham, 1995). Amplification of GIRK current by G-proteins could be hampered by the need of cooper- ative action of up to four G-protein bg subunits to be effective in opening GIRK channels. In addition, hyperpolarization and the accompanying relatively low [Na+]imight also limit GIRK channel activation knowing that high [Na+]i promotes GIRK channel opening in depolarized cells (Wang et al., 2016). The latter scenario might promote a brain state-dependent summation of metabotropic inhibitory signals in active neuronal networks, which remains to be tested in future experiments. On the other hand, our ultrastructural model corroborates pioneering suggestions (Kulik et al., 2006;Qian and Sejnowski, 1990) that the effect of GABABreceptors is more promi- nent on dendritic spines compared to dendritic shafts, having approximately twice the number of activated GIRK channels per GABAB receptor on spines versus shafts. Admittedly, our simulations could not cover the extensive intracellular signaling pathways known to be influenced by GABAB
receptors (Gassmann and Bettler, 2012; Padgett and Slesinger, 2010; Terunuma, 2018) and future availability of comprehensive transporter and extracellular space distributions of layer 1 would enrich the model (Hrabetova et al., 2018;Korogod et al., 2015;Pallotto et al., 2015). Neverthe- less, our experiments and simulations suggest that nonsynaptic GABAergic volume transmission pro- viding relatively homogeneous and sufficient concentrations of GABA combined with increased clustering of GABABreceptors and on spines compared to shafts governs compartment-dependent efficacy.
Taken together, our experimental results and modeling analysis suggest that a randomly chosen location in the neuropil of layer 1 is targeted by a moderate number (usually one or two) presynaptic NGFCs. In turn, there is no apparent gap in the neurogliaform coverage of layer 1, that is, most ele- ments of the neuropil including classic postsynaptic compartments, presynaptic terminals, or non- neuronal cells are located sufficiently close to terminals of at least one NGFC and receive GABA non- synaptically. Interestingly, when two NGFCs which share target territory are coactivated or a single NGFC has a limited number of consecutive spikes, linear arithmetics accompany GABAB receptor summation. This supports the hypothesis that the density and distribution of neocortical NGFCs and their axonal terminals combined with the effective range of GABAergic volume transmission appear optimized for a spatially ubiquitous and predominantly linear metabotropic GABAB receptor summation.
Materials and methods
Slice preparation
Experiments were conducted to the guidelines of University of Szeged Animal Care and Use Com- mittee (ref. no. XX/897/2018). We used young adult (19–46 days of age, (P) 23.9±4.9) male Wistar rats for the electrophysiological experiments. Animals were anesthetized by inhalation of halothane, and following decapitation, 320-mm-thick coronal slices were prepared from the somatosensory cor- tex with a vibration blade microtome (Microm HM 650 V; Microm International GmbH, Walldorf, Germany). Slices were cut in ice-cold (4˚C) cutting solution (in mM) 75 sucrose, 84 NaCl, 2.5 KCl, 1 NaH2PO4, 25 NaHCO3, 0.5 CaCl2, 4 MgSO4, 25 D(+)-glucose, saturated with 95% O2and 5% CO2. The slices were incubated in 36˚C for 30 min, subsequently the solution was changed to (in mM) 130 NaCl, 3.5 KCl, 1 NaH2PO4, 24 NaHCO3, 1 CaCl2, 3 MgSO4, 10 D(+)-glucose, saturated with 95% O2
and 5% CO2, and the slices were kept in it until experimental use. The solution used for recordings had the same composition except that the concentrations of CaCl2and MgSO4were 3 and 1.5 mM unless it is indicated otherwise. The micropipettes (3–5 MW) were filled (in mM) 126 K-gluconate, 4 KCl, 4 ATP-Mg, 0.3 GTP-Na2, 10 HEPES, 10 phosphocreatine, and eight biocytin (pH 7.25; 300 mOsm).
In vitro electrophysiology and pharmacology
Somatic whole-cell recordings were obtained at ~37˚C from simultaneously recorded triplets and doublets of NGF and PC cell visualized by infrared differential interference contrast video micros- copy at depths 60–160mm from the surface of the slice (Zeiss Axio Examiner LSM7; Carl Zeiss AG, Oberkochen, Germany), 40 water-immersion objective (1.0 NA; Carl Zeiss AG, Oberkochen, Ger- many) equipped with Luigs and Neumann Junior micromanipulators (Luigs and Neumann, Ratingen,
Germany) and HEKA EPC 10 patch clamp amplifier (HEKA Elektronik GmbH, Lambrecht, Germany).
Signals were filtered 5 kHz, digitalized at 15 kHz, and analyzed with Patchmaster software.
Presynaptic cells were stimulated with a brief suprathreshold current pulse (800 pA, 2–3 ms), derived in >60 s interval. In experiments, where two presynaptic NGFCs were stimulated simulta- neously, the interval was increased >300 s. The stimulation sequence in which one or the other or both presynaptic NGFCs were stimulated was constantly altered, therefore the potential rundown effect or long-term potentiation would affect all three stimulation conditions equally. In the case of 100 Hz presynaptic burst stimulation, the interval was increased >300 s. During stimulation protocol, the order of triggering a set of one to four APs on the NGFC was randomized. The postsynaptic responses were normalized to the single AP in each individual set. During postsynaptic current- clamp recording, 50 mV holding current was set. The experiments were stopped if the series resis- tance (Rs) exceeded 35 MWor changed more than 20%. During postsynaptic voltage-clamp record- ings, Rs and whole-cell capacitance were monitored continuously. The experiment was discarded if the compensated Rs change reached 20% during recording.
Pharmacological experiments were carried out on NGFC-PC pairs using ACSF with the following drugs: 10 mM SR 95531 hydrobromide (Tocris), 10 mM D-(-) 2-amino-5-phosphonopentanoic acid (D-AP5) (Tocris), 10 mM 2,3-dioxo-6-nitro-1,2,3,4-tetrahydrobenzo[f]quinoxaline-7-sulfonamide (NBQX) (Tocris), 10 mM 4-(N-ethyl-N-phenylamino)-1,2 dimethyl-6-(methylamino)pyrimidinium chlo- ride (ZD7288) (Sigma-Aldrich), 10 mM 1-[2-[[(diphenylmethylene)imino]oxy]ethyl]-1,2,5,6-tetrahydro- 3-pyridinecarboxylic acid hydrochloride hydrochloride (NO711) (Sigma-Aldrich).
We performed BQA by altering the extracellular Ca2+ and Mg2+ in two different conditions (Bhumbra and Beato, 2013). One of the conditions was to provide consistently a high release prob- ability, in which the ACSF contained (in mM): 3 Ca2+/1.5 Mg2+. For the reduced release probability, we tested two different compositions (in mM): either 2 Ca2+/2 Mg2+ or 1.5 Ca2+/ 3 Mg2+. During BQA experiments, the ACSF solution contained the following substances: 10mM D-AP5 (Tocris), 10 mM NBQX (Tocris). Each epoch of the BQA experiment contains a stable segment of 28 up to 42 uni- tary IPSCs (mean 32.75±4.15). BQA experiments required at least 60 min of recording time (up to 90 min). We tested all epochs for possible long-term plasticity effect by measuring the linear correla- tion between IPSCs amplitude and elapsed time during the experiment, and we found no or negligi- ble correlation (Pearson’s r values from all of the experiments [n = 8] were between 0.39 and 0.46, mean 0.01±0.29).
The rise time of evoked IPSCs-Ps was determined as the time interval between the points corre- sponding to 10% and 90% of the peak amplitude, respectively. The peak current/voltage was deter- mined as the maximum within a window of 2 ms duration after the presynaptic AP. The decay time constant of IPSCs/Ps were measured at 67.3%. For measuring the linearity, we measured the differ- ence of calculated and experimentally recorded IPIS peak amplitudes from converging inputs.
Immunohistochemistry and anatomical analysis
After electrophysiological recordings, slices were fixed in a fixative containing 4% paraformaldehyde, 15% picric acid, and 1.25% glutaraldehyde in 0.1 M phosphate buffer (PB; pH = 7.4) at 4˚C for at least 12 hr. After several washes in 0.1 M PB, slices were cryoprotected in 10% then 20% sucrose solution in 0.1 M PB. Slices were frozen in liquid nitrogen then thawed in PB, embedded in 10% gel- atin, and further sectioned into slices of 60mm in thickness. Sections were incubated in a solution of conjugated avidin-biotin horseradish peroxidase (ABC; 1:100; Vector Labs) in Tris-buffered saline (TBS, pH = 7.4) at 4˚C overnight. The enzyme reaction was revealed by 3’3-diaminobenzidine tetra- hydrochloride (0.05%) as chromogen and 0.01% H2O2as an oxidant. Sections were post-fixed with 1% OsO4in 0.1 M PB. After several washes in distilled water, sections were stained in 1% uranyl ace- tate, dehydrated in ascending series of ethanol. Sections were infiltrated with epoxy resin (Durcupan [Sigma-Aldrich]) overnight and embedded on glass slices. 3D light microscopic reconstructions were carried out using Neurolucida system with a 100objective.
Surgery for imaging experiments
Experiments were conducted to the guidelines of University of Szeged Animal Care and Use Com- mittee. Young adult (22–28 days of age, (P) 24.75±2.75) male Wistar rats were initially anesthetized with halothane before urethane anesthesia (1.4 g/kg of body weight) was administrated
Research article Neuroscience
intraperitoneally. Body temperature was maintained at 37˚C with a heating pad (Supertech Instru- ments, Pe´cs, Hungary). Before surgery, dexamethasone sodium phosphate (2 mg/kg of body weight) was administrated subcutaneously, and carprofen (5 mg/kg of body weight) was administrated intra- peritoneally. Anesthetized animals’ head were stabilized in a stereotaxic frame and headbars were attached to the skull with dental cement (Sun Medical, Mariyama, Japan). Circular craniotomy (3 mm diameter) was made above the primary somatosensory cortex, centered at 1.5 mm posterior and 2.2 mm lateral from the bregma with a high-speed dental drill (Jinme Dental, Foshan, China). Dura mater was carefully removed surgically. Finally, the craniotomy was filled with 1.5% agarose and cov- ered with a coverslip to limit motion artifacts. The craniotomy was then submerged with HEPES buff- ered ACSF recording solution containing (in mM) 125 NaCl, 3.5 KCl, 10 HEPES, 1 MgSO4, 1 CaCl2, 0.5 D(+)-glucose, pH = 7.4.
Two-photon calcium imaging in L1
Before covering the craniotomy with the coverslip calcium indicator, Oregon Green 488 BAPTA-1 AM (10 mM) (OGB-1 AM, Thermo Fisher Scientific) and astrocytic marker sulforhodamine 101 (1mM) (SR101, Thermo Fisher Scientific) were pressure-injected with a glass pipette (1–2 MW) in L1 cortical region under the visual guide of Zeiss Axio Examiner LSM7 (Carl Zeiss AG, Oberkochen, Germany) two-photon microscope using 40water-immersion objective (W-Plan, Carl Zeiss, Germany). Subse- quently, the craniotomy was filled with agarose and covered with a coverslip. Imaging experiments were performed 1 hr after preparation. The activity of L1 interneurons was monitored during ipsilat- eral hindlimb electrical stimulation (Digimeter, Hertfordshire, UK, 200 mA, 10 ms). OGB-1 AM was excited at 800 nm wavelength with a femtosecond pulsing Ti:sapphire laser (Mai Tai DeepSee [Spec- tra-Physics, Santa Clara, CA]). In the somatosensory hindlimb region, Z-stack image series (volume size 304304104 mm3) were acquired. Calcium signals from interneurons were obtained within this volume in full-frame mode (256 100 pixel), acquired at a frequency of ~20 Hz. The Ca2+- dependent fluorescence change DF/F was calculated as R(t)=(F(t) F0(t))/F0(t) based on Jia et al., 2011. The R(t) denotes the relative change of fluorescence signal, F(t) denotes the mean fluores- cence of a region of interest at a certain time point, F0(t) denotes the time-dependent baseline. Cells were considered responsive if there was a measurableDF/F change (3 of the standard deviation of the noise) in the averaged trace of 10 trials to ipsilateral hindlimb stimulus. Image stabilization was performed by ImageJ (Fiji) software using the Image stabilizer plugin (Li, 2008; Schneider et al., 2012). At the end of the experiments, few L1 neurons were filled with biocytin containing intracellu- lar solution to make the immunohistochemical remapping easier.
Tissue preparation for immunohistochemistry
After imaging experiments, rats were deeply anesthetized with ketamine and xylazine. Subsequently, perfusion was performed through the aorta, first with 0.9% saline for 1 min, then with an ice-cold fix- ative containing 4% paraformaldehyde in 0.1 M PB (pH = 7.4) for 15 min. The whole brain was extracted and stored in 4% paraformaldehyde for 24 hr, afterward in 0.1 M PB (pH = 7.4) until slic- ing. Later 60-mm-thick sections were cut from the same two-photon Ca2+imaged brain area parallel to the pia mater and washed overnight in 0.1 M PB.
Fluorescence immunohistochemistry and remapping
After several washes in 0.1 M PB, slices were cryoprotected with 10%, then 20% sucrose solution in 0.1M PB than frozen in liquid nitrogen. The sections were incubated for 2 hr in Alexa-488 conjugated streptavidin (1:400, Molecular Probes) solved in TBS (0.1 M; pH = 7.4) at room temperature to visual- ize the biocytin labeled cells. After several washes in TBS, sections were blocked in normal horse serum (NHS, 10%) made up in TBS, followed by incubation in mouse anti-a-actinin (1:20,000, Sigma- Aldrich) diluted in TBS containing 2% NHS and 0.1% Triton X-100 at room temperature for 6 hr. Fol- lowing several washes in TBS, Cy3 conjugated donkey anti-mouse (1:500, Jackson ImmunoResearch) secondary antibody was used to visualize the immunoreactions. After several washes in TBS, then in 0.1 M PB, slices were counterstained with DAPI (40,6-diamidino-2-phenylindole, Thermo Fisher Scien- tific). Sections were then mounted on slides in Vectashield (Vector Laboratories). Images were taken with LSM 880 confocal laser scanning microscope (Carl Zeiss AG, Oberkochen, Germany) using 40 oil-immersion objective (1.4 NA). Confocal image z-stack was tilted and panned manually to match