Hidden religious aspects of job satisfaction and work attitudes: The differences between Eastern
and Western Europe
KAMILA FIALOV A
pand ANDREA BEL A NOV A
Institute of Sociology of the Czech Academy of Sciences, Jilska 1, 11000 Praha 1, Czech Republic
Received: February 8, 2019 • Revised manuscript received: April 16, 2019 • Accepted: June 23, 2019
© 2020 Akademiai Kiado, Budapest
ABSTRACT
This paper examines the links between religion and job satisfaction. Its concern is to compare Eastern and Western Europe. We use the 2015 International Social Survey Programme (ISSP) data covering both non- religious individuals and individuals affiliated to a religious denomination. While the Western European countries generally report significantly higher levels of job satisfaction compared to their Eastern coun- terparts, we test the hypothesis that religion also shows differentiated effects on job satisfaction and work attitudes. Our results indicate that religion has no significant effect on job satisfaction in either of the regions. In the West, religious affiliation has an influence on a larger variety of work attitude measurements compared to those in the East. In both regions, workers who regularly attend religious services would enjoy work significantly more even if they did not need money, consider high income as less important, and consider helping other people, contact with other people, and having a job useful to society as more important.
KEYWORDS
job satisfaction, religion, work attitudes, Eastern and Western Europe
JEL CLASSIFICATION INDICES J28, M14, Z12, O52
pCorresponding author. E-mail: kamila.fialova@soc.cas.cz
1. INTRODUCTION
This paper is concerned with the relation between religion and job satisfaction and work atti- tudes in the selected European countries. We use 2015 International Social Survey Programme (ISSP) Work Orientations module data that includes information on individuals’ religious affiliation and the frequency of attending religious services. Our study is based on a comparison of two groups: we apply the transition divide to split the European sample into subsamples of Eastern European countries (EE) and Western European countries (WE).1 For the sake of brevity, we refer to these two groups of countries hereafter as regions. We assume that the regions exhibit a certain level of cultural homogeneity that allows its analysis on an aggregate regional level.
Obviously, the two groups of countries differ substantially regarding their social and religious milieu. In the EE region, religious freedom was restored only after the fall of the communist regimes in the late 1980s and early 1990s. In most countries, institutionalized religion exhibited a sharp revival followed by a subsequent decrease or stabilization in religious participation later on (Burkimsher 2014). Of course, the post-communist countries were not homogeneous as regards the situation of religious organizations during the communist era and such differences have also remained after the transition (for details, see Minarik 2014a). Still, all of EE was affected by similar factors that may have had a long-lasting effect –the legacies of dictatorial communist regimes, the transition towards a market economy and democratic society, or different stages of economic development, for example.
Our decision to divide the European countries into two relatively homogeneous subgroups of European countries is also consistent with the modernization classification of nations as pro- posed byInglehart – Baker (2000). Also, in his research based on the data from three cross- national European surveys,Vecernık (2004)identified substantial differences in work and job values and job satisfaction between the Eastern and Western European countries. In corre- spondence with thesefindings, our research tests the persistence of such differences in regard to declared religiosity and its relation to work attitudes and, specifically, job satisfaction.
The relation between religion and economic attitudes and outcomes has been examined in several studies (for an overview, seeGuiso et al. 2003). Yet the main focus was on the US (e.g., Cash–Gray 2000), whereas the research on other countries, and specifically Europe, is much less (see e.g., Minarik 2014a, 2014b; Fargher et al. 2008). Similarly, the link between subjective well-being, life satisfaction and religion has also been researched, but only a few studies are concerned specifically with job satisfaction (Ghazawi et al. 2006; Guiso et al. 2003; Yeganeh 2015). Several studies show that job satisfaction is positively related to job performance (see e.g., Judge et al. 2001) and extent of organizational trust (Lange 2015), making this issue highly relevant for thefields of human resources and management as well.
Borooah (2009) examined the differences in job satisfaction between the Eastern and Western European countries and found that workers in the latter region generally exhibit higher
1We also maintain the transition divide regarding the division of Germany into East and West. For the purpose of this paper, we consider the following 12 countries in the WE group: Austria, Belgium, Denmark, Finland, France, former Western Germany, Spain, Sweden, and the United Kingdom; we also counted non-EU Switzerland, Iceland and Norway to include more data. The EE group includes the following 10 countries, which acceded to the EU after 2004: Croatia, Czech Republic, former Eastern Germany, Estonia, Hungary, Latvia, Lithuania, Poland, Slovakia, and Slovenia.
594 Acta Oeconomica70 (2020) 4, 593–613
levels of job satisfaction.Mysıkova–Vecernık (2013)confirm the existence of significant dif- ferences in job satisfaction and its determinants between EE and WE. Minarik (2014b)con- cludes that the role of religion tends to be a less significant driver of general economic attitudes in the European post-communist countries and ascribes this result to the specific conditions of religion under the communist regimes. Similarly,Mojsoska-Blazevski et al. (2015)also identified significant differences between the Central and EE and WE countries in the relative effect of specific cultural values on job satisfaction.
We formulated our hypothesis on the conclusions of Fargher et al. (2008): broad cultural heritage strongly influences the well-being of individuals at work. As to the distinctions in certain regions, the authors argue that “the main difference between Eastern and Western Europe is driven primarily by the importance of family and religion”(ibid. 630). Therefore, our hypothesis is that religion is a significant factor determining the job satisfaction and work at- titudes in both WE and EE. At the same time, we hypothesize that the magnitude of the effect is larger in WE compared to EE due to different historical background that determined the po- sition of religion in society during the communist era.
2. THEORETICAL FRAMEWORK
Several works emphasize the positive correlation between religion and personal life satisfaction and happiness (see e.g.,Malesevic-Perovic et al. 2011; Frey–Stutzer 2002). There is also a likely positive relationship between religion and ethical attitudes in the workplace and in business, as Ghazzawi et al. (2016)sum up; religion is considered to provide an important motivation to act ethically, based on shared values. In contrast to general spiritual commitment (see e.g.,Cash– Gray 2000), the research on commitment to institutionalized religion and its effect on work attitudes and job satisfaction has been rather limited so far.
Guiso et al. (2003)examined the World Values Survey (WVS) data and concluded that, on average, religious beliefs tend to be associated with economic attitudes conductive to economic growth and higher per capita income. In a cross-national study based on WVS data,Yeganeh (2015)found that religiosity positively influences the preference for extrinsic work orientation and has a quadratic association with intrinsic orientation. In this regard, other research seems to suggest that religion may also positively affect job satisfaction as one of the work attitudes (e.g., Ghazzawi et al. 2016).
Like overall life satisfaction, job satisfaction is a complex and multidimensional phenomenon that may be understood as a result of several factors of influence. Generally, four factor groups are considered to affect job satisfaction (Ghazzawi et al. 2016): (1) the character of the job itself;
(2) the general life satisfaction of an individual; (3) individual characteristics, values and per- sonality; and (4) the social factors that come in play. As suggested byGhazzawi–Smith (2009), religion may positively impact worker satisfaction by influencing the three latter groups of the four listed.Ghazzawi et al. (2016)also analyzed the relationship between religious faith and job satisfaction on the Californian individual data and show that in this case the religious commitment does positively impact job satisfaction.Fargher et al. (2008)analyzed the differ- ences in impact of basic cultural values and beliefs on job satisfaction in the Eastern and Western European Union countries using the European Values Study (EVS) data from 1999/
2000. The results show a significant and strong relationship between several basic cultural
values, including religion and job satisfaction in WE. In contrast, the satisfaction of workers in EE was generally not significantly affected by cultural values and beliefs, including religion. The authors attribute the main difference in factors that may predict job satisfaction in EE and WE primarily to the importance of family/friends and religion, which have significant effects in WE but not in EE (Fargher et al. 2008).
Furthermore,Frey–Stutzer (2002)point out that the relation between religion and general life satisfaction may be affected by differences in particular religions.Ghazzawi et al. (2016)also note that the impact of religion on job satisfaction varies according to the type of religion.
Moreover,Guiso et al. (2003)show that not only the correlations they examined differ across religious denominations, with Christian religions generally showing a more positive association, but they also depend on the dominant religious denomination in each country. Similarly, Minarik (2014b)found out that the economic attitudes in relation to religion differ when taking into account the dominant religion of a particular country. Opposing these conclusions, Yeganeh (2015)claims that the dominant religious denomination of a country does not have a significant effect in his analyses.
Obviously, many more factors may play a role when considering the relation of religiosity, work attitudes and life satisfaction, either directly or indirectly (Ghazzawi 2016; Guiso et al.
2003). More specifically, the most important common determinants include gender, age, educational level and income. For instance, several researchers found that women tend to be more religiously committed than men (Hamplova 2011). Also, most scholars point out that women are generally more satisfied at work than men (Bender et al. 2005; Clark 1997; Sanchez- Sanchez and Fernandez Puente 2019). Regarding the effect of age, religious faith tends to fluctuate throughout the life of an individual without a clear pattern (Worthington et al. 2003).
The results of literature analyzing age as a factor determining job satisfaction are inconclusive (see e.g.,Borooah 2009; Clark et al. 1996). The effect of education on job satisfaction is not clear in the literature.Vila–Garcıa-Mora (2005)find that education level had no significant influence on overall job satisfaction, but at the same time it correlates positively with satisfaction in various aspects of a job.Clark–Oswald (1996), conversely, show an opposite, negative effect of education on worker satisfaction. In addition, education level may also affect both the degree of religiosity of an individual and also the type of religiosity (Hamplova 2013). The effect of income on job satisfaction, meanwhile, has been widely researched without any clear consensus. The effect may differ when we consider objective or subjective income level (Clark–Oswald 1996), or the absolute level of income or its growth (Dragota et al. 2018). As addressed byGuiso et al.
(2003), including variables of income may underestimate the effect of religion since religiosity may positively impact this individual characteristic.
3. METHODOLOGY AND DATA
We use the 2015 ISSP Work Orientations module data. The relatively small country sample sizes limit the possibility of analyzing the data at the national level. Therefore, we group the obser- vations into two subsamples and proceed with the analysis at an“all-country”level. To analyze the work attitudes, we limit the samples to respondents aged 20–65, who were working for pay during the time of the survey and who declared their religious affiliation; we exclude the missing observations. This leaves us with 5,717 respondents in the EE group and 9,389 respondents in the WE group.
596 Acta Oeconomica70 (2020) 4, 593–613
Our research design is exploratory in nature. Due to the ordinal nature of job satisfaction and work attitude variables and in line with the previous research in this area, we apply an ordered probit regression model with robust standard errors to estimate the effect of religion (Lange 2010; Fargher et al. 2008). Formally, our model assumes that a latent and continuous measure of the explained dependent variableZi*, which may be interpreted as a proxy for the unobserved level of utility, follows the normal distribution.Zi*is characterized by:
Zi*¼aþbRDiþgARSiþqXiþpCþ«i (1) where dependent variable Zi takes the form of the job satisfaction variable and variables describing work values and attitudes of an individual in consecutive models. VariableRDi re- flects the declared religious affiliation of an individual;ARSiis the variable reflecting the religious service attendance by an individual;Xirepresents the vector of control variables reflecting the characteristics of individual respondents and their current jobs (see later); and Care country dummies. Finally,«irepresents a random error term.
The estimation is made separately for EE and WE since the results for these two regions differ substantially in previous research. To verify the differences between these two regions in a choice model, we employ the likelihood ratio test (Greene–Hensher 2010). The results of the test confirmed the existence of significant differences between the EE and WE for all the dependent variables (see later).2 Consequently, we examine the two regions separately. We include country dummies to eliminate the impact of specific cultural, social, economic, and institutional conditions of each country. The shortcoming of our approach lies in the potential underestimation of the effect of religion since it may be partly absorbed in the national culture.
Another potential limitation of our results lies in the potential presence of a latent variable that affects both religious attitudes and job satisfaction. Also, the results are limited to the extent of defining religiosity by religious affiliation and attendance of religious services as these two categories are declaratory. From this perspective, our results should be interpreted as correla- tions rather than causal effects.
We define job satisfaction as an individual’s positive or negative attitude toward her or his job (Brayfield–Crockett 1955). We use the ISSP job satisfaction variable that reports the answer to the question,“All things considered, how satisfied are you with your (main) job?”Since the original ISSP variable takes a value of 1 for “completely satisfied” and 7 for “completely dissatisfied,”we reverse the scale so that the variable increases with higher levels of satisfaction.
The nature of our data enables analysis of job satisfaction as a single item reflecting overall job satisfaction, without a possibility to reflect the individual components of job satisfaction. Still, following the results of meta-analyses carried out by Wanous et al. (1997), the single-item measure of overall job satisfaction is acceptable for the examination of worker satisfaction.
In a similar vein, we further analyze the work attitudes of respondents by utilizing several variables from the ISSP dataset that reports answers to the following questions:3
“I would enjoy having a paid job even if I did not need the money”. The variable takes values from 1 for“strongly disagree”to 5 for“strongly agree”.
2The results of the test are available from the authors upon request.
3The original ISSP scale was reversed so that the variables increase with stronger agreement.
“For each of the following, please tick one box to show how important you personally think it is in a job. How important is
job security?
high income?
good opportunities for advancement?
an interesting job?
a job that allows someone to work independently?
a job that allows someone to help other people?
a job that is useful to society?
a job that allows someone to decide their times or days of work?
a job that involves personal contact with other people?”
All these variables take value from 1 for“not important at all”to 5 for“very important”. Our data provide us with the information on the membership of individuals in several groups of declared religious affiliations and also on the frequency of religious service attendance.
Religious affiliation is determined according to the answers to the question,“Do you belong to a religion? And, if yes, which religion do you belong to?”Due to the small number of observations for several religions, not allowing a separate detailed analysis of these religious groups, we considered only the following possibilities: Catholic, Protestant, Eastern Orthodox, Other Christian, and a heterogeneous “Other” group covering all other religions (Buddhist, Hindu, Islamic, Jewish, and other religions). We compare individuals covered by these religious groups with individuals who declared no religious affiliation. None of the religious groups represent a unified system of beliefs; there is a large degree of heterogeneity within each group. Still, we believe that there is a larger heterogeneity between the religious groups compared to hetero- geneity within each of them.
The variable on religious service attendance comes from answers to the following question,
“Apart from such special occasions as weddings, funerals, etc., how often do you attend religious services?”We classify actively religious individuals as those who attend religious services at least two or three times a month and currently religious individuals as those who attend religious services at least once a year but less than two or three times a month. Religious affiliations differ as regards the extent of church attendance that they prescribe to their members. In line with previous research on this topic, we use this variable mainly as a proxy for the dimension of religiosity.4
We also cover several variables reflecting the characteristics of the current jobs of workers.
More specifically, we use dummies that take the value of 1 for agreement with the following statements (ISSP category 1 –strongly agree, and category 2 – agree): my job is secure; my income is high; my opportunities for advancement are high; I can work independently; my job is interesting; in my job I can help other people; my job is useful to society; and in my job, I have personal contact with other people. The other set of dummies takes the value 1 when the following situations apply often in the current jobs of workers (ISSP category 1–always, and
4We are aware that the category of religiosity is much richer than declared affiliation and the frequency of religious service attendance. The aspects of religiosity not covered by this research, such as personal faith and commitment, could be examined by future qualitative studies.
598 Acta Oeconomica70 (2020) 4, 593–613
category 2–often): do hard physical work; find work stressful; and demands of the job interfere with one’s family life.
We control both for the individual characteristics of the respondents and the characteristics of their jobs. The control variables include gender, age (dummies for age intervals 20–25, 26–35, 46–55, and 55–65), education (number of years of education), the presence of children in the household (number of children), a dummy for membership in a specific income quartile, a dummy for being an employee, a dummy for being employed in a public organization, a dummy for trade union membership, and the degree of urbanization of the place of living (dummies for living in a big city and in the countryside).
Following the research ofGuiso et al. (2003), Minarik (2014b), and Yeaganeh (2014), we also consider the role of the position of religion in the society and distinguish the effect of religiosity itself from the effect of adhering to a religion that is dominant in a country. The dominant religion may become a part of the national culture and subject to intergenerational transmission mainly as a means of habit rather than because of a deep conviction. That means participating in the country’s dominant religion might mean a very different experience from participating in a minority religion. We therefore add separate controls for the effect of being affiliated with the dominant religion.5
4. EMPLOYMENT, JOB SATISFACTION, AND RELIGIOUS AFFILIATIONS
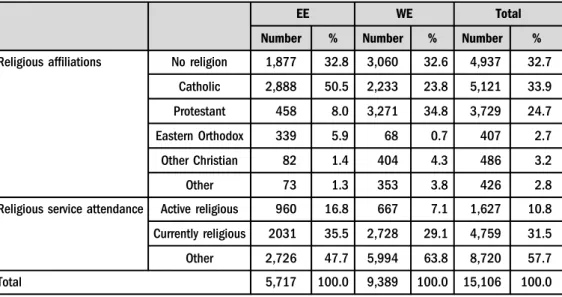
Table 1 shows the sample frequencies across religious affiliations and religious service atten- dance in the two analyzed regions. Apparently, the EE sample is predominantly Catholic 51%
per cent of the working population claim Catholic affiliation. The share of those who claim no religion is 33%, which is similar to the WE group. Protestants and Eastern Orthodox affiliations both have a substantially lower share (8 and 6%, respectively) while the share of Other Chris- tians and Other is marginal (around 1%). In contrast, the WE sample is more evenly distributed across the three largest religious categories–Catholic (24%), Protestant (35%) and No religion (33%). The share of Other Christians and Other is lower, both around 4%; the share of Eastern Orthodox affiliation is 1%. Furthermore, the EE region exhibits a larger share of the working population that attend religious services compared with the WE group– both in the active religious category (17 and 7%, respectively) and the currently religious category (36 and 29%, respectively).6
The job satisfaction of workers in both regions according to religious affiliation is presented in Table 2. In general, workers in WE are more satisfied with their job compared to their counterparts in EE; average job satisfaction in these regions reached 5.4 and 5.2 respectively– the difference is statistically significant at the 1% level. In both regions, Protestant affiliation is related to higher job satisfaction, while Eastern Orthodox and Other Christian affiliation brings about lower job satisfaction. In WE, no religious affiliation is connected with lower job satis- faction and the opposite holds for Catholic affiliation in this region. In this respect, the share of
5The dominant religion in each country is defined as that with the highest number of affiliates according to the data from Pew-Templeton Global Religious Futures Project (2010).
6Results on correlations between groups of religious affiliations and religious service attendance, structure of the sample according to economic activity, employment status and religious affiliations are available from the authors upon request.
Table 1.Structure of the sample according to religious affiliations and religious service attendance in EE and WE
EE WE Total
Number % Number % Number %
Religious affiliations No religion 1,877 32.8 3,060 32.6 4,937 32.7
Catholic 2,888 50.5 2,233 23.8 5,121 33.9
Protestant 458 8.0 3,271 34.8 3,729 24.7
Eastern Orthodox 339 5.9 68 0.7 407 2.7
Other Christian 82 1.4 404 4.3 486 3.2
Other 73 1.3 353 3.8 426 2.8
Religious service attendance Active religious 960 16.8 667 7.1 1,627 10.8 Currently religious 2031 35.5 2,728 29.1 4,759 31.5
Other 2,726 47.7 5,994 63.8 8,720 57.7
Total 5,717 100.0 9,389 100.0 15,106 100.0
Source:ISSP, own computations.
Table 2. Job satisfaction according to religious affiliation (mean values and coefficients of variation within regions)
Mean
Coefficient of variation (%)
% highly satisfied (cat. 6 þ7)
EE WE Total EE WE Total EE WE Total
No religion 5.2* 5.3* 5.3 21.9 21.5 21.7 35.9 45.6 41.9
Catholic 5.2* 5.5* 5.3 21.6 19.5 20.9 34.1 53.4 42.5
Protestant 5.4 5.5 5.5 17.8 19.1 19.0 39.4 52.3 50.7
Eastern Orthodox 5.1 5.3 5.2 22.5 24.4 22.8 31.0 43.9 33.2
Other Christian 4.9* 5.3* 5.2 26.2 18.6 20.1 25.0 45.7 42.3
Other 5.0* 5.4* 5.3 22.3 23.2 23.2 32.9 49.4 46.5
Total 5.2* 5.4* 5.3 21.6 20.2 20.8 34.8 49.9 44.2
Source:ISSP, own computations.
Note: Job satisfaction measure is defined in the text. We reverse the original ISSP scale so that the variable increases with higher satisfaction. For number of observations in each group seeTable 1. Total number of observations is 5,717 in EE and 9,389 in WE. The differences between EE and WE mean values are significant at the 5% level marked as *.
600 Acta Oeconomica70 (2020) 4, 593–613
workers with Catholic affiliation who declared high satisfaction with their job (ISSP category 6 and 7) is substantially higher in WE than in EE, which makes the difference in job satisfaction between the two regions very high in this religious group (and again, statistically significant at the 1% level). A comparably high difference was registered in the heterogeneous category Other, which is, however, hard to evaluate due to the inclusion of a variety of different religious groups.
The variability of job satisfaction is in total somewhat greater in EE and in each of the religious affiliations with the exception of the Protestant, Eastern Orthodox, and Other categories.
Substantially large differences in the variability of job satisfaction were registered in Other Christian affiliation (26.2% in EE vs 18.6% in WE). Catholic affiliation is characterized by a larger degree of variability in the EE region compared to WE (the coefficient of variation stood at 21.6% in EE compared to 19.5% in WE).
There may exist various factors that cause the differences in job satisfaction between the two regions and according to religious affiliation (differences in income, age structure of workers, etc.). To control for the effect of other variables, we employ the regression estimation.
5. RESULTS AND DISCUSSION
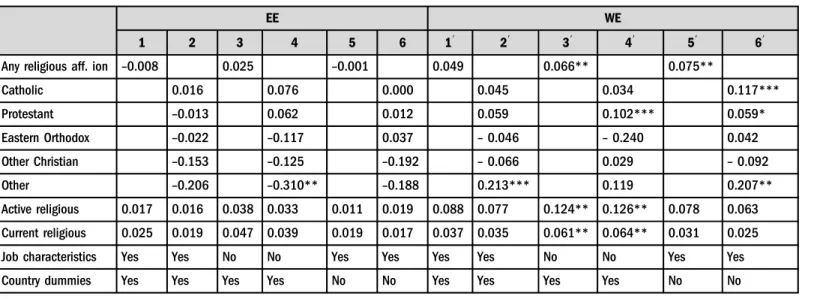
The results of the ordered probit regression estimation of the effect of religiosity on job satis- faction are given in Table 3. The table offers several model estimations that differ in the specification of religious affiliation that is either structured according to particular religious affiliations or aggregated into two categories: “Any religious affiliation” and “No religious affiliation”(reference variable). Further, the specifications also differ in regard to the inclusion of country dummies and variables relating to the characteristics of workers’current jobs.
The results unanimously show no significant effect of any of the religious variables on job satisfaction in the EE region. The only significant negative coefficient for the Other category is significant only in the specification that does not take into account the job characteristics (col.
4); once these are included, however, the significance disappears (col. 2). A similar effect after the inclusion of job characteristics was registered in the WE group. The significant positive effect of affiliation in any religion on job satisfaction was registered in two model specifications (30and 50), but it disappears after both country dummies and job characteristics are included; ulti- mately, only one significant positive effect lasts in the category Other (col. 20).7Analogically, the significant positive relation between religious service attendance and job satisfaction was only recorded in a specification that does not cover job characteristics. We may speculate that it is not the religiosity and religious affiliation themselves that affect job satisfaction but rather the characteristics of the job, which may have a different distribution across different religious groups, as well as specific features of each country that relate to variability in job satisfaction. To
7We tested the relation between job satisfaction and EE/WE residence also by running separate regressions for those respondents who declared themselves Catholic and those who declared Protestant affiliations and added an EE/WE dummy (due to lack of data we could not yield relevant results for other affiliations). Residing in the East or West is for neither Catholics nor Protestants a significant factor influencing their level of job satisfaction (the results are available from the authors upon request). Apparently, the relation between religiosity and job satisfaction has a more complex pattern both in the EE and WE.
Table 3. Regression estimation results: Job satisfaction
EE WE
1 2 3 4 5 6 19 29 39 49 59 69
Any religious aff. ion –0.008 0.025 –0.001 0.049 0.066** 0.075**
Catholic 0.016 0.076 0.000 0.045 0.034 0.117***
Protestant –0.013 0.062 0.012 0.059 0.102*** 0.059*
Eastern Orthodox –0.022 –0.117 0.037 –0.046 –0.240 0.042
Other Christian –0.153 –0.125 –0.192 –0.066 0.029 –0.092
Other –0.206 –0.310** –0.188 0.213*** 0.119 0.207**
Active religious 0.017 0.016 0.038 0.033 0.011 0.019 0.088 0.077 0.124** 0.126** 0.078 0.063
Current religious 0.025 0.019 0.047 0.039 0.019 0.017 0.037 0.035 0.061** 0.064** 0.031 0.025
Job characteristics Yes Yes No No Yes Yes Yes Yes No No Yes Yes
Country dummies Yes Yes Yes Yes No No Yes Yes Yes Yes No No
Source:ISSP, own computations.
Note:Coefficients are obtained by an ordered probit estimation with robust standard errors.
The dependent variable is job satisfaction and is defined in the text. We reverse the original ISSP scale so that the variable increases with higher satisfaction.
An exact definition of the reported independent variables is given in the text. All regressions also include controls for gender, age, education, the presence of children in the household, membership in a specific income quartile, being an employee, being employed in a public organization, trade union membership, and the degree of urbanization of the place of living (coefficients are not reported in the table). Furthermore, several specifications include country dummies and job characteristics as reported in the table.
*Statistically significant at 10%, ** 5%, *** 1% level, respectively.
602ActaOeconomica70(2020)4,593–613
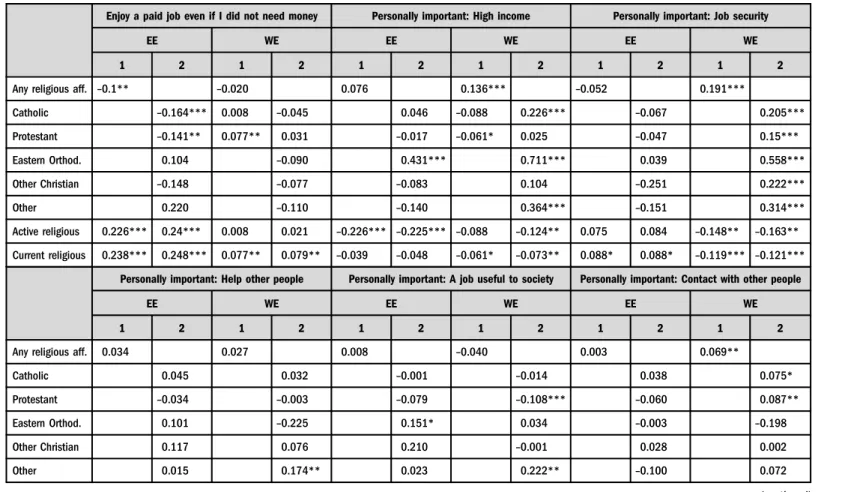
further explore this relation, we regress several measures of work attitudes of individuals on the same set of independent and control variables. The results are presented inTable 4.
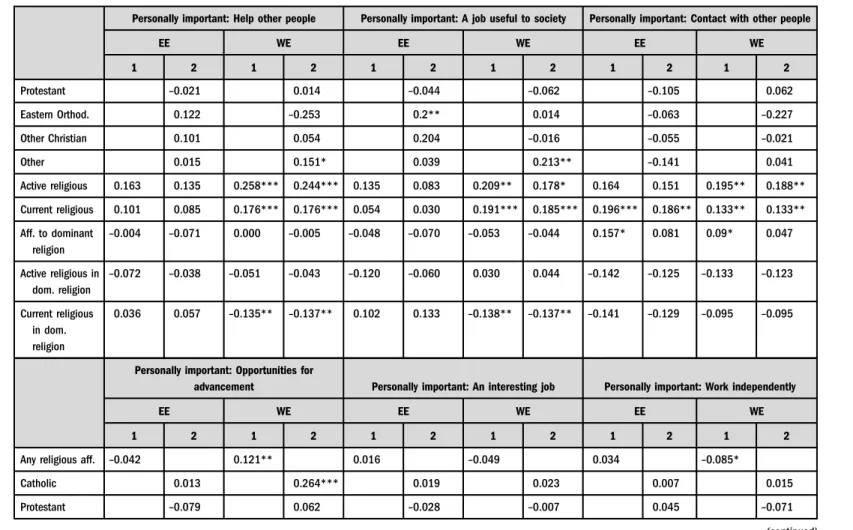
The results show several significant relationships between religiosity, religious affiliation, and the majority of work attitude variables (the only exception, where no significant effect was uncovered in both regions, is“Importance of having an interesting job”). In most cases, different results were obtained in the EE and WE regions, which confirms the differences previously indicated by the likelihood ratio tests. Furthermore, the significant results for a given dependent variable mostly differ in sign between the set of religious affiliation variables and the variables on religious service attendance. This indicates that these two variables refer to very different aspects of religiosity: Often the people that attend religious services tend to have opposite work attitudes compared to people who proclaim a religious affiliation. It may be suggested that two detached forms of religiosity are referred to here. The first represents the more traditional religiosity, based on regular religious service attendance and less interest in theology. The second, un- derstood as a declarative expression of inner faith, is more in accordance with increasing individualism in modern societies.
As concerns the particular work attitudes, the variable“I would enjoy a paid job even if I did not need money”has a significant relationship to religiosity in the EE region and partly in the WE as well. The significant negative effect of affiliation to any religion is mainly driven by the fact that Catholics and Protestants mostly tend to show lesser agreement with working regardless of pecuniary remuneration (compared to those unaffiliated with any religion that serve as a reference group). In contrast, both groups of individuals that attend religious services (active and current) tend to exhibit higher agreement with this statement in EE, while in WE this only holds for those who are currently religious. Also, Protestant affiliation in WE tends to be connected to a higher level of agreement with working regardless of pecuniary remuneration.
Another variable that refers to the importance of pecuniary remuneration is the“Importance of high income in the job”. In EE, the actively religious individuals tend to have a lower level of agreement with the importance of this aspect of their job, in contrast to Eastern Orthodox affiliation which tends to agree more. The positive coefficient in the Eastern Orthodox group is similar to that of the WE region, where both Catholic affiliation and affiliation in the Other category also have positive effects on agreement with importance of income. Consequently, the general category Any religious affiliation shows higher agreement with the importance of in- come in WE. In contrast, religious service attendance has a negative effect in this region. A very similar relationship pattern was recorded in the WE region for the variable “Importance of opportunities for advancement”, where a significant positive effect on agreement prevails in the categories Any religious affiliation, Catholic, Eastern Orthodox, and Other, while a negative, weak significant effect appears for active religious individuals. The EE region shows no signif- icant relationships under this variable. Another variable that does not significantly relate to religiosity in our estimates on the EE region is “Importance of job security”. Apparently, the perception concerning the importance of job security has no relationship to religious affiliation or religious service attendance in this region. A very different opposing picture prevails in the WE group, where all the variables on religious affiliation have significant positive effects on the perception of the importance of job security and both indicators on religious service attendance have significant negative effects.
Three work attitude variables have a very limited connection to religiosity in EE:“Impor- tance of contact with other people,” “Importance of helping other people in one’s job,” and
Table 4.Regression estimation results: Work attitudes
Enjoy a paid job even if I did not need money Personally important: High income Personally important: Job security
EE WE EE WE EE WE
1 2 1 2 1 2 1 2 1 2 1 2
Any religious aff. –0.1** –0.020 0.076 0.136*** –0.052 0.191***
Catholic –0.164*** 0.008 –0.045 0.046 –0.088 0.226*** –0.067 0.205***
Protestant –0.141** 0.077** 0.031 –0.017 –0.061* 0.025 –0.047 0.15***
Eastern Orthod. 0.104 –0.090 0.431*** 0.711*** 0.039 0.558***
Other Christian –0.148 –0.077 –0.083 0.104 –0.251 0.222***
Other 0.220 –0.110 –0.140 0.364*** –0.151 0.314***
Active religious 0.226*** 0.24*** 0.008 0.021 –0.226*** –0.225*** –0.088 –0.124** 0.075 0.084 –0.148** –0.163**
Current religious 0.238*** 0.248*** 0.077** 0.079** –0.039 –0.048 –0.061* –0.073** 0.088* 0.088* –0.119*** –0.121***
Personally important: Help other people Personally important: A job useful to society Personally important: Contact with other people
EE WE EE WE EE WE
1 2 1 2 1 2 1 2 1 2 1 2
Any religious aff. 0.034 0.027 0.008 –0.040 0.003 0.069**
Catholic 0.045 0.032 –0.001 –0.014 0.038 0.075*
Protestant –0.034 –0.003 –0.079 –0.108*** –0.060 0.087**
Eastern Orthod. 0.101 –0.225 0.151* 0.034 –0.003 –0.198
Other Christian 0.117 0.076 0.210 –0.001 0.028 0.002
Other 0.015 0.174** 0.023 0.222** –0.100 0.072
(continued)
604ActaOeconomica70(2020)4,593–613
EE WE EE WE EE WE
1 2 1 2 1 2 1 2 1 2 1 2
Active religious 0.109* 0.099 0.235*** 0.223*** 0.037 0.026 0.237*** 0.208*** 0.082 0.070 0.113* 0.117*
Current religious 0.126*** 0.121** 0.09*** 0.09*** 0.12** 0.115** 0.102*** 0.098*** 0.113** 0.106** 0.074** 0.074**
Personally important: Opportunities for
advancement Personally important: An interesting job Personally important: Work independently
EE WE EE WE EE WE
1 2 1 2 1 2 1 2 1 2 1 2
Any religious aff. 0.034 0.098*** 0.069 –0.050 0.096* –0.044
Catholic 0.070 0.191*** 0.081 –0.039 0.141** –0.006
Protestant –0.053 0.007 0.006 –0.051 0.044 –0.075*
Eastern Orthod. 0.120 0.52*** 0.060 –0.145 0.019 –0.47***
Other Christian –0.061 0.023 0.185 –0.088 0.208 –0.032
Other –0.233 0.282*** 0.282 –0.023 0.041 –0.008
Active religious –0.077 –0.088 –0.109* –0.139** –0.098 –0.108 –0.086 –0.087 –0.222*** –0.238*** –0.085 –0.088 Current religious 0.079* 0.067 0.008 –0.002 0.004 0.004 –0.065* –0.066* –0.09** –0.097** –0.036 –0.037
Source:ISSP, own computations.
Note:All panels report coefficients obtained by an ordered probit estimation with robust standard errors.
The dependent variable in each estimation is indicated at the top of the respective columns and is defined in the text. We reverse the original ISSP scale so that the variables increase with higher levels of agreement with the statement. An exact definition of the reported independent variables is given in the text. All regressions also include controls for gender, age, education, the presence of children in the household, membership in a specific income quartile, being an employee, being employed in a public organization, trade union membership, and the degree of urbanization of the place of living (coefficients not reported in the table). Country dummies and job characteristics are included.
*Statistically significant at 10%, ** 5%, *** 1% level, respectively.
mica70(2020)4,593–613605
Table 5. Regression estimation results: Job satisfaction and the role of the dominant religion
EE WE
1 2 3 4 5 6 19 29 39 49 59 69
Any religious affiliation –0.036 –0.021 0.019 0.054 0.074 0.027
Catholic 0.036 0.039 0.128 0.025 0.001 0.042
Protestant –0.030 0.053 0.004 0.053 0.088 0.004
Eastern Orthodox –0.040 –0.132 0.026 –0.022 –0.215 0.065
Other Christian –0.166 –0.143 –0.184 –0.046 0.05 –0.074
Other –0.220 –0.317** –0.191 0.241*** 0.152* 0.231***
Active religious –0.020 0.004 0.024 0.061 –0.047 –0.01 0.031 0.004 0.019 0.014 0.042 0.008
Current religious 0.062 0.055 0.052 0.054 0.049 0.041 –0.007 –0.011 0.029 0.033 –0.014 –0.021 Affiliated in dominant religion 0.056 –0.030 0.122 0.059 –0.039 –0.15 –0.017 –0.001 –0.017 0.013 0.053 0.057 Active religious in dominant religion 0.039 0.014 –0.003 –0.045 0.087 0.05 0.103 0.133 0.189* 0.204* 0.093 0.117 Current religious in dominant religion –0.061 –0.054 –0.019 –0.026 –0.04 –0.031 0.070 0.073 0.052 0.052 0.072 0.076
Job characteristics Yes Yes No No Yes Yes Yes Yes No No Yes Yes
Country dummies Yes Yes Yes Yes No No Yes Yes Yes Yes No No
Source:ISSP, own computations.
Note:Table 5reports coefficients obtained by an ordered probit estimation with robust standard errors. The dependent variable is job satisfaction and is defined in the text. We reverse the original ISSP scale so that the variables increase with higher levels of satisfaction. All regressions also include controls for gender, age, education, presence of children in the household, membership in a specific income quartile, being an employee, being employed in a public organization, trade union membership, and the degree of urbanization of the place of living (coefficients not reported in the table). Furthermore, several specifications include country dummies and job characteristics as reported in the table.“Affiliated to dominant religion”is an indicator variable equal to one if the respondent declared a religious affiliation that is similar to the religious denomination dominant in his/her country.“Active religious in dominant religion” is an indicator variable equal to one if“Active religious”is equal to one and the respondent belongs to the religious denomination dominant in his/her country.
“Current religious in dominant religion”is an indicator variable equal to one if“Current religious”is equal to one and the respondent belongs to the religious denomination dominant in his/her country.
*Statistically significant at 10%, ** 5%, *** 1% level, respectively.
606ActaOeconomica70(2020)4,593–613
Enjoy a paid job even if I did not need money Personally important: High income Personally important: Job security
EE WE EE WE EE WE
1 2 1 2 1 2 1 2 1 2 1 2
Any religious aff. –0.024 –0.030 0.084 0.205*** –0.018 0.207***
Catholic –0.051 –0.031 0.075 0.331*** –0.078 0.145*
Protestant –0.121 0.044 –0.002 0.11* –0.003 0.109
Eastern Orthod. 0.139 –0.085 0.452*** 0.746*** 0.089 0.552**
Other Christian –0.117 –0.072 –0.018 0.13* –0.166 0.222***
Other 0.232 –0.096 –0.119 0.408*** –0.107 0.319***
Active religious 0.178 0.183 –0.049 –0.043 –0.321*** –0.32** –0.209** –0.251*** –0.016 0.019 –0.222** –0.229**
Current religious 0.216*** 0.212*** 0.087* 0.089* –0.019 –0.062 –0.094* –0.111** 0.015 0.012 –0.078 –0.081 Aff. to dominant
religion
–0.186** –0.176 0.017 –0.015 –0.023 –0.050 –0.105* –0.125* –0.041 0.013 –0.013 0.067
Active religious in dom. religion
0.099 0.097 0.108 0.112 0.132 0.136 0.198 0.21* 0.136 0.098 0.131 0.130
Current religious in dom.
religion
0.051 0.063 –0.017 –0.016 –0.026 0.025 0.056 0.062 0.117 0.120 –0.064 –0.064
Personally important: Help other people Personally important: A job useful to society Personally important: Contact with other people
EE WE EE WE EE WE
1 2 1 2 1 2 1 2 1 2 1 2
Any religious aff. 0.039 0.041 0.036 0.011 –0.076 0.014
Catholic 0.092 0.068 0.045 0.058 –0.011 0.052
(continued)
mica70(2020)4,593–613607
Personally important: Help other people Personally important: A job useful to society Personally important: Contact with other people
EE WE EE WE EE WE
1 2 1 2 1 2 1 2 1 2 1 2
Protestant –0.021 0.014 –0.044 –0.062 –0.105 0.062
Eastern Orthod. 0.122 –0.253 0.2** 0.014 –0.063 –0.227
Other Christian 0.101 0.054 0.204 –0.016 –0.055 –0.021
Other 0.015 0.151* 0.039 0.213** –0.141 0.041
Active religious 0.163 0.135 0.258*** 0.244*** 0.135 0.083 0.209** 0.178* 0.164 0.151 0.195** 0.188**
Current religious 0.101 0.085 0.176*** 0.176*** 0.054 0.030 0.191*** 0.185*** 0.196*** 0.186** 0.133** 0.133**
Aff. to dominant religion
–0.004 –0.071 0.000 –0.005 –0.048 –0.070 –0.053 –0.044 0.157* 0.081 0.09* 0.047
Active religious in dom. religion
–0.072 –0.038 –0.051 –0.043 –0.120 –0.060 0.030 0.044 –0.142 –0.125 –0.133 –0.123
Current religious in dom.
religion
0.036 0.057 –0.135** –0.137** 0.102 0.133 –0.138** –0.137** –0.141 –0.129 –0.095 –0.095
Personally important: Opportunities for
advancement Personally important: An interesting job Personally important: Work independently
EE WE EE WE EE WE
1 2 1 2 1 2 1 2 1 2 1 2
Any religious aff. –0.042 0.121** 0.016 –0.049 0.034 –0.085*
Catholic 0.013 0.264*** 0.019 0.023 0.007 0.015
Protestant –0.079 0.062 –0.028 –0.007 0.045 –0.071
(continued)
Table 6. Continued 608ActaOeconomica70(2020)4,593–613
advancement Personally important: An interesting job Personally important: Work independently
EE WE EE WE EE WE
1 2 1 2 1 2 1 2 1 2 1 2
Eastern Orthod. 0.082 0.532*** 0.012 –0.157 0.005 –0.502***
Other Christian –0.079 0.033 0.125 –0.098 0.240 –0.058
Other –0.249 0.304*** 0.252 –0.017 0.057 –0.046
Active religious –0.078 –0.083 –0.177* –0.219** –0.010 –0.043 –0.175* –0.187* –0.207* –0.247* 0.039 0.029
Current religious 0.147* 0.122 0.017 0.002 0.064 0.067 0.039 0.036 –0.088 –0.089 0.011 0.011
Aff. to dominant religion
0.167* 0.090 –0.030 –0.076 0.098 0.099 0.021 –0.037 0.166* 0.206* 0.067 0.005
Active religious in dom. religion
–0.029 –0.022 0.115 0.131 –0.139 –0.102 0.166 0.176 –0.048 –0.006 –0.216* –0.215*
Current religious in dom.
religion
–0.118 –0.090 –0.012 –0.006 –0.101 –0.102 –0.162** –0.16** –0.018 –0.019 –0.077 –0.079
Source:ISSP, own computations.
Note:All the panels report coefficients obtained by an ordered probit estimation with robust standard errors. The dependent variable in each estimation is indicated at the top of the respective columns and is defined in the text. We reverse the original ISSP scale so that the variables increase with higher levels of agreement with the statement. Exact definition of the reported independent variables is given in the text. All regressions also include controls for gender, age, education, presence of children in the household, membership in a specific income quartile, being an employee, being employed in a public organization, trade union membership, and the degree of urbanization of the place of living (coefficients not reported in the table). Country dummies and job characteristics are included.“Affiliated to dominant religion”is an indicator variable equal to one if the respondent declared a religious affiliation that is similar to the religious denomination dominant in his/her country.“Active religious in dominant religion”is an indicator variable equal to one if“Active religious”is equal to one and the respondent belongs to the religious denomination dominant in his/her country.“Current religious in dominant religion”is an indicator variable equal to one if“Current religious”is equal to one and the respondent belongs to the religious denomination dominant in his/her country.
*Statistically significant at 10%, ** 5%, *** 1% level, respectively.
mica70(2020)4,593–613609
“Importance of having a job useful to society.”In all these cases, a significant positive effect of current religiosity was only registered for agreement with the importance of these aspects of a job (in contrast, an insignificant effect was recorded in the case of actively religious individuals).
In the WE region, both forms of current and active religiosity were significantly positively related to the agreement on the importance of these three aspects of a job. Further, having a job useful to society was significantly less important for Protestants and more important for the Other affiliation in WE. In addition, contact with other people was significantly more important in the general category Any religious affiliation, mainly driven by the significant positive effect recorded with Protestant affiliation in WE. Finally, working independently was significantly more important for individuals of any religious affiliation in EE, mainly due to a positive relationship in Catholic affiliation. In contrast, the importance of independent work was significantly lower for those who attend religious services in EE, both in the current and active category. In WE, this variable showed no significant effects.
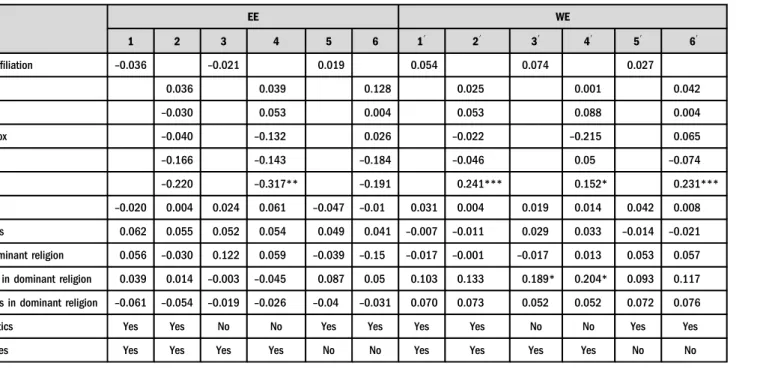
Lastly, we considered the effect of participating in the country’s dominant religion. The results of the ordered probit estimations are given inTables 5 and 6. The tables show that adding separate controls for the effect of being affiliated with the dominant religion has not altered the results regarding the insignificant effect of religion on job satisfaction in the EE region. The estimated coefficients on the WE region confirmed the insignificance of religion’s effect on job satisfaction from specifications including job characteristics and country dummies (Table 3, cols.
10–20). Furthermore, being affiliated to the country’s dominant religion does not exert any significant influence on job satisfaction in either of the regions.
In the EE region, being affiliated to the country’s dominant religion has a significant negative effect on workers’willingness to work even if they did not need money. While in the WE region, being currently religious in the country’s dominant religion is significantly negatively related to stressing the importance of helping other people, having a job useful to society, and having an interesting job. In thefirst two of the listed aspects of a job, the results contradict the positive effect of being currently religious (via any religious affiliation) and indicates that indeed, participating in the country’s majority religion might mean a different experience from participating in a minority religion.
6. CONCLUSION
This paper investigates the effect of religion on job satisfaction and work attitudes in Eastern and Western Europe. While in the WE region, workers are more generally more satisfied with their jobs compared to their EE counterparts, further differences exist between workers affiliated to different religions. In both regions, Protestant affiliation is related to higher job satisfaction, while Eastern Orthodox and Other Christian affiliation brings about lower job satisfaction. In WE, no religious affiliation is connected with lower job satisfaction and the opposite holds for Catholic affiliation in this region, while this is not the case in EE. Based on the different institutional, cultural, economic, and historical backgrounds of these two groups of countries, we analyze the effect of religion as a factor determining job satisfaction and work attitudes in these two regions.
Our findings indicate that religion tends to be a less significant driver of work attitudes in the European post–communist countries compared to the countries of WE. This outcome is consistent with the previous results ofMinarik (2014b), Fargher et al. (2008), and Borooah (2009).
610 Acta Oeconomica70 (2020) 4, 593–613
Our results rejected the hypothesis that religion is a significant factor determining job satisfaction in both WE and EE. We show that neither religious affiliation nor religious service attendance has had a significant effect on job satisfaction in EE. In WE countries, the positive effects of religious affiliation and religious service attendance become insignificant once job characteristics and country dummies are included. This may be caused by the fact that it is not religiosity and religious affiliation themselves that affect job satisfaction, but rather the char- acteristics of the job, which may have a different distribution across different religious groups, as well as the specific features of each country that relate to the variability in job satisfaction. Our results also indicate that being affiliated to the country’s dominant religion does not exert any significant influence on job satisfaction in either of the regions.
In addition, the results of our analyses partly confirmed our hypothesis as regards both the significance of religion in determining the work attitudes and the different magnitude of these effects in EE and WE. The effect of declared religious affiliation is generally weaker in the EE region. Workers affiliated to any religion would, in general, significantly enjoy work less even if they did not need money in EE: This result is mainly driven by less agreement among Catholic and Protestant affiliation. Also, Eastern Orthodox workers consider high income a significantly more important aspect of their job. Furthermore, regarding religious service attendance, both active religious and current religious groups would enjoy work more even if they did not need money and would consider working independently a less important aspect of the job. For active religious workers, high income is less important in their job while current religious workers put more importance on helping other people, contact with other people, and having a job useful to society.
In contrast, in the WE region, religious affiliation has an influence on a larger variety of work attitude measures. Generally, any religious affiliation tends to have an effect on placing greater importance on high income in a job and opportunities for advancement (driven mainly by Catholic, Eastern Orthodox, and Other affiliations), job security (driven by all affiliations), and contact with other people (driven mainly by Protestant affiliation). For Protestant workers, having a job that is useful to society is a less important aspect of a job. Regarding religious service attendance, both active religious and current religious groups put less importance on job security and at the same time consider helping other people, contact with other people, and having a job useful to society significantly more important aspects of a job. Also, current reli- gious workers would significantly enjoy work more even if they did not need money and consider high income as a less important aspect of the job.
As regards the effect of the country’s dominant religion, our results partly indicate that in the WE region, participating in the country’s majority religion might mean a different experience from participating in a minority religion. While helping other people and having a job useful to society are more important for workers currently religious (in any religious affiliation), the effect of being currently religious in the country’s dominant religion is significant and negative. In the EE region, being affiliated with the country’s dominant religion has a significant negative effect on workers’willingness to work even if they did not need money.
The results suggest that there exists a persistence of differences between the WE and EE regions in regard to declared religiosity and its relation to work attitudes. In neither of the regions did religiosity have a significant effect on job satisfaction; however, in the WE region, declared religiosity had an influence on a larger variety of work attitude measures than in the EE region. In this regard, it seems that the impact of the different role of religion in the regions remains significant even more than 25 years after the fall of the communist regimes.