PHD THESIS
KAPOSVAR UNIVERSITY
FACULTY OF ECONOMIC SCIENCE Dept. of Marketing and Trade
Head of Doctors’ School:
PROF. DR. SÁNDOR KEREKES DSc, full professor
Supervisor:
PROF. DR. ZOLTÁN SZAKÁLY CSc, full professor
Co-supervisor:
DR. habil. VIKTÓRIA SZENTE PhD, associate professor
ANALYSIS OF SATISFACTION OF STUDENTS AND LABOUR MARKET IN THE MARKETING OF HIGHER
EDUCATION
Author:
ANDREA DR. OLSOVSZKYNÉ NÉMEDI
Kaposvár 2014
TABLE OF CONTENTS
1. PRELIMINARIES AND OBJECTIVES OF THE RESEARCH ... 1
1.1PRELIMINARIES OF THE RESEARCH ... 1
1.2OBJECTIVES ... 2
2. MATERIALS AND METHOD ... 3
2.1SECONDARY SURVEY ... 3
2.2PRIMARY SURVEY ... 3
2.2.1 Qualitative survey ... 4
2.2.2 Quantitative survey ... 5
3. RESULTS ... 7
3.1RESULTS OF THE QUALITATIVE SURVEY ... 7
3.1.1 In-depth interviews with leaders of higher education institutions ... 7
3.1.2 Focus group interview ... 7
3.2RESULTS OF QUANTITATIVE SURVEY ... 8
3.2.1 Discussion of students’ opinion ... 8
3.2.2 Segmentation of students by factor and cluster analysis ... 15
3.2.3 Practical trainings from the aspect of labour market ... 19
3.3IN-DEPTH INTERVIEWS WITH LEADERS OF SECONDARY SCHOOLS ... 23
3.4SATISFACTION MODEL OF HIGHER EDUCATION ... 23
4. CONLCUSIONS ... 28
5. NEW SCIENTIFIC RESULTS ... 33
6. LIST OF PUBLICATIONS RELATED TO THE THESIS ... 34
1. PRELIMINARIES AND OBJECTIVES OF THE RESEARCH
1.1 Preliminaries of the research
In Hungary, competition has developed between the market of higher education and institutions. Higher education is increasingly considered as market service. There are institutions lagging behind and potentially dying ones, but there also are institutions that consciously use marketing and provide marketable knowledge, which ensure education adapted to the assessed demands of students, market and customers. Universities have recognized the importance of marketing approach. Due to the competitiveness, the need for marketing is more acknowledged. Education marketing is coming gradually into view. Earlier there was less Hungarian literature available than now.
Lenington agreed as early as in 1996 that one of the main challenges higher education faces is how to solve uncertainties which students, parents and other members of society feel for higher education. Do the students get what they expected from education? What pieces of information the society needs in order to make decision on the quality the institution offers (Lenington, 1996). This also proves that marketing is getting more into the view in the operation of universities.
Direct and personal reason for the choice on the theme is that as co- worker of Kaposvar University I have been in contact to students for 10 years and always intended to know their opinions. Earlier and now also, I have collected and analyzed data on the practical trainings of the students as the organizer of trainings. Researchers' curiosity has led me to start working in- depth on marketing at higher institutions. This increasing interest in the theme resulted in my PhD research program.
The results obtained in the research will contribute to the mapping up of the theoretical and practical peculiarities of higher education marketing and to define certain elements of a marketing strategy promoting the market potentials.
A sharpening competition due to the globalization is seen in higher education sector, too. The institutions compete for students, teachers. In order to survive in this competition, it is necessary to learn the demands and expectations of students and labour market and on the basis of the information can be the marketing strategy formed. By focusing on marketing
orientation strategic directions can be defined and implemented with the help of the marketing tools. All these confirm the actuality of the dissertation.
1.2 Objectives
The significant changes overcome recently have made necessary the change of attitude for marketing and for use of marketing tools. In higher education, today we can state as fact that the Hungarian universities cannot meet the long term challenges without acquiring the marketing approach and activity based on it. Higher education needs new tools and new guide; higher education marketing must follow the market trends and monitor its competitors.
The literature confirms the actuality of the chosen theme and the importance of marketing in higher education.
In the course of the research my aim was to harmonize the expectations of the stakeholders of higher education (further: higher education network) with the help of the marketing tools.
The hypothesis set up on the basis of the above mentioned:
The influence of international trends, new and further challenges that universities face with made marketing approach necessary. The marketing challenges of institutions evolve a new higher education model.
The following were my objectives in connection with the hypothesis:
H1: Marketing strategy may become effective on the basis of efficient communication.
H2: Difference between the satisfaction level of potential and leaving students may be reduced with the help of marketing tools.
H3: Practical training has been neglected and is not tailored to the needs of labour market.
H4: Feed-back is necessary between the practical training and labour market demands.
H5: There is a relationship between the satisfaction model of higher education and market orientation.
2. MATERIALS AND METHOD
In the course of the survey both secondary and primary data collection were used according to the objectives and the hypothesis of the research.
2.1 Secondary survey
Hungarian and international literatures were reviewed. Professional books, periodicals and internet based literature sources were analyzed.
2.2 Primary survey
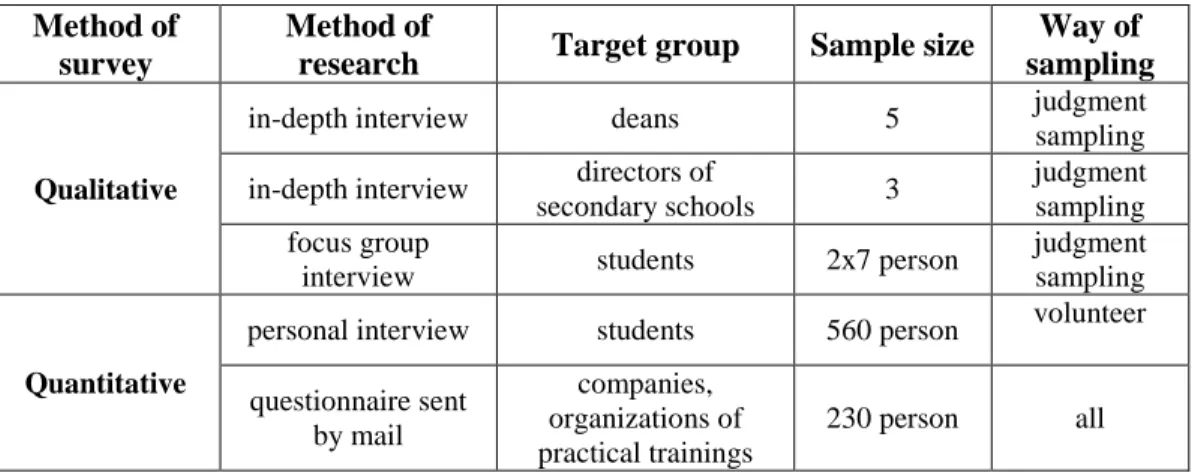
Table 1 summarizes the used qualitative and quantitative surveys in the course of the research.
Table 1: Methods used in primary survey Method of
survey
Method of
research Target group Sample size Way of sampling
Qualitative
in-depth interview deans 5 judgment
sampling in-depth interview directors of
secondary schools 3 judgment
sampling focus group
interview students 2x7 person judgment
sampling
Quantitative
personal interview students 560 person volunteer
questionnaire sent by mail
companies, organizations of practical trainings
230 person all
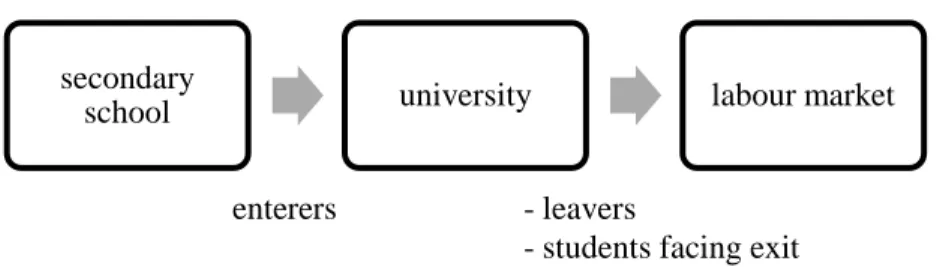
The research focused on three main target groups: active students, actors of labour market in connection with practical trainings, secondary schools as sources of potential students (Figure 1).
The reasons behind selecting the target groups are the objectives set as the analysis of secondary schools sending students to higher education (inputs). And the second target group is the active students of universities.
Figure 1: Marketing network of higher education
As third, the expectations of external experts and managers – who are at the same time actors of labour market - towards the leavers or students facing exit and spending their practical training. These actors are the elements of the marketing network of higher education.
2.2.1 Qualitative survey
First of all in-depth interviews were conducted with deans of faculties running programs in agricultural engineering and agricultural engineering in economics in 2008 on the challenges of higher education marketing.
The interviews were conducted with deans of two faculties of Kaposvar University (ÁTK, GTK), one faculty at Debrecen University (GVK), Georgikon Faculty of Pannon University and the Faculty of Engineering at Szeged University of Sciences.
Focus group interviews were conducted with first year and final year students at Kaposvar University.
One of the main target groups of the marketing work is the potential students; therefore further in-depth interviews were done with the directors of secondary schools on their opinion on the application of marketing tools.
Three agricultural secondary schools were selected and their resources were studied for market demands.
secondary
school university labour market
- leavers
- students facing exit enterers
2.2.2 Quantitative survey
The large sample survey covered the students of three higher education institution - Kaposvár, Gödöllő and Debrecen; the number of questionnaires was 560.
The questionnaire consisted of closed question mainly; interval scale was reasonable to use in case of certain questions; and the respondents were able to reflect personal opinions in a given number of questions.
Another target group for questionnaire survey was the companies of practical trainings.
Between 2009 and 2013 altogether 230 questionnaires were sent back by mail or in e-mail by managers of companies accepting students from Faculty of Economic Science of Kaposvar University for practical trainings.
The processing of information gained was based on SPSS 19.1 after having recorded and cleared the data. Both univariate and multivariate methods were used (Sajtos and Mitev, 2007).
Frequency distributions, crosstable analysis were used to define the relationship of variables with background variables as well as between variables. Chi2-test and one-sample t-test were the used methods; as well as mean and coefficient of variance were calculated in order to ‘test’ the accuracy of the sample mean.
In the course of crosstable analysis Cramer index was used to measure the strength of the correlation between the parameters.
Factor and cluster analysis were done in case of two questions in the student questionnaire. The adequacy of the variables for information reduction was tested with Bartlett test – showing the alteration of non- diagonal elements from zero. Besides, Kaiser-Meyer-Olkin (KMO) test was calculated indicating the suitability of variables for data reduction (SAJTOS and MITEV, 2007).
In further step the results of factor analysis were used for cluster analysis – K-mean method was used. The answers given on the questions were compared with cluster membership and the correlation was calculated at 95%
confidence level.
The limitations of the results obtained are that actors of labour market were asked only in case of practical trainings at Kaposvar University GTK;
therefore the information is only partial.
Another limitation is that the survey covered the final year students as leavers and did not cover those active on labour market.
Further issue is whether the period of three months of the practical trainings is long enough that the supervisors of practical trainings have opinion about the students’ work.
Another one circumstance is that opinion leaders called the attention of the students at SZIE not to write negatively about the institution, which may distort the results.
3. RESULTS
In this chapter the main results of the primary survey are discussed.
3.1 Results of the qualitative survey
As it was shown in Chapter Materials and methods, the qualitative survey is divided into several steps.
3.1.1 In-depth interviews with leaders of higher education institutions The qualitative survey accompanies with H1 hypothesis and it frames up the application of marketing tools on the example of the involved organizations.
The analysis resulted in a SWOT table of the higher educating marketing.
In general, it can be stated that recently, the enrolling has narrowed to regional level in institutions with an earlier enrolling covering national level.
The reason can be that similar study programs evolved on several faculties, the value of the diploma is hardly acknowledged by the market and at the same time families face gradually worsening financial environment
Faculties were not prepared to launch practice based BSc programs, many faculty leader expressed that structural changes are inevitable in the near future.
The leaders’ opinion is parted on the students’ free time and traditions.
The efficiency of teachers and the junior staff are considered fair and important. Majority of the leaders lacks marketing approach in enrolling activity and has a serious intention to change it. Neither their opinion on the enrolling staff is uniform; there are where the junior teachers, PhD students or master students are higher valued, while others think experienced teachers are needed in the enrolling process.
The leaders of the institutions also lack studies on the job opportunities of leaving master students.
Following the qualitative survey, focus group interviews were conducted with students before quantitative data collection.
3.1.2 Focus group interview
There were two focus group interviews conducted with the students of Kaposvar University GTK; one with first year another with final year students - parallel with the questionnaire survey on the sub-samples.
Firstly the motivation for further education then enrolment was studied.
Then, we analyzed the effect of an enrolment advertisement and later their opinion was asked on education and services.
The final year students considered all factors important. Both groups considered similarly at first place the standard of education. Final year students ranked infrastructure – together with sparkling campus-life, information flow and leisure facilities higher. It was interesting that environment was ranked lowest by both groups. It is also worth mentioning that leisure facilities are not valued as campus service and the personality of their teacher is also indifferent for them.
Further the satisfaction with the listed factors was analyzed. Importance of and satisfaction with the factors was similar for first year students. The final year students are most satisfied with campus-life, environment, and infrastructure and least satisfied with language learning and information flow.
In the course of the focus group interview many pieces of information were given on education, services, student life. I think it is important to enable students to express their opinions.
The qualitative survey helped finalizing the questionnaire. Next chapter introduces the results of questionnaire survey.
3.2 Results of quantitative survey
According to the written in Chapter Materials and methods, two questionnaire surveys were conducted. First the results of student interviews are introduced which is in connection with H2 hypothesis; then the analysis of questionnaires filled in by the managers of practical training placements.
3.2.1 Discussion of students’ opinion
As earlier researches confirm, the distance of higher education institution from living place and accessibility is higher valued nowadays when choosing institution (Rechnitzer, 2010). In less extent, but also the parents’ advices (15.20%) count. Even less important the role of a friend learning in the institution and only 7.70% of the students was motivated by that they wanted to study in small rural town. As other motivating factors, first impression,
siblings learning at the institution, and previous bachelor level studies were listed.
After the questions of motivations to further study I wanted to know the students’ expectations when they applied. Generally, priority is to hold a diploma, but other views are also reported during their studies. They highly require an extension of their relationships, although a part of the students think studying is only spending some extra time for finding their role in society as it is supported by literature, too (Törőcsik, 2010).
In the following, the importance of and satisfaction with nine factors were measured in scale from 1 to 5. The results are discussed below.
Most important factor for students is the standard of education (with a mean of 4.44). The answers were homogenous with low standard deviation and variation coefficients. It is almost same important to have good communication and relations with other students, and that the study material is easy. These factors got also low standard deviation and variation coefficients, which means homogenous answers. Practical training, the personality of teachers and environment are also mainly important with mean above 4.00. Only two exceptions occurred: language learning and infrastructure that got mean below 4.00. As other factors, studying abroad, practice based learning and good organization were mentioned important.
The satisfaction with these factors was somewhat lower with means between 3.50 and 4.00; only two factors exceeded the mean of 4.00, which were the environment and the relation with other students – so the students are more satisfied with these two factors.
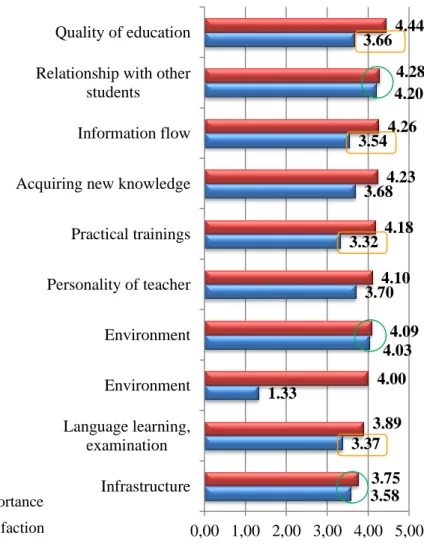
Figure 2 compares the level of importance and satisfaction with each factor. In general the majority of the importance scores are somewhat higher than the satisfaction scores. In case of 2-3 factors, such as the relationship with other students, environment and infrastructure the importance and satisfaction mean scores are similar.
Figure 2: Importance of factors and satisfaction of students with them (N=560)
Students expect more from the standard of education and from the teachers personality; while they are neither satisfied with practical trainings and language learning.
In the comparison faculties a number of significant results were obtained (Figure 3). The figure shows that the higher scores are given by SZIE with the exception of language learning, language examination and information flow. I must emphasis, that students were less satisfied with language learning facilities on this faculty (3.09), oppositely the highest score was achieved at the faculty of KE (3.64, p≤0.001).
3.58 3.37 1.33
4.03 3.70 3.32
3.68 3.54
4.20 3.66
3.75 3.89 4.00
4.09 4.10
4.18 4.23 4.26 4.28 4.44
0,00 1,00 2,00 3,00 4,00 5,00 Infrastructure
Language learning, examination
Environment Environment Personality of teacher Practical trainings Acquiring new knowledge Information flow Relationship with other
students
Quality of education
importance satisfaction
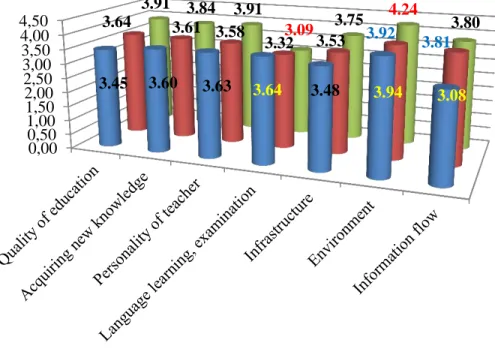
Figure 3: Significant differences between faculties in the satisfaction mean scores (N=560)
In the case of satisfaction with environment (p≤0.05) SZIE has score (4.24) above 4.00; KE was ranked at second place (3.94), closely followed by DE (3.92). This factor was given the highest scores on all three faculties.
Environment is not only important for students; they are also satisfied with it.
Also the standard of education got the highest satisfaction scores on SZIE (mean: 3.91), which is closely followed by DE (3.64) and KE (3.45) (p≤0,001). The students are most satisfied with the teachers’ personality on SZIE (3.91), the students of KE gave a mean score of 3.63 and DE closes the rank with (3.58). Students of KE were least satisfied with information flow (mean: 3.08).
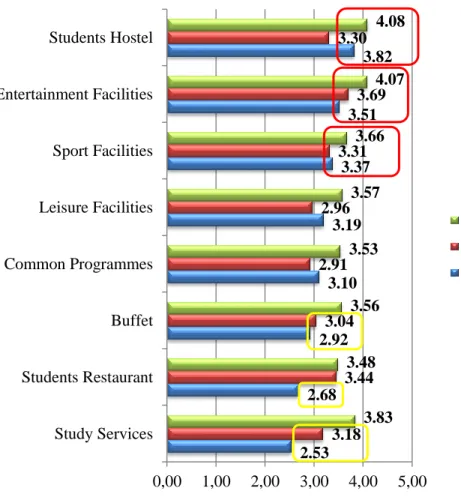
Several significant differences were revealed between the faculties concerning the services offered (Figure 4).
The first three means of satisfaction belong to student hostel, leisure and sport facilities. The significant differences belong faculties are as follow. The
0,500,00 1,501,00 2,502,00 3,503,00 4,504,00
3.45 3.60 3.63 3.64 3.48 3.94 3.08 3.64 3.61 3.58
3.32 3.53 3.92
3.81 3.91 3.84 3.91
3.09 3.75 4.24
3.80
KE GTK DE GVK SZIE GTK
student hostel of SZIE was the highest ranked (4.08) closely followed by that of the KE (3.82), but DE got only a mean of 3.30 (p≤0,001). The students of SZIE are mostly satisfied with leisure facilities (4.07); while this factor was given 3.69 by the students of DE and 3.51 by those of KE (p≤0,001). The SZIE students were most satisfied with sport facilities, too (3.66), KE (3.37) and DE (3.31) lagged behind (p≤0.01); although none of the scores can be considered ideal.
Figure 4: Satisfaction with services offered by faculties (N=560)
Similar picture were found in case of the satisfaction with leisure facilities and common programs; the rank here is SZIE, KE, DE. However, the dissatisfaction of the students of DE is eye-catching (2.91; p≤0.01).
The students’ restaurant was scored somewhat better than average by students at SZIE and DE, while it is valued much lower at KE (2.68;
p≤0,001). The picture is similar in case of the buffet. The opinion on the 2.53
2.68 2.92
3.10 3.19
3.37 3.51
3.82
3.18 3.44 3.04 2.91
2.96 3.31
3.69 3.30
3.83 3.48
3.56 3.53 3.57 3.66
4.07 4.08
0,00 1,00 2,00 3,00 4,00 5,00 Study Services
Students Restaurant Buffet Common Programmes Leisure Facilities Sport Facilities Entertainment Facilities Students Hostel
SZIE GTK DE GVK KE GTK
Study Services was also different: the students at SZIE are mostly satisfied (3.83); those of DE are less (3.18), while students at KE are least satisfied (2.53, p≤0,001).
Students service points are most required on Kaposvar University (55.2%), and respondents at SZIE (45.7%), and DE similarly do (42.2%, p≤0.05). Students can tell their problems and opinion on education and services anonymously.
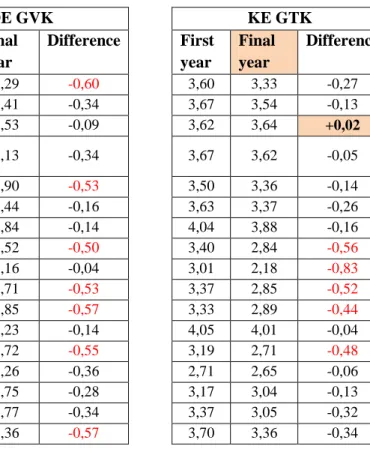
Finally, the difference between first and final year students was analyzed for each factor, and separately at the three faculties. The summarized results of the analysis of answers given on scale from 1 to 5 are shown by Figure 5.
The figure shows the mean scores given by first and final year students and the difference. It was found that the satisfaction of students decreases with years, but positive differences were also found mostly in case of the faculty of SZIE GTK.
These gaps were measured and show how the active students feel themselves how satisfied they are. Their satisfaction and ‘word of mouth’ can serve the aims of enrolling. The differences although should not be evaluated on their own; hence it does matter if the score 4.25 decreased with 0.14 or the score 3.25. Time series of several years may let us analyze how the satisfaction of first year students changes by the end of their studies.
SZIE GTK DE GVK KE GTK
Factor First
year
Final year
Difference First year
Final year
Difference First year
Final year
Difference
Standard of education 4,10 3,71 -0,39 3,89 3,29 -0,60 3,60 3,33 -0,27
Acquiring knowledge 3,91 3,77 -0,14 3,75 3,41 -0,34 3,67 3,54 -0,13
Personality of teacher 3,97 3,85 -0,12 3,62 3,53 -0,09 3,62 3,64 +0,02
Language learning,
examination 3,25 2,94 -0,31 3,47 3,13 -0,34 3,67 3,62 -0,05
Practical training 3,50 3,36 -0,14 3,43 2,90 -0,53 3,50 3,36 -0,14
Infrastructure 3,78 3,71 -0,07 3,60 3,44 -0,16 3,63 3,37 -0,26
Environment 4,22 4,25 +0,03 3,98 3,84 -0,14 4,04 3,88 -0,16
Information flow 3,86 3,74 -0,12 4,02 3,52 -0,50 3,40 2,84 -0,56
Study Services 3,93 3,72 -0,21 3,20 3,16 -0,04 3,01 2,18 -0,83
ETR group 3,45 3,25 -0,20 3,24 2,71 -0,53 3,37 2,85 -0,52
Self-governance of students 3,46 2,98 -0,48 3,42 2,85 -0,57 3,33 2,89 -0,44
Students hostel 4,15 4,02 -0,13 3,37 3,23 -0,14 4,05 4,01 -0,04
Buffet 3,65 3,47 -0,18 3,27 2,72 -0,55 3,19 2,71 -0,48
Students restaurant 3,32 3,62 +0,30 3,62 3,26 -0,36 2,71 2,65 -0,06
Common programs 3,52 3,54 +0,02 3,03 2,75 -0,28 3,17 3,04 -0,13
Leisure facilities 3,53 3,60 +0,07 3,11 2,77 -0,34 3,37 3,05 -0,32
Entertainment facilities 4,00 4,14 +0,14 3,93 3,36 -0,57 3,70 3,36 -0,34
Figure 5: Students’ satisfaction on various faculties and years
3.2.2 Segmentation of students by factor and cluster analysis
The higher variability of answers given by students on questions related to education, education-related and other services call attention on the necessity of factor analysis.
3.2.2.1 Factor analysis
The 19 factors listed in the part of questionnaire related to satisfaction of the students constituted the basis of factor analysis, which was measured by them on scale from 1 to 5.
Following the varimax rotation 4 factors were differentiated. KMO index is 86.60%, which indicates the suitability of factors for the data reduction analysis (Sajtos és Mitev, 2007). The significance level of the Bartlett-test is p=0.000, which show that variables are correlated.
The method defines the factors influencing the satisfaction of students.
Table 2 shows the factors and the minimum-maximum correlations of variables.
Table 2: Rotated factor matrix based on the education, education- related and other services
Elements analyzed Factors
1 2 3 4
Acquiring knowledge, self-education 0,725
Standard of education 0,704
Personality of teacher 0,643
Information flow 0,637
Environment of studies 0,622
Study Services 0,580
Infrastructure 0,551
Relationship with other students 0,468
Sport facilities 0,800
Leisure facilities 0,768
Entertainment facilities 0,766
Common programs 0,712
Self-governance of students 0,405 0,405
Students restaurant 0,741
Students hostel 0,676
Buffet 0,502
ETR/NEPTUN group 0,361
Language learning, examination 0,781
Practical training 0,645
Factor 1 explains education and related services, communication; thus it can be named as ‘education and its environment’. This factor constitutes the real students’ expectations and satisfaction.
The potential nomination for Factor number 2 is ‘free time activities’.
Sport, entertainment, common programs, other leisure activities belong here and the Self-government for Students has got role in the organization of them.
It is important that this self-government is represented in Factor 3, too, with similar correlation.
In Factor 3, the role of accommodation, food as well as electronic study systems is accented; the name of this factor can be ‘basic services’.
Finally, Factor 4 explains two elements: language learning and practical training – its potential nomination is ‘market expectations’.
3.2.2.2 Cluster analysis
Following factor analysis, the variables were grouped into homogenous clusters. The objective of the analysis was to gain more exact information on the opinions of students regarding their satisfaction.
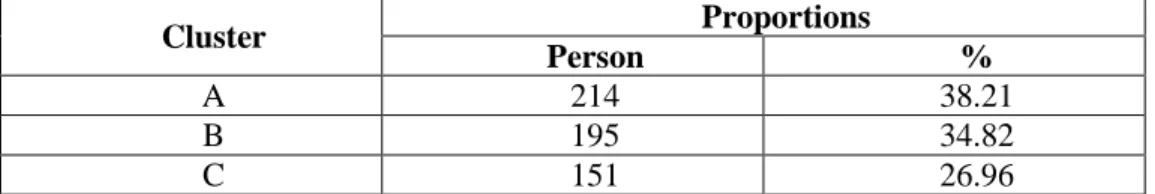
The analysis resulted in 3 clusters, covering 100% of the sample. The size of the clusters is summarized in Table 3.
Table 3: The proportion of the clusters within the whole sample (N=560)
Cluster Proportions
Person %
A 214 38.21
B 195 34.82
C 151 26.96
Significant results were obtained in the cross table analysis for all background variables, such as the year, faculty, study program and region (p≤0,001).
The three clusters can be defined as follow:
Cluster “A”:
This cluster constitutes both first year and final year students. Those students are dominant, who attend Kaposvar University, but another two faculties are
also present. Distribution of the study programs and levels of study is normal.
The students are rather from South-Transdanubian and North-Alföld regions.
Cluster “B”:
In this cluster, first year students are in majority; the group of students from SZIE GTK has high proportion, but those from DE also significant. The level of education is rather bachelor and master from North-Hungary, Central- Hungary and Alföld regions, but few higher level vocational schools (so called FSZ or FOSZK) also are present.
Cluster “C”:
Rather final year students belong here; more than 1/3rd of the students from KE GTK, and 1/4th of the students are from DE GVK, while SZIE GTK represents lower proportion. The proportion of students at FSZ is determinant and from the South-Transdanubian region.
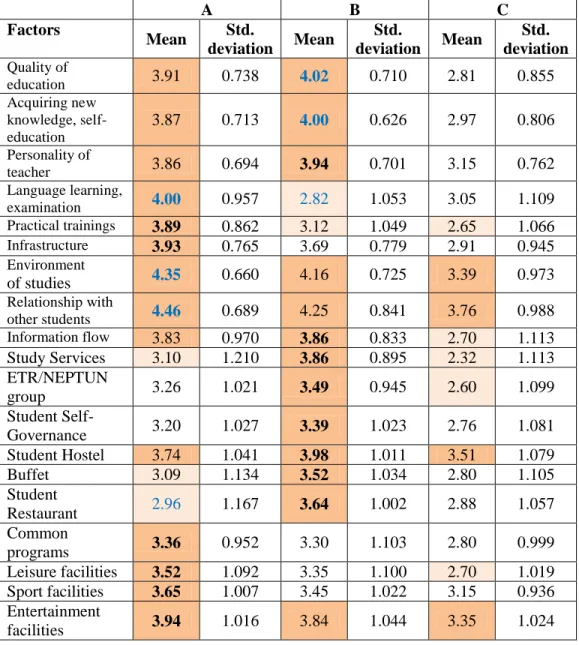
The differences between the clusters for each factors involved are significant (p≤0.05), which are shown in Table 4. The darker colours highlight those factors the students are more satisfied and lighter colours those that less. The highest scores are bold.
First Cluster ‘A’: “critical and open for communication”
This cluster, 38.21% of the respondents belongs to. They are most satisfied with the relationship with other students, their environment, and language learning and examination facilities. This cluster is the most satisfied with entertainment facilities.
They are mainly satisfied with education, too. The information is mostly available for them. They are although less satisfied with services related to education. Among other services, they are mainly satisfied with student hostel, in average with buffet and not satisfied with students’ restaurant. Their opinion on leisure and sport facilities is rather good, the best among the clusters.
Several significant results were obtained (p≤0.05) in the comparison of answers given by the clusters.
According to the results, the students belonging to Cluster ‘A’ are critical, not fully satisfied with education and most satisfied with environment a relationship with other students. They upvalue the leisure activities and entertainment.
Table 4: The clusters’ characteristics on the basis of significant correlations
A B C
Factors
Mean Std.
deviation Mean Std.
deviation Mean Std.
deviation Quality of
education 3.91 0.738 4.02 0.710 2.81 0.855
Acquiring new knowledge, self- education
3.87 0.713 4.00 0.626 2.97 0.806 Personality of
teacher 3.86 0.694 3.94 0.701 3.15 0.762
Language learning,
examination 4.00 0.957 2.82 1.053 3.05 1.109
Practical trainings 3.89 0.862 3.12 1.049 2.65 1.066
Infrastructure 3.93 0.765 3.69 0.779 2.91 0.945
Environment
of studies 4.35 0.660 4.16 0.725 3.39 0.973
Relationship with
other students 4.46 0.689 4.25 0.841 3.76 0.988
Information flow 3.83 0.970 3.86 0.833 2.70 1.113
Study Services 3.10 1.210 3.86 0.895 2.32 1.113 ETR/NEPTUN
group 3.26 1.021 3.49 0.945 2.60 1.099
Student Self-
Governance 3.20 1.027 3.39 1.023 2.76 1.081
Student Hostel 3.74 1.041 3.98 1.011 3.51 1.079
Buffet 3.09 1.134 3.52 1.034 2.80 1.105
Student
Restaurant 2.96 1.167 3.64 1.002 2.88 1.057
Common
programs 3.36 0.952 3.30 1.103 2.80 0.999
Leisure facilities 3.52 1.092 3.35 1.100 2.70 1.019 Sport facilities 3.65 1.007 3.45 1.022 3.15 0.936 Entertainment
facilities 3.94 1.016 3.84 1.044 3.35 1.024
Second Cluster ‘B’: “sound acceptors”
The students belonging to this cluster are most satisfied with education, environment and relationships with other students. However it needs to be mentioned that they are least satisfied with language learning. Among the three clusters, they are the most satisfied with services relating either education or any other fields of life. The members of this cluster are the most satisfied with the student hostel, information flow and Study Services, also.
Significant results were the following. These students are mostly motivated by the reputation of the university (46.2%).
Their primary expectation was at application to widen their relationship (40.1%), and besides, holding diploma is also important for them (37.6%).
This cluster gives the highest share in students open for education abroad (46.1%) and in setting up Customer Service Point (31.7%). In their choice on practical training placement they preferred to choose upon earlier acquaintance (37.1%).
In total, openness, communication skills are upvalued in this cluster. It can be stated they are generally satisfied with all of the factors.
Third Cluster ‘C’: “skeptic, dissatisfied”
It is eye-catching at first glance that these students have the lowest satisfaction with all factors (there are not bold letter in any rows). It can be mentioned that the means are below 3.00, which mean a rather dissatisfied group of students. They are dissatisfied with education, services related to education. They are still more satisfied with their relationship with other students and student hostel, with environment and entertainment facilities.
They feel very critically towards the Study Services, ETR group, practical training and information flow. (The members of the cluster are generally final year students according to the background variables.)
The result show, that this cluster is almost dissatisfied with everything;
they live in Kaposvár; these students are critical, experienced and of high expectations.
3.2.3 Practical trainings from the aspect of labour market
Another pillar of my quantitative survey was the questionnaire-based interview of practical training placements.
At the end of the placements of the students of Kaposvar University Faculty of Economic Science, the interviews were conducted between 2009 and 2013. Altogether 230 questionnaires were filled in and sent back in electronic way. On the basis of the experiences of the first round of interviews (Olsovszkyné és Balogh, 2010) – which was current from the point that the first bachelor program was finished this year – the interviews were continued in the placement companies and institutes.
According to the responds, the students were given independent part- tasks in almost 70% of the institutions, companies. It is worth mentioning that 17% of them worked independently, while receiving salary for their job.
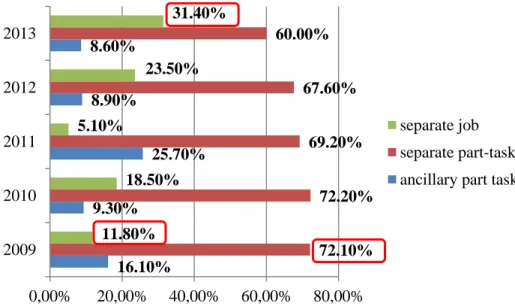
There was significant change during the years in the extent of involvement of students in work (Figure 6).
In 2009, more that 72% of the students was given independent part-tasks and 16.1% of them ancillary part tasks, while 11.8% worked independently.
The number of students being given independent part-tasks is decreasing by years, it is 60% by 2003; also, the ratio of those being given ancillary part- tasks is decreasing, while the share of independent full job grew to 31%
(p≤0.05). On the basis of the above mentioned, the companies tend to give more independent tasks and full job to their potential employee.
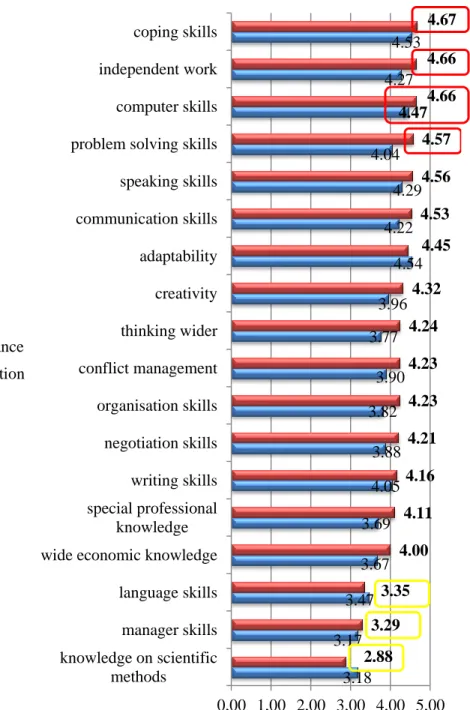
Figure 6: The degree of involvement of students in work (N=230) Figure 7 compares the importance of and the satisfaction with various factors. The companies were asked to assess this potential labour on a scale from 1 to 5.
Most important expectation was the computer skills, with mean of 4.65 and low std. deviation; the variation coefficient was hardly higher than 12%;
which indicates a homogenous dataset. An earlier question in the questionnaire was to assess the importance of knowledge. According to the answers given, it was also one of the most important factors. Generally, they expect having diploma either (4.19), although there is a higher variability in the answers (variation coefficient was above 20%). Professional experience of the candidate is less expected (3.80), and language skills are even less.
There is a higher variation in the expectation of language skills; workplaces 16.10%
9.30%
25.70%
8.90%
8.60%
72.10%
72.20%
69.20%
67.60%
60.00%
11.80%
18.50%
5.10%
23.50%
31.40%
0,00% 20,00% 40,00% 60,00% 80,00%
2009 2010 2011 2012 2013
separate job separate part-task ancillary part task
do not evenly expect it. They do not think that experience gained abroad is relevant for potential employee (2.07). Around 12% of the respondents indicated their other expectations, such as adaptability, enthusiasm, creativity and work load capacity.
On the question whether they offered job half of the respondents said
‘no’, because of limitations, other 32.6% did not offered any job and 17.8%
did. In the recent economic situation, this share is welcome. By comparing this figure to the results that 30% of the students of Kaposvar University, GTK do expect to receive job offer by practical placement companies we can state that the real number of job offers converge to it.
Figure 7: Importance and satisfaction of knowledge and skills (N=230)
In the following part of the dissertation I discuss the results of the analysis of the universities’ inputs. The use of marketing tools by secondary schools is examined via the sending potential students with qualitative methods. All these give an underlying for market orientation in higher education.
3.18 3.17
3.47 3.67 3.69 4.05 3.88 3.82
3.90 3.77
3.96 4.54 4.22
4.29 4.04
4.47 4.27
4.53
2.88 3.29
3.35 4.00
4.11 4.16 4.21 4.23 4.23 4.24 4.32
4.45 4.53 4.56 4.57 4.66 4.66 4.67
0,00 1,00 2,00 3,00 4,00 5,00 knowledge on scientific
methods
manager skills language skills wide economic knowledge special professional
knowledge writing skills negotiation skills organisation skills conflict management thinking wider creativity adaptability communication skills speaking skills problem solving skills computer skills independent work coping skills
importance satisfaction
3.3 In-depth interviews with leaders of secondary schools
Similarly to higher education, competition for students developed in case of secondary schools, too. In earlier surveys we (Olsovszkyné, Huszka and Olsovszky, 2011) interviewed secondary schools with agricultural profile, because they are one of the sources of potential students to two faculties of Kaposvar University. One of them is the secondary school nearby Kaposvar University, but we visited two international partner institutions of it, too. Our objective was to analyze the marketing challenges of these schools.
SWOT analysis was conducted on the education marketing.
Summarizing the results of the analysis, it was found that the number of potential students of agriculture-focused schools is decreasing. The reputation of agricultural jobs is weakening. Solutions are sought in the schools and they try to launch marketable study programs in order for their survival. It is clear that those institutions increase their number of students who are more flexible to market needs and apply wide selection of marketing tools.
The result reflected that these institutions can only renew if adapt to market demands at the same time relying on their strengths such as traditions, high quality education, professionalism, etc. They want to act as schools that meet the economic and social requirements and offer high quality, up-to-date and student-friendly education and services.
3.4 Satisfaction model of higher education
In this chapter a ‘satisfaction model of the higher education’ is set up on the basis of the results of primary survey.
There are several models on market orientation (Komáromi, 2003, Törőcsik and Kuráth, 2009), as well as on students’ satisfaction (Hetesi, 2012) in the Hungarian literature.
According to Komáromi, the market orientation strategy can be defined via the marketing mix elements on the basis of information gathering and various subsequent decisions.
In the model of Szeged University of Science, Hetesi researches the preliminaries then the consequences of satisfaction. By further considering these models and my own results, a new model is introduced (Figure 8).
The novelty of ties model is that it addresses the satisfaction of one segment of labour market actors besides the satisfaction of active students – through institutions and companies providing practical training placements.
This is only possible in case of bachelor and FSZ/FOSZK study programs.
This is only valid for active students, those facing exit and the opinion of external actors on them. Although the satisfaction of graduate students also belongs to the model – marked with interrupted line – it has not been analyzed in the dissertation.
Separate group of the students is the first year one as the enterers and another one is leaver students facing exit. Employee satisfaction is also marked with interrupted line, because this group is not addressed in the research but if the aim is to measure satisfaction in the institute this segment needs to be analyzed, too. On the basis on earlier surveys, expectations are determined by available information, the motivations for choice and the image of the university, too. These are complemented with environment, the determinacy of the interviewer (especially in case of focus groups) and anonymity and loyalty as influencing factors.
Satisfaction is dependent on the quality of service, which enables satisfying the needs. Total Customer Satisfaction leads to customer loyalty, which forms market orientation and marketing strategy. This can be helped by the model.
The exploration of importance of factors and of the difference between the levels of satisfaction with them highlights the weak and strong points and defines the areas to improve. This model does not contain the working graduated students; it focuses on the active students by themselves and external actor.
Figure 8: Satisfaction model of higher education Source: own edition
Efficient communication is inevitable for the functioning satisfaction model of higher education and customer orientation. It is reasonable to set up a communication network (Figure 9).
EXPERIENCES EXPECTATIONS DIFFERENCES
Student satisfaction - first year - final year
Labour market satisfaction -practical trainig
placements
Employee satisfaction
with edcation with services
With education, competencies, studnets’ achievment, attitude
workplaces environment
information personality of interviewer motivation rejection anonimity loylty imázs
Figure 9: Communication network of higher education Source: own edition
Besides the two main actors of the communication network - the higher education institution and labour market – the market actors of enrolment activity are present as third target group. These three target groups were defined in the methodological chapter (Figure 1).
The higher education institution is represented by employees and teachers besides the students; their communication is although affected significantly by parents and other stakeholders such as friends, local communities, governance, and society and so on. Secondary schools as highlighted target group are not listed here, because the communication towards them is significantly important as they are the sending institutes of potential students of higher education. They can be the main segment of market orientation strategy.
Higher education institute
Actors of labour market (output)
parents friends
local communities society
governance
…
Students
Teachers
Employees
companies
institutes
nonprofit sector Faculties, institutes
of higher education
Actors of enrollment market (input)
schools
Internal communication between actors cannot be left out of consideration, either. The recommended Student Contact Points can be efficient in this aspect.
Labour market constitutes of companies, institutions and non-profit sector, who employ the graduated students. The communication between higher education institutions is also important.
The arrows indicate back and forth relations, showing the necessary directions of communication. Efficient communication help maintain the partnership. The competitors thus can take mutual benefit of benchmarking.
The above introduced actors apply wide range of tools via the communication channels. Internet, web.2 applications and Face book provide opportunities for the communication with the new generation.
Education exhibition, open days various professional exhibitions (KÁN, etc.), events, conferences give excellent opportunities for communication.
Students’ Days provide space for managing partnership of teachers and students. As new program, the Night of Researchers is worth mentioning, which ensures insight to the life of the institution for interested people. These interactive formations raise the attention; communication help implement market orientation and the work of the management.
4. CONLCUSIONS
The aim of the research was to harmonize the expectations of the stakeholders of higher education with the help of the marketing tools.
This chapter gives conclusions and recommendations on the basis of the set hypotheses of the research, empirical survey conducted and the review of the literature.
The results of the hypothesis analysis are summarized in Table 5.
Table 5: Results of hypothesis tests
Hypothesis Result
H0: The influence of international trends, new and further challenges that universities face with made marketing approach necessary. The marketing challenges of institutions evolve a new higher education model.
Proved
H1: Marketing strategy may become effective on the basis of efficient communication.
Proved
H2: Difference between the satisfaction level of potential and leaving students may be reduced with the help of marketing tools.
Proved
H3: Practical training has been neglected
and is not tailored to the needs of labour market.
Proved Rejected
H4: Feed-back is necessary between the practical training
and labour market demands. Proved
H5: There is a relationship between the satisfaction model of higher education and market
Proved
The literature review pointed out that while earlier there was not cooperation between universities, now they are open for it.
The results obtained from in-depth interviews also prove that there are examples for cooperations between teachers, researchers. A part of the universities has recognized the potential and need for it. A change went through, which is the result of that more multidisciplinary researches run, and which requires then cooperation between various fields of science, thus faculties and universities. This way must be followed and the joint points of
universities have to be found in education and research. I believe personal contacts have great role in it.
On the basis of the results of qualitative survey it was found that internal communication does not always take its role; the loyalty of employees and students need to be improved. It is necessary to work towards cooperation and mutual benefits keeping in mind that competitors are not enemies but partners. The competion is for students although there can be partnership at other areas; it is necessary to find the common points in order to take mutual benefits.
Benchmarking assessment, sustainability and competitive advantage have been come into view in higher education, too. In the long term those universities will be competitive which can use each other’s services.
It is necessary to adapt to market demands; and marketing, targeting marketing has great role in the implementation and in strategic thinking. In order to form cooperation, activity of both parties is necessary.
The above proves my first hypothesis. (H1: Marketing strategy may become effective on the basis of efficient communication.)
On the basis of my researches, the two international secondary schools involved in the analysis show excellent potential for adaptation to new environment as well as maintaining their traditions. It is a good practice to cooperate with factories, firms and research centers and universities. This can be compared to the new trend, new mission in higher education. Researchers show the way how it is possible to overcome the approach of “ivory tower”
and become lighthouse.
On the basis of the secondary survey, besides social responsibility services offered by universities are the widest dimension of tertiary mission. This constitutes of services offered to students and teachers. The dissertation deals with only the services offered to students.
Today’s generation’s changed communication habits make it reasonable that institutions – by adapting to them – primarily offer up-to-date information through internet, with BTL applications.
The expectations of students with several factors and their satisfaction were compared between faculties. The results reflect on the leading position of SZIE GTK. This faculty has great traditions; its students are loyal to the institute. The opinion of the students of Debrecen is likely based on that they
are more open, critical and take their opinion open. I believe it is important to strengthen the image of Kaposvar University among its students. The secondary survey proved that loyalty can be improved by using symbols, logos. I recommend to offer the students of Kaposvar University – similarly to other universities – various things, such as badges, T-shirts, sweatshirts, or even pens, notebooks, folders, key chains with logo, of whose everyday use strengthens their loyalty.
The opinion of students on the relationship of teachers and students confirmed that common programs are necessary. A more direct communication will make the relationship of the two parties smoother. A student-friendly university must offer programs tailored to today's young people’s habits, demands.
On the basis of my results, the students are not satisfied with the operation of the Study Services and electronic education systems on either faculty. This is considered as critical point and the answer for the question ‘Why” should be found and the problem should be solved.
In case of other services, the opinions given on food facilities are worth attention. It is necessary to offer food for the students, considering their changed demands in a quality environment. I recommend offering them such room which is equipped for the consumption of food brought by the majority of the students from home.
Our students become more conscious consumers and students. A part of the students already requires the setting up of Customer Service Point, and their share will likely grow in the future, therefore I recommend setting up Students Contact Points on the faculties. In this way they are offered opportunity to learn their problems and find solutions.
I have indicated the difference between the opinions of first year and final year students. The level of satisfaction is decreasing with the years, they become more critical, their scope of view widens and expectations towards quality services increase.
The services offered can be promoted if the students are satisfied with them. It must be emphasized that – beyond the quality of education – the quality of services is not only important to acquaint students but to keep them, too.
Taking into consideration of the students’ opinion and marketing strategy together can be competitive advantage for universities.
All above these confirm the proof of my second hypothesis (H2:
Difference between the satisfaction level of potential and leaving students may be reduced with the help of marketing tools.)
The secondary surveys confirmed the necessity and role of practical trainings on bachelor programs. According to the opinion of the companies providing practical training placements not the professional knowledge is important, but much more the communication skills, problem solving attitude and computer skills are primary for them. Their opinion led me to the conclusions that the study programs more or less are tailored to labour market expectations. This is proved by the fact that while atelier the students got only part-tasks; recently they are given separate jobs. The number of job offers also confirms that practical training placements are good basis for potential job in the future.
The opinion of students was different on the degree of practice-orientation within the study programs. Final year students think that practice is not enough; while the leaders of the faculties also believe that bachelor level programs are too theory-oriented. I think there is still much to do in this field.
I accept the first half of the third hypothesis (H3: Practical training has been neglected), but not the second part of it (...and is not tailored to the needs of labour market) according to the above mentioned. The practical trainings are adjusted to changed requirements of the labour market.
The form of communication has changed; it is efficient enough to contact students in e-mail or telephone. Besides though, personal contact is desired, which is possible via work sessions before or after the practical training. I consider personal contact and relation to be very important. Practical trainings are efficient only if the organizations accepting students for placement are considered as partners and we raise their awareness on their outstanding role in higher education.
The Communication Network set up and the use of it can be especially important in practice; it can support the formation of customer oriented higher education model. This model – by efficient use of marketing tools and continuous monitoring of satisfaction – will be able to serve the requirements of both students and labour market.