Conclusions of the PhD Thesis
Relationship between visual parameters of seed grains measured with
digital image processing
László Baranyai
PhD Thesis 2001
1. Introduction
Almost as soon as digital computers became available, it was realized that they could be used to process and extract information from digitized images. Initially, work on digital image analysis dealt with specific classes of images such as text, photomicrographs, nuclear particle tracks, and aerial photographs; but by the 1960s, general algorithms and paradigms for image analysis began to be formulated. When the artificial intelligence community began to work on robot vision, these paradigms were extended to include recovery of three−dimensional information, at first from single images of a scene, but eventually from image sequences obtained by a moving camera; at this stage, image analysis had become scene analysis or computer vision. An ’existence proof’ for the feasibility of computer vision tasks is that animals and humans use vision quite effectively in the real world. A possible basis for this is that biological visual systems make use of redundant visual data and process it on redundant
’pathways’. Computer vision systems usually avoid such redundancy in order to reduce computational cost. History of digital image processing over the past half−century led to many elegant mathematical models and algorithms, as well. Real−world visual domains do not satisfy simple mathematical or probabilistic models. The inadequacy of scene models does not imply that computer vision systems will never perform adequately. Indeed, in many areas of application, successful image analysis and computer vision systems have been developed and marketed, even though the classes of scenes involved can be modeled only crudely, and the systems generally make use of ad hoc methods (A.
Rosenfeld, 2000).
There is a growing interest in the grain industry for on−line monitoring of grain. Rapid evaluation of the content of a sample can be used to develop optimum cleaning strategies, make appropriate decisions, and for complete automation of certain operations. Such monitoring would result in increased throughput and enhanced recovery of salvageable grains. A sample of grain may contain seeds of several species and numerous type of impurities. The machine vision system should identify the primary grain from other materials present in a sample. The positive identification of the primary grain and determination of the fractions of small and large seeds in a sample is important in automating the controls of grain cleaning machinery (Shatadal et.al., 1995). In addition, grain−throughput of the combine and the loss of grain at this throughput are used to determine performance of grain harvesting machines. Portion of broken kernels in the separated grain is another important quality criteria in this case (Schneider, Häußer, Kutzbach, 1997). The mentioned quality parameters are usually measured by visual inspection. This type of evaluation takes too long, and allocates valuable human resources (requires well−trained people with experience). Computerized image analysis is an objective and nondestructive method for measurement of morphometrical features such as shape, size, color and surface texture. It allows experts to describe visible attributes accurately. The importance of such support appears in the national and international standards and directives, where hand−picking is still the most important argument in the evaluation of purity of incoming or outgoing cereals.
2. Literature
2.1. Standards
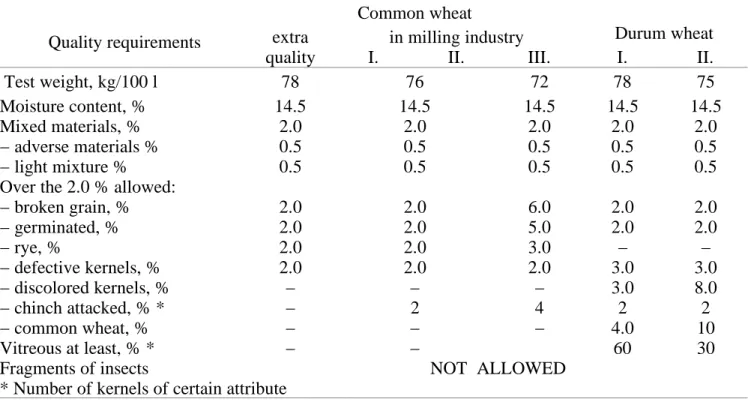
Methodology for inspection of foreign materials is defined in the MSZ 6354/1−2 and MSZ 6367−2 standards in Hungary. This analysis is based on hand−picking. Equipment can help in advance assorting (bolter, aspirator, mixer). The quality report contains weight of the sample, name of the varieties and the number of kernels examined. Two parallel measurements have to be performed. The standard defines the maximum acceptable deviation from the average value. Limits were computed according to the expected differences without any error in the measurement. Quality requirements for wheat of extra quality, classes of wheat for milling industry and durum wheat are shown in Table 1.
Table 1: Quality requirements of wheat standard MSZ 6383 Quality requirements
Common wheat
extra in milling industry Durum wheat
quality I. II. III. I. II.
Test weight, kg/100 l 78 76 72 78 75
Moisture content, % 14.5 14.5 14.5 14.5 14.5
Mixed materials, % 2.0 2.0 2.0 2.0 2.0
− adverse materials % 0.5 0.5 0.5 0.5 0.5
− light mixture % 0.5 0.5 0.5 0.5 0.5
Over the 2.0 % allowed:
− broken grain, % 2.0 2.0 6.0 2.0 2.0
− germinated, % 2.0 2.0 5.0 2.0 2.0
− rye, % 2.0 2.0 3.0 − −
− defective kernels, % 2.0 2.0 2.0 3.0 3.0
− discolored kernels, % − − − 3.0 8.0
− chinch attacked, % * − 2 4 2 2
− common wheat, % − − − 4.0 10
Vitreous at least, % * − − 60 30
Fragments of insects NOT ALLOWED
* Number of kernels of certain attribute
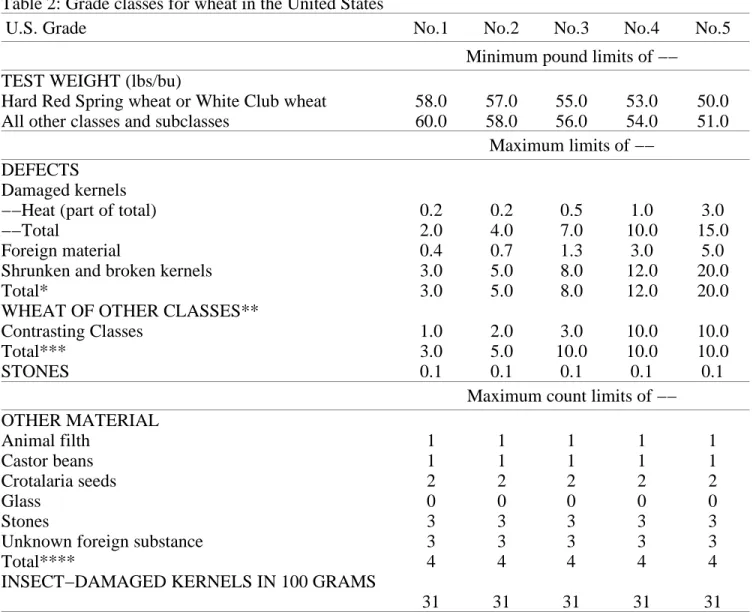
The Official United States Standards for Grain describe the numerical grades for cereals (barley, oats, rye, triticale, wheat, etc.). The lowest grade that may be assigned to any of these grains is "U.S.
Sample grade." This grade is applied to grain that:
Does not come within the grade requirements of any of the numerical grades;
Has a musty, sour, or commercially objectionable foreign odor;
Is heating;
Contains 32 or more insect−damaged kernels per 100 grams (wheat only);
Is contaminated with stones, pieces of glass, toxic seeds, unknown or toxic substances, animal filth, crotalaria seeds, or castor beans;
Is otherwise of distinctly low quality.
Table 2 introduces the numeric grades of United States Grain Standard Act.
Table 2: Grade classes for wheat in the United States
U.S. Grade No.1 No.2 No.3 No.4 No.5
Minimum pound limits of −−
TEST WEIGHT (lbs/bu)
Hard Red Spring wheat or White Club wheat All other classes and subclasses
58.0 60.0
57.0 58.0
55.0 56.0
53.0 54.0
50.0 51.0 Maximum limits of −−
DEFECTS Damaged kernels
−−Heat (part of total)
−−Total
Foreign material
Shrunken and broken kernels Total*
WHEAT OF OTHER CLASSES**
Contrasting Classes Total***
STONES
0.2 2.0 0.4 3.0 3.0 1.0 3.0 0.1
0.2 4.0 0.7 5.0 5.0 2.0 5.0 0.1
0.5 7.0 1.3 8.0 8.0 3.0 10.0
0.1
1.0 10.0
3.0 12.0 12.0 10.0 10.0 0.1
3.0 15.0
5.0 20.0 20.0 10.0 10.0 0.1 Maximum count limits of −−
OTHER MATERIAL Animal filth
Castor beans Crotalaria seeds Glass
Stones
Unknown foreign substance Total****
INSECT−DAMAGED KERNELS IN 100 GRAMS
1 1 2 0 3 3 4 31
1 1 2 0 3 3 4 31
1 1 2 0 3 3 4 31
1 1 2 0 3 3 4 31
1 1 2 0 3 3 4 31
In Table 2:
*Includes damaged kernels (total), foreign material, and shrunken and broken kernels.
**Unclassed wheat of any grade may contain not more than 10.0 percent of wheat of other classes.
***Includes contrasting classes
****Includes any combination of animal filth, castor beans, crotalaria seeds, glass, stones, or unknown foreign substance.
2.2. Grain inspection with digital image processing
2.2.1. Color inspection
Majumdar and Jayas (2000) used red, green, blue, hue, saturation and intensity color parameters with their average value, range and variance. Ranking of color features of individual kernels (independently) suggested red, green and blue average values for classification purposes. Intensity, saturation and hue obtained lower importance. The red−, white− and amber−colored wheat classes were well separated in Canada, according to their mean RGB reflectance properties (Neuman et.al., 1989, I−II.). Discrimination of red spring classes was relatively high (above 90%), but classification of varieties within these groups was not successful. According to the current trends in digital image analysis, average RGB values are usually augmented with surface color distribution parameters. J.
Meuleman and C. van Kaam used unsupervised neural networks in 1997, in order to improve segmentation of leaves, flowers, stamen, stems and background. This clustering approach on a 450−
pattern data set made only one mistake: one pixel of stamen was recognized as leaf.
2.2.2. Shape models
In the work of Marshall, Ellison and Mares (1984; 1986) simple geometric models of wheat grains were analyzed to determine the effects of changes in shape and size on volume per unit surface area and hence potential milling yield. The shape and size of kernels of Australian cultivars were measured and found to be significantly different from the optimum required to maximize volume per unit surface area (spherical shape).For kernels of a given mean volume, the questions of concern to the plant breeder interested in improving milling yield by altering kernel shape and size are:
What are the optimum dimensions of a kernel (length, width and height) so that grain volume per unit surface area and milling yield are maximized?
Is the potential increase in milling yield that can be achieved by altering kernel dimensions large enough to justify selection for optimum grain shape in breeding programs?
Is there sufficient variability in wheat germplasm to develop varieties with optimum grain shape?
Five geometric models were examined: cylinder, rectangular prism, triangular prism, double cone and prolate spheroid. These unrealistic models were used to factor out the best way of improvement of milling yield. Zayas, Pomeranz and Lai in 1989 used more sophisticated morphological parameters.
They selected basic parameters (area, perimeter, length, width, Feret’s diameters at 0°, 45°, 90° and 135°) and derivative parameters to create wheat pattern prototypes (ratio of radius computed from area to radius calculated from perimeter, ratio of perimeter to convex perimeter, ratio of convex perimeter to length, ratio of Feret diameters at 0o/45o and 90o/135o). Shatadal, Jayas, Hehn and Bulley in 1995 classified various seed types into primary grain, small seed and large seed categories. The seed types used in each category were: hard red spring wheat (HRS) and barley as primary grains; canola, brown mustard, yellow mustard, oriental mustard and flaxseed as small seeds; Laird lentils, Eston lentils, pea beans, green peas, black beans and buckwheat as large seeds. The objective of their study was to assess the classification success in identifying HRS wheat and barley from other small and large seeds using morphological features. Orientation of the kernels for camera viewing was random. The following parameters were measured: perimeter, area, width, maximum and minimum radii. The calculated parameters were: rectangular aspect ratio (ratio of length to width), thinness ratio (ratio of square of perimeter to area), radius ratio (ratio of maximum to minimum radii), area ratio (ratio of area to product of length and width) and H−ratio (ratio of mean to standard deviation of all radii). Morimoto, Takeuchi, Miyata and Hashimoto (1998) measured the randomness of perimeter. They used chaotic parameters to detect irregular shapes. Attractors (Singh, Maru and Moharir, 1998; Bünner et.al., 2000;
Gleick, 2000) were drawn to show complexity of radial distances (radii) along the outline of objects.
Morimoto et al. used variable shift and computed fractal dimensions. In Morimoto’s work, attractors assumed the shape of ellipses and the ratio of widths of the smallest (W2) and the largest (W1) was calculated. Threshold values, in order to distinguish between good and badly shaped tomatoes, were from 0.375 to 0.531 for W2/W1 and from 1.464 to 1.514 for fractal dimension. Besides the measurement of chaotic properties, shapes can be compared to a template, an ideal shape profile (Liao et.al., 1993; Firtha, 1998). A corn kernel profile was built by Liao et.al. in 1993 to identify broken kernels. Kernels were divided into three regions: crown, body and tip cap. Eight morphological features were extracted and analyzed with a neural network. This method reached 93.25% accuracy with round kernels and 97.5% with flat kernels, compared to human inspector classification. Firtha (1998) divided the outlines of onions into six regions and estimated them with mathematical functions (constant, exponential and cosine). The coefficients contain all information required to reconstruct shape, to compare the shapes of different varieties or to build the three−dimensional model of this vegetable. Martinovich and Felföldi (1996) used Fast Fourier Transform (FFT), the direct comparison of outlines and the Polar Qualification System (PQS) to evaluate shapes of onion varieties. The Polar Qualification System is a general and powerful data reduction method rooted in the evaluation of near infrared spectra. The quality point of spectra, or any spectra like data set, is defined as the center of its polar spectrum (polar coordinate system, where radius is the function of spectral value and angle is a function of wavelength). Three approaches exist to compute coordinates of the quality point (Kaffka, Gyarmati, 1998): the point, the line and the surface method.
2.2.3. Surface texture analysis
Texture is an important characteristic for the analysis of many types of images. Despite its importance and ubiquity in image data, neither a formal approach nor a precise definition of texture exists. Texture discrimination techniques are for the most part ad hoc (Haralick, Shapiro 1992). Statistical approaches use the autocorrelation function, the spectral power density function, frequency of edges per unit area, spatial gray level co−occurrence probabilities, gray level run−length distributions, relative extrema distributions, and mathematical morphology. The gray level spatial dependence approach characterizes texture by the co−occurrence of its gray levels. The gray level co−occurrence can be specified in a matrix of relative frequencies. The co−occurrence matrix is easy to understand and to compute quickly.
If a vector is used instead of the co−occurrence matrix, the gray level difference spectrum is produced.
Direction has significance because of the increased probability of dependence on texture position (rotation). Scanning direction and distance of compared pixels are defined by the displacement vector(s). In order to minimize dependence on the rotation of object, four directions are suggested: 0°, 45°, 90° and 135° (Jähne, Haußecker, Geißler, 1999, vol.2). As a result, the number of parameters is also increased. Majumdar and Jayas (2000) tested the gray level co−occurrence matrix (GLCM) and gray level run length matrix (GLRM) based approaches. They concluded that the maximum number of gray levels in an image should be reduced from 256 to 8 to reduce computational time and increase accuracy. Fifteen parameters were used: 8 GLRM attributes, 4 GLCM attributes and 3 other (mean value, variance, range). These parameters were measured on individual color signals, gray level, and three color band combinations: G1=(3R+2G+B)/6, G2=(2R+G+3B)/6 and G3=(R+3G+2B)/6.
Classification accuracies were 92.0% (independent data sets) and 92.9% (test data sets).
3. Objectives
The objective of this work was to find visual quality parameters to measure shape, color and surface texture parameters of grains. The main goal was to combine these attributes so that computer programs would be able to distinguish different types of objects: wheat, string−pea, corn, barley, weed seeds, fragments of plants and fragments of insects.
In order to fulfill the objectives and understand the visual properties of objects, the following tasks were planned:
segment the object and background parts of images with high accuracy, even if their intensities are close and they differ only in color (black background and dark brown weed seeds)
model the shape of objects
− with common mathematical functions (sine)
− with polynomial functions
− on the basis of regularity and self−similarity
measure the average color of the surface with less dependence on illumination
determine color distribution and texture of surface
4. Materials and methods
4.1. Materials
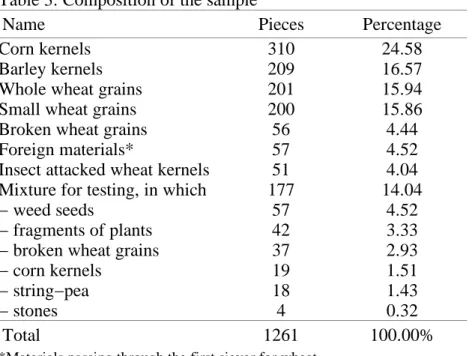
Samples of wheat grains containing impurities were received from the milling industry, and wheat samples of known varieties were received from the National Institute for Quality Control in Agriculture (OMMI, Budapest). Table 3 presents the composition of the sample of seed grains and other materials. Numbers of grains in these parts represented their real occurrence.
Table 3: Composition of the sample
Name Pieces Percentage
Corn kernels 310 24.58
Barley kernels 209 16.57
Whole wheat grains 201 15.94
Small wheat grains 200 15.86
Broken wheat grains 56 4.44
Foreign materials* 57 4.52
Insect attacked wheat kernels 51 4.04 Mixture for testing, in which 177 14.04
− weed seeds 57 4.52
− fragments of plants 42 3.33
− broken wheat grains 37 2.93
− corn kernels 19 1.51
− string−pea 18 1.43
− stones 4 0.32
Total 1261 100.00%
*Materials passing through the first siever for wheat
Subgroups of this quantity were selected to teach and test the classification process. A special mixture (n=177, 14.04%) was separated to test the final version of the statistical evaluation and classification algorithm. The sample of whole wheat grains was divided into two groups: large and small grains. This division was done because whole wheat grains of small size are usually recognized incorrectly.
4.2. Methods
4.2.1. Color measurement
The surface of the selected object was scanned and average intensities of red, green and blue color signals were calculated. To avoid effects of illumination on intensity, normalized values were used in the statistics:
rn= 255⋅¯R
RA ¯¯ GA¯B gn= 255⋅¯G
¯RA¯GA¯B bn= 255⋅¯B
¯RA ¯GA¯B (Eq.1)
4.2.2. Shape models
The following mathematical functions were fit to the outline of objects:
R=aAb⋅sin c⋅αAd (Eq.2)
In case of Eq.2, an elliptic shape is assumed but the period of the sine function is variable. This makes the fitted curve able to estimate asymmetric shapes. However, the generated artificial shapes usually have a gap. Variables of Eq.2 have the following connotations: a = average radius, b = amplitude, c = period of sine function, d = rotation of object in front of the camera.
R=aA bAc⋅sin αAd ⋅sin 2⋅αAe (Eq.3)
Eq.3 uses an elliptic base with deformation. This function is expected to estimate asymmetric figures of whole wheat kernels. Its variables are as follows: a = average radius, b = amplitude, c = degree of deformation, d = rotation of deformation, e = rotation of object in front of the camera.
R=aAb⋅αAc⋅α2Ad⋅α3Ae⋅α4Af⋅α5Ag⋅α6Ah⋅α7Ai⋅α8 (Eq.4)
In the case of polynomial regression, there is no simple way to interpret coefficients (as it was possible with sine functions). A polynomial of power 8 has nine coefficients. There is an additional constant.
Parameters were plotted as a polar diagram, where the angle identifies the coefficients and radii present their values. The quality point of this transformed curve and the area of its covering smallest rectangle were computed.
Chaos in shape means irregularity and complexity. Mathematical transformations were applied to reveal this attribute of polar outlines. Attractors were plotted and trajectories in the phase space were evaluated with the following attributes:
area of the smallest covering square
percentage of area of attractor within this square
perimeter index
Perimeter index is defined as the number of perimeter pixels per unit area, dividing by the average radius (Eq.5). It is a type of density function.
PI= N
¯
R⋅rmaxBrmin 2 (Eq.5)
where N is the length of perimeter in pixels, R means radius and r presents normalized radius. The area of the smallest covering square was divided into 400 identical squares with a 20x20 mesh. Cells containing points of the trajectory were counted to calculate the percentage of the smallest covering area of the attractor. Theoretically, the accuracy was ±0.125%. Using the polar outline data, a 360x360 chaos map was generated, and evaluated according to their visible textures. The whole outline was compressed into a vector of 360 elements, where each item contained the average radius of the corresponding sector of shape (from 0° to 360°). The map visualizes differences of radii, as follows:
map x,y = R x BR y
RmaxBRmin ; x=0..360o and y=0..360o (Eq.6)
This value is scaled between 0 and 1, but limits of 0 and 255 were used to display maps. As a result, there was a 360x360 gray−scaled image. The gray level co−occurrence matrix of two perpendicular directions (0° and 90°) was computed and the following parameters were utilized:
uniformity of energy
entropy
homogeneity
These coefficients describe how homogeneous the image is. These chaotic maps have diagonal symmetry because of the absolute values in Eq.6.
4.2.3. Analysis of surface texture
All points of the object were compared to neighboring points and differences of intensity were collected into histograms. Four histograms were generated: one for gray level differences, and one for each color signal (red, green and blue). Texture analysis on gray−scaled images is a traditional technique to detect periodic patterns of the surface. They measure periodic changes of light parts and shade. This method was extended to color signals to describe color distribution. Polar Qualification System (the point method) was used to compute coordinates of polar quality point of histograms.
4.2.4. Statistical evaluation
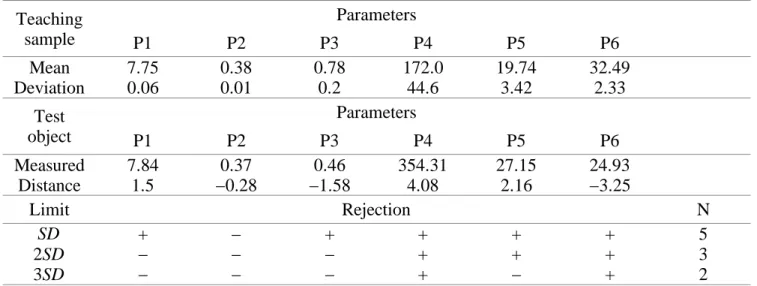
Pairwise discriminant analysis was done to build an optimal decision tree. Besides discriminant analysis, a normalized distance function was applied to evaluate the data sets. It compares attributes to the average of a teaching sample and divides differences by the standard deviation. The advantage of this approach is that distance D is a dimensionless quantity and it is able to compare variables of different features with different scales. Owing to the normalization by the standard deviation, probabilities can be assigned to the results (provided that variables have normal distributions within a specific sub−group of the whole data set).An example of the evaluation method based on these distances is presented in Table 4. A teaching sample set is selected to calculate means and standard deviations. Parameters of test object are compared with these values and the distances are computed.
According to the limiting values for distance, the number of rejected attributes − parameters exceeding the limits − can be counted. If this number is higher than expectations, the object will not be classified into that group.
Table 4: Evaluation process with distance function Teaching
sample
Parameters
P1 P2 P3 P4 P5 P6
Mean 7.75 0.38 0.78 172.0 19.74 32.49
Deviation 0.06 0.01 0.2 44.6 3.42 2.33
Test object
Parameters
P1 P2 P3 P4 P5 P6
Measured 7.84 0.37 0.46 354.31 27.15 24.93
Distance 1.5 −0.28 −1.58 4.08 2.16 −3.25
Limit Rejection N
SD + − + + + + 5
2SD − − − + + + 3
3SD − − − + − + 2
5. Results
There are basically three different types of visual information: shape, color and texture. They are used in human decisions when experts inspect samples. There is a need for one parameter set, so that computers can model the sophisticated human decision−making process. According to the introduced results, the following set was the best:
Shape description. a.) polynomial regression: average radius; quality point of polynomial coefficients: PQSx and PQSy; coefficient of determination: R2 b.) chaotic parameters of attractor:
relative area; covered area of graph on the phase plane; perimeter index c.) symmetry parameters of difference map: uniformity of energy; entropy; homogeneity
Color measurement: normalized color vector: red intensity; green intensity; blue intensity
Texture analysis: quality points of color and gray level difference histograms: quality point for red, green, blue and gray levels.
On the whole, there are 21 parameters: 10 for shape, 3 for color and 8 for texture. The number of parameters belonging to each feature balances the importance of the features. There are 6 chaotic or symmetry attributes out of the 10 shape parameters, which is reasonably assuming that regularity has special dominance in human decisions.
There is quadratic relationship between area of smallest covering rectangle of polar polynomial coefficients and PQSy coordinate of quality point. The fitted function was:
Y = a(x−u)2 + v
Normalization of surface texture histograms before polar qualification decreases distance between classes. They are too close in this case to distinguish and separate successfully.
The following table presents the effectiveness of discriminant analysis of samples.
Correct recognition of samples
Method Wheat Broken wheat Corn
Color information 80.21% 61.28% 96.75%
Sine function of variable period 90.05% 100% 99.03%
Sine function of variable amplitude 97.51% 96.43% 97.42%
Polynomial regression 96.52% 91.07% 97.42%
Chaotic parameters 99.5% 98.21% 99.68%
Surface pattern (gray scaled) 97.4% 98.18% 94.77%
Surface pattern (all color signals) 100% 100% 100%
Optimal parameter set 100% 98.18% 100%
The following table presents effectiveness of classification on the basis of normalized distance function.
Correct recognition (Dmax=3, Nmax=3)
Wheat Broken wheat Corn
100% 89.81% 100%
Pairwise discriminant analysis was performed with optimal parameter set and a decision tree was built.
Optimal decision tree: Input node
Node1 Node2
Node3 Node4 Corn Broken
99.72% 79.00%
Barley Node5 Node6 Foreign
97.00% 100.00%
Wheat Small Insect Mixture
100.00% 56.00% 70.05% 25.00%
Where:
− Node1: wheat and other materials
− Node2: corn and broken wheat grains
− Node3: wheat and barley
− Node4: all foreign materials
− Node5: large and small wheat grains
− Node6: insect damaged kernels and mixture
Valuable grains (wheat, barley) are separated from foreign materials at Node1. At Node1, only 56.12%
of small wheat grains and 56.52% of the mixture follow the correct pathway. In addition, only 57.14%
of mixture was classified correctly at Node4. This is the reason why the mixture sample obtained low classification effectiveness. Large wheat grains and foreign materials (materials passing through the first sieve for wheat) were identified with 100% accuracy.
5.1. New scientific results
The following methods were developed for the special purposes of digital image processing of seed grains and other materials in the sample.
5.1.1. Shape evaluation with sine function of variable period The following sine function was used to fit polar outline of objects:
Y=aAb⋅sin c⋅xAd
where coefficient a means the average radius, b means the amplitude, c is the period (type of shape) and d is the rotation of object in front of the camera.
5.1.2. Shape evaluation with sine function of variable amplitude
The following function was used to model shape of whole wheat grains and distinguish wheat and non−wheat objects.
Y=aA bAc⋅sin xAd sin 2xAe
where a means the average radius, b means the similarity to the elliptic shape, c is the size of asymmetry and d−e computes the position of asymmetric deformation compared to the direction of the major axis.
5.1.3. Polynomial regression
Polynomial of power 8 was used to fit polar outline of objects. As a result of regression, four parameters were calculated: average radius of object, determination coefficient (R2) and coordinates of quality point of polynomial coefficients.
5.1.4. Self−similarity of shape
Self−similarity of shapes were measured with attractors. These delay functions were generated from the polar outline with 25% shift. Trajectories in the phase space were evaluated with the area of the smallest covering square, area of curve within this square and perimeter index. This novel parameter − perimeter index − is a dimensionless quantity and some sort of density function. It includes the length of perimeter of object with unit radius in the unit area of attractor:
PI= N
¯
R⋅rmaxBrmin 2
where N means the length of perimeter in pixels, R is the average radius and r means normalized¯ radius.
5.1.5. Symmetry of shape
Symmetry of shape was measured with difference matrix of polar outline data and its visualization called chaotic map. The following equation transforms polar outline into matrix of differences:
M x;y = RxBRy RmaxBRmin
where M[x;y] is the element of matrix, Rxmeans the radius at angle x, Rmaxis the maximum and Rminis the minimum radius. Statistical parameters were used to identify pattern of chaotic maps: uniformity of energy, entropy and homogeneity.
5.1.6. Surface texture
Differences of intensities on the surface of selected object were collected in histograms and Polar Qualification System (PQS) was used to classify them.
5.1.7. Optimal parameter set
Optimal parameter set of 21 attributes was selected to describe objects. This set is consisting of information about shape (10 parameters: result of polynomial regression and chaotic properties), color (3 parameters) and surface pattern (8 parameters: coordinates of polar quality points).
5.1.8. Classification
New classification method was introduced. A distance function − a dimensionless quantity − was used to compare measure values to the average of the teaching sample. The function is as follows:
D=xB¯x sd
where D is the distance, x is the value of parameter, ¯x means the average value and sd means the standard deviation of parameter in the teaching sample. Classification process used two limiting values: maximum acceptable distance and maximum number of parameters, where value exceeded limit of distance.
6. Publication activity
Textbook:
László Baranyai (2001): Mérnöki számítások C/C++ nyelven (Numeric methods for engineers in C/C++). LSI Oktatóközpont, Budapest (ISBN 963 577 307 2)
Articles in English:
László Baranyai, István Farkas (1998): Shape recognition of different wheat varieties. Proc. of IFAC, Control Applications in Post−Harvest and Processing Technology, Pergamon Elseviere Science, Oxford, 95−97
László Baranyai (1999): Estimating shape of seed grains. Publications of University of Horticulture and Food Industry, vol.58, 49−56
László Baranyai (2001): Classification of seed grains on the basis of their surface pattern. Acta Alimentaria (accepted article)
László Baranyai (2001): Comparison of chaotic properties of shape of seed grains. Hungarian Agricultural Engineering (in press)
László Baranyai (2001): Pattern of chaotic maps. Pattern recognition Letters, Elsevier Science (PATREC 2034)
Full text articles of presentations:
László Baranyai, Ferenc Firtha (1997): Selection of broken kernels by image analysis. Quality Assessment of Plant Products, No.3, 1−4
László Baranyai, Ferenc Firtha (1997): Gabonaszemek szín− és alakjellemzõinek összehasonlítása számítógépes látórendszer felhasználásával. (Comparison of color and shape attributes of seed grains with digital image processing). MTA−AMB Kutatási és Fejlesztési Tanácskozás, Gödöllõ, 274−278
László Baranyai (1998): Búzaszemek alakleíró függvényeinek elemzése (Analysis of mathematical functions to describe shape of wheat grains). MTA−AMB Kutatási és Fejlesztési Tanácskozás, Gödöllõ, 294−297
László Baranyai (2000): Gabonahalmaz összetevõinek vizsgálata felületi mintázatuk alapján (Analysis of surface texture in samples of seed grains). MTA−AMB Kutatási és Fejlesztési Tanácskozás, Gödöllõ
László Baranyai (2000): Visual evaluation of grains. AgEng 2000 Conference Proceedings, Warwick, CD−ROM
László Baranyai (2001): Periodikus jelek kaotikus paramétereinek összehasonlítása (Comparison of chaotic properties of periodic signals). MTA−AMB Kutatási és Fejlesztési Tanácskozás, Gödöllõ
Other articles:
László Baranyai (1999): Kódvita (Discusion on encoding). Új Alaplap, vol.7, 28
László Baranyai (2000): A "házi" kriptográfia (The "home−made" cryptography). Új Alaplap, vol.3, 58−59
Presentations:
László Baranyai (1997): Gabonaszemek szín− és alakjellemzõinek összehasonlítása számítógépes képelemzéssel (Comparison of color and shape attributes of seed grains with digital image processing). OTDK, Keszthely (1st price in section of Food Science)
László Baranyai (1998): Számítógépes alakfelismerési módszerek alkalmazása a minõségbiztositásban (Application of computerized shape recognition in quality control). EOQ Magyar Nemzeti Bizottsága, statisztikai módszerek albizottság ülése, Budapest
Perédi, J. − Szollár, L. − Rischák, K. − Baranyai, L. (1998): A zsírsavöszetétel− módosítás hatása a napraforgóolaj triglicerid−összetételére (Effect of changes in fatty acid content on the triglyceride content of sunflower oil). Lippay János − Vas Károly Tudományos Ülésszak, Budapest
László Baranyai (2000): Termények alakjellemzése kaotikus paramétereikkel (Shape description of grains and vegetables with chaotic parameters). Lippay János − Vas Károly Tudományos Ülésszak, Budapest
László Baranyai (2001): Malomipari alapanyagok minõségének vizsgálata számítógépes látórendszerrel (Digital image processing for quality control in milling industry). EOQ Magyar Nemzeti Bizottsága, statisztikai módszerek albizottság ülése, Budapest
Electronic publications:
László Baranyai (2000): A képfeldolgozás alaplépéseit bemutató program (Basic steps of digital image processing). Új Alaplap, vol.3, CD−ROM
László Baranyai (Internet site): Test images for pattern recognition
http://physics2.kee.hu/baranyai/image.htm (Department of Physics & Control) (Links can be found at AgEng SIG9 and NJSZT−KÉPAF)
Other:
Baranyai, L − Meuleman, J. (1998): Uborka térbeli helyzetének meghatározása üvegházban (Measurement of three−dimensional position of cucumbers in greenhouse). Lippay János − Vas Károly Tudományos Ülésszak, Budapest (poster)
László Baranyai (1998): Three−dimensional imaging of cucmbers in the greenhouse. TEMPUS Report at IMAG−DLO, Wageningen, NL
László Baranyai (1999): Szemes termények felismerése alak− és felületi jellemzõik alapján (Identification of seed grains on the basis of shape and texture parameters). MTA−AMB Kutatási és Fejlesztési Tanácskozás, Gödöllõ
7. References
F.J. Adamsen, P.J. Pinter Jr., E.M. Barnes, R.L. LaMorte, G.W. Wall, S.W. Leavitt, B.A. Kimball /1999/
Measuring wheat senescence with a digital camera Crop Science, vol.39, 719−724
H. Bunke, M. Zumbühl /1999/
Acquisition of 2D shape models from scenes with overlapping objects using string matching Pattern Analysis & Applications, vol.2, 2−9
M.J. Bünner, M. Ciofni, A. Giaquinta, R. Hegger, H. Kantz, R. Meucci, A. Politi /2000/
Reconstruction of systems with delayed feedback: I. Theory The European Physical Journal, vol.10, 165−176
K.G. Campbell, C.J. Bergman, D.G. Gualberto, J.A. Anderson, M.J. Giroux, G. Hareland, R.G. Fulcher, M.E. Sorrells, P.L. Finney /1999/
Quantitative trait loci associated with kernel traits in a soft x hard wheat cross Crop Science vol.39, 1184−1195
CIE Central Bureau in Vienna
CIE 15.2−1986 Tables (x,y,z for 2° and 10°; Colour stimulus functions) http://www.ping.at/CIE
S. Chaturvedi, P.D. Drummond /1999/
Stochastic diagrams for critical point spectra The European Physical Journal, vol.8, 251−267 Codex Alimentarius Hungaricus 2−61/1997
Milling products
T.G. Crowe, M.J. Delwiche /1996/
A system for fruit defect detection in real−time AgEng ’96, Madrid, Paper No. 96F−023 EEC No. 2731/75, 29 October 1975
Regulation of standard qualities for common wheat, rye, barley, maize and durum wheat in the European Community
EEC No. 1454/82, 18 May 1982
Regulation of standard qualities for common wheat, rye, barley, maize and durum wheat in the European Community
EEC No. 1028/84, 31 March 1984
Regulation of standard qualities for common wheat, rye, barley, maize and durum wheat in the European Community
EEC No. 2094/87, 13 July 1987
Regulation of standard qualities for common wheat, rye, barley, maize, sorghum and durum wheat in the European Community
EEC No. 689/92, 16 March 1992
Fixing the procedure and conditions for the taking−over of cereals by intervention agencies EEC No. 2054/93, 19 July 1993
Regulation of standard qualities for common wheat, rye, barley, maize, sorghum and durum wheat in the European Community
EEC No. 2594/97, 18 December 1997
Regulation of standard qualities for common wheat, rye, barley, maize, sorghum and durum wheat in the European Community
R.P. Ewing, R. Horton /1999/
Quantitative color image analysis of agronomic images.
Agronomy Journal, vol.91, 148−153
Federal Grain Inspection Service /1999/
1998 U.S. grain exports: quality report
U.S. Department of Agriculture, 1−4; 21−22; 35−37 F. Firtha /1998/
Természetes objektumok alakjának leírása (Description of shape of natural objects) János Lippay − Károly Vas International Scientific Symposium, Budapest
J. Gleick /2000/
Káosz. Egy új tudomány születése (Chaos. Making a new science) Göncöl Kiadó, Budapest
Z. Gyõri, I. Mile Gyõriné /1998/
A búza minõsége és minõsítése (Quality and qualification of wheat) Mezõgazdasági Szaktudás Kiadó, Budapest
Y.J. Han, Y. Feng, C.L. Weller /1996/
Frequency domain image analysis for detecting stress cracks in corn kernels Applied Engineering in Agriculture, vol.12, 487−492
R.M. Haralick, L.G. Shapiro /1992/
Computer and robot vision.
Addison−Wesley Publishing Company, Inc., 453−505 B. Jähne, H. Haußecker, P. Geißler /1999a/
Handbook of computer vision and applications. Volume 1. Sensors and Imaging.
Academic Press, San Diego
B. Jähne, H. Haußecker, P. Geißler /1999b/
Handbook of computer vision and applications. Volume 2. Signal processing and pattern recognition.
Academic Press, San Diego
B. Jähne, H. Haußecker, P. Geißler /1999c/
Handbook of computer vision and applications. Volume 3. Systems and applications.
Academic Press, San Diego K.J. Kaffka, L.S. Gyarmati /1998/
Investigating the polar qualification system
Journal of Near Infrared Spectroscopy, vol.6, A191−A200
K. Liao, M.R. Paulsen, J.F. Reid, B.C. Ni, E.P. Bonifacio−Maghirang /1993/
Corn kernel breakage classification by machine vision using a neural network classifier Transactions of the ASAE, vol.36, 1949−1953
Gy. Lukács /1982/
Színmérés (Colorimetry)
Mû szaki Könyvkiadó, Budapest, 131−134; 142 S. Majumdar, D.S. Jayas /2000/
Classification of cereal grains using machine vision: I. Morphology models Transactions of the ASAE, vol.43, 1669−1675
S. Majumdar, D.S. Jayas /2000/
Classification of cereal grains using machine vision: II. Color models Transactions of the ASAE, vol.43, 1677−1680
S. Majumdar, D.S. Jayas /2000/
Classification of cereal grains using machine vision: III. Texture models Transactions of the ASAE, vol.43, 1681−1687
S. Majumdar, D.S. Jayas /2000/
Classification of cereal grains using machine vision: IV. Combined morphology, color and texture models.
Transactions of the ASAE, vol.43, 1689−1694 D.R. Marshall, F.W. Ellison, D.J. Mares /1984/
Effects of grain shape and size on milling yields in wheat. I. Theoretical analysis based on simple geometric models.
Australian Journal of Agricultural Research vol.35, 619−630 D.R. Marshall, D.J. Mares, H.J. Moss, F.W. Ellison /1986/
Effects of grain shape and size on milling yields in wheat. II. Experimental studies Australian Journal of Agricultural Research vol.37, 331−342
L. Martinovich, J. Felföldi /1996/
Measurement of homogeneity of onion (Allium cepa L.) varieties and lines using computer based shape and colour analyses.
Horticultural Science, vol.28., 69−75 MathWorks Inc. /2000/
Image processing toolbox. User’s guide The MathWorks, Inc.
J. Meuleman, C. van Kaam /1997/
Unsupervised image segmentation with neural networks
3rd International Conference on Sensors in Horticulture, Tiberias, Israel T. Morimoto, T. Takeuchi, H. Miyata, Y. Hashimoto /1998/
Pattern recognition of fruit shape on the basis of chaos using neural networks CAPPT 2nd International Workshop, Budapest, 125−130
MSZ 6354/1−1989 MSZ 6354/2−82 MSZ 6367:2001 MSZ 6383
H. Naumann, G. Schröder /1983/
Bauelemente der Optik. Taschenbuch für Konstrukteure Carl Hanser Verlag München Wien, 391
M.R. Neuman, H.D. Sapirstein, E. Shwedyk, W. Bushuk /1989/
Wheat grain colour analysis by digital image processing I. Methodology Journal of Cereal Science, vol.10, 175−182
M.R. Neuman, H.D. Sapirstein, E. Shwedyk, W. Bushuk /1989/
Wheat grain colour analysis by digital image processing II. Wheat class discrimination Journal of Cereal Science, vol.10, 183−188
G. Palubinskas, R.M. Lucas, G.M. Foody, P.J. Curran /1995/
An evaluation of fuzzy and texture−based classification approaches for mapping regenerating tropical forest classes from Landsat−TM data
International Journal of Remote Sensing, vol.16, 747−759 J.R. Piggott /1986/
Statistical procedures in food research
Elsevier Applied Science Publishers Ltd., Essex Gy. Popper, F. Csizmás /1993/
Numerikus módszerek mérnököknek (Numeric methods for engineers) Akadémiai Kiadó
A. Rosenfeld /2000/
Image analysis and computer vision. The past half−century IAPR Newsletter vol.22, No.1,
J. Schanda /2000/
Colorimetry (in: Handbook of Applied Colorimetry, edited by C. DeCusatis) Am. Inst. of Physics, Woodbury, New York, 327−412
H. Schneider, M. Häußer, H.D. Kutzbach /1997/
Optimize grain quality by broken kernel detection Quality Assessment of Plant Products, 25−28 P. Shatadal, D.S. Jayas, J.L. Hehn, N.R. Bulley /1995/
Seed classification using machine vision
Canadian Agricultural Engineering vol.37, No.3, 163−167 P. Shatadal, D.S. Jayas, N.R. Bulley /1995/
Digital image analysis for software separation and classification of touching grains: I.
Disconnect algorithm
Transactions of the ASAE, vol.38, 635−643 P. Shatadal, D.S. Jayas, N.R. Bulley /1995/
Digital image analysis for software separation and classification of touching grains: II.
Classification
Transactions of the ASAE, vol.38, 645−649 R. Singh, V.M. Maru, P.S. Moharir /1998/
Complex chaotic system and emergent phenomena Journal of Nonlinear Science, vol.8, 235−259 T. Szirányi, J. Zerubia /1997/
Markov random field image segmentation using cellular neural network IEEE Transactions on Circuits and Systems, vol.44, 86−89
R.K. Tiwari, K.N.N. Rao /1999/
Phase space structure, attractor dimension, Lyapunov exponent and nonlinear prediction from Earth’s atmospheric angular momentum time series
Pure and Applied Geophysics, vol.156, 719−736 United States Grain Standard Act
T. Vízhányó /1999/
PQS method for analysis of mushroom spectral characteristics Publ. Univ. Horticulture and Food Industry, vol.58, 27−34 I.Y. Zayas, C.R. Martin, J.L. Steele, A. Katsevich /1996/
Wheat classification using image analysis and crush−force parameters Transactions of the ASAE, vol.39, 2199−2204
I. Zayas, Y. Pomeranz, F.S. Lai /1989/
Discrimination of wheat and nonwheat components in grain samples by image analysis Journal of Cereal Chemistry, vol.66, 233−237