arXiv:1907.07446v1 [nucl-ex] 17 Jul 2019
activation
Gy. Gy¨urky,1,∗ Z. Hal´asz,1 G.G. Kiss,1 T. Sz¨ucs,1 A. Cs´ık,1 Zs. T¨or¨ok,1 R. Husz´ank,1 M.G. Kohan,2 L. Wagner,3, 4,† and Zs. F¨ul¨op1
1Institute for Nuclear Research (Atomki), H-4001 Debrecen, Hungary
2Department of Engineering Sciences and Mathematics, Lule˚a University of Technology, 97187 Lule˚a, Sweden
3Helmholtz-Zentrum Dresden-Rossendorf, Germany
4Technische Universit¨at Dresden, Germany (Dated: July 18, 2019)
Background The14N(p,γ)15O reaction plays a vital role in various astrophysical scenarios. Its reaction rate must be accurately known in the present era of high precision astrophysics. The cross section of the reaction is often measured relative to a low energy resonance, the strength of which must therefore be determined precisely.
Purpose The activation method, based on the measurement of15O decay, has not been used in modern measurements of the
14N(p,γ)15O reaction. The aim of the present work is to provide strength data for two resonances in the14N(p,γ)15O reaction using the activation method. The obtained values are largely independent from previous data measured by in-beam gamma-spectroscopy and are free from some of their systematic uncertainties.
Method Solid state TiN targets were irradiated with a proton beam provided by the Tandetron accelerator of Atomki using a cyclic activation. The decay of the produced 15O isotopes was measured by detecting the 511 keV positron annihilation γ-rays.
Results The strength of the Ep= 278 keV resonance was measured to beωγ278= (13.4±0.8) meV while for the Ep= 1058 keV resonanceωγ1058= (442±27) meV.
Conclusions The obtained Ep= 278 keV resonance strength is in fair agreement with the values recommended by two recent works. On the other hand, the Ep= 1058 keV resonance strength is about 20 % higher than the previous value. The discrepancy may be caused in part by a previously neglected finite target thickness correction. As only the low energy resonance is used as a normalization point for cross section measurements, the calculated astrophysical reaction rate of the14N(p,γ)15O reaction and therefore the astrophysical consequences are not changed by the present results.
PACS numbers: 26.20.Cd,25.40.Lw
I. INTRODUCTION
Catalytic cycles of hydrogen burning represent an al- ternative way to the pp-chains for converting four pro- tons into one alpha particle in stellar interiors and for providing thus the energy source of stars. The simplest cycle is the first CNO or Bethe-Weizs¨acker cycle [1] where carbon, nitrogen and oxygen isotopes are involved. The CNO cycle is the dominant energy source of main se- quence stars more massive than about 1.3 solar masses but it also plays an important role in various astrophys- ical scenarios including quiescent and explosive burning processes [2, 3, e.g.].
In the 21th century, astronomical observations as well as astrophysical models are becoming more and more pre- cise. The insufficient knowledge of nuclear reaction rates often represent the largest uncertainty of stellar models.
Increasing the precision of experimental nuclear cross sec- tions is thus needed in order to provide accurate reaction rates for the models. For solar models, for example, a
∗Electronic address: gyurky@atomki.mta.hu
†Present address: National Superconducting Cyclotron Labora- tory, Michigan State University, East Lansing, USA
precision well below 5 % is required for the14N(p,γ)15O reaction discussed in the present work [4].
The slowest reaction of the CNO cycle is the radia- tive proton capture of14N and therefore the rate of this
14N(p,γ)15O reaction determines the rate of the cycle and hence its efficiency and its contribution to the stellar en- ergy generation. Realizing its importance, many experi- ments have been devoted to the measurement of its cross section (the full list of references can be found in [5] and the three latest sets of results are published in [6–8]).
Depending on the astrophysical site, the relevant tem- perature where the CNO cycle is active and important is between about 15 and 200 MK. This translates into as- trophysically relevant center-of-mass energy ranges (the Gamow-window) of the14N(p,γ)15O reaction between 20 and 200 keV. Measured cross sections are available only down to 70 keV. Consequently, for lower temperature en- vironments (like for example our Sun with its 15.7 MK core temperature) theoretical cross sections or extrapo- lation of the available data are necessary.
At low energies the 14N(p,γ)15O reaction proceeds mostly through the direct capture mechanism with con- tribution from wide resonances. The total cross section is dominated by the capture to theEx= 6.79 MeV excited states in15O but the capture to the ground state and to theEx= 6.17 MeV excited state also contributes signifi-
cantly. At higher energies, on the other hand, where cross section data are available, transitions to other states as well as narrow and wide resonances play important roles.
A. The importance of theEp= 278 keV resonance
The extrapolation of the cross section to astrophysical energies is typically carried out using the R-matrix ap- proach. For a reliable R-matrix extrapolation, high pre- cision experimental data in a wide energy range is needed for all the relevant transitions and for the resonances as well as for the direct capture.
AtE= 259 keV center-of-mass energy the14N(p,γ)15O reaction exhibits a strong narrow resonance. Its energy is too high for any direct astrophysical relevance, however, it plays an important role in the experiments targeting the 14N(p,γ)15O cross section measurement. In direct kinematics this resonance is observed at Ep= 278 keV proton energy and often serves as a normalization point for the measured non-resonant cross section data, i.e.
the cross section is measured relative to the strength of this resonance. Therefore, the precision of this resonance strength directly influences the precision of the cross sec- tion data at low energies.
The available measured Ep= 278 keV resonance strength values are summarized in Table I. Based on several measurements, the recommended value of the strength has an uncertainty of 4.6 %, as given by the lat- est compilation of solar fusion reactions [5]. In the paper of Daigleet al. [6] published after the above cited com- pilation, a new result was presented and the literature data were also critically re-analyzed. Their recommended value is in agreement with that of [5] but its uncertainty is reduced to 2.4 %. This uncertainty seems surprisingly low considering on one hand the stopping power uncer- tainty which is common to almost all the experiments and on the other hand the difficulty in characterizing the implanted targets used by Daigleet al. [6].
In the present work the Ep= 278 keV resonance strength is measured using an independent method, the activation technique [9]. As an additional result, the strength of theEp= 1058 keV resonance in 14N(p,γ)15O reaction is also measured. This resonance plays no role in astrophysics, but it can also be used as a reference point for the14N(p,γ)15O non-resonant cross section measure- ments and an R-matrix extrapolation of experimental data also requires the knowledge of the parameters of this resonance. Although this resonance is stronger than theEp= 278 keV one, its strength has been measured in fewer experiments (see Table II) and the precision of the strength recommended by Martaet al. is not better than about 5 %.
B. The activation method for the study of the
14N(p,γ)15O reaction
The proton capture of 14N at the Ep= 278 keV and Ep= 1058 keV resonances leads to the formation of 15O in excited states ofEx= 7556 keV andEx= 8284 keV, re- spectively. These excited states decay to the15O ground state by the emission of promptγ-radiation through sev- eral possible cascades. The detection of thisγ-radiation has been used in almost all the experiments to determine the resonance strengths (see the entries in tables I and II labeled as ’prompt gamma’). For a precise resonance strength measurement the γ-detection efficiency (up to 8 MeVγ-energy), the angular distribution of the various transitions as well as the branching ratio of these transi- tions (including the weak ones) must be known precisely.
All these factors introduce systematic uncertainties in the resonance strength determination.
Since the reaction product of the 14N(p,γ)15O reac- tion is radioactive, the resonance strength can also be measured by activation. 15O decays by positron emis- sion to 15N with a half-life of 122.24±0.16 s [20]. The decay is not followed by the emission of γ-radiation, however, the 511 keV γ-ray following the positron an- nihilation provides a possibility for the reaction strength measurement with activation. This method is free from some uncertainties encumbering the prompt gamma ex- periments. The decay occurs isotropically, thus no angu- lar distribution needs to be measured. The γ-detection efficiency must be known only at a single, low energy point (511 keV) where it is measured more easily than at several MeV’s. Since by the activation method the number of produced isotopes is measured, this technique provides directly the total reaction cross section or res- onance strength (independent from the decay scheme of the exited levels) and therefore no uncertainty arises from weak transitions.
The activation method was used only by some very first studies of the 14N(p,γ)15O reaction about 70 years ago (see tables I and II) and these measurements did not lead to precise resonance strengths. In the present work this method is used again to provide precise resonance strength values which are largely independent from the ones measured with prompt gamma detection. The next section provides details of the experimental procedure while the data analysis is presented in Sec. III. The final results, their comparison with available data and conclu- sions are given in Sec. IV.
II. EXPERIMENTAL PROCEDURE A. Target preparation and characterization In many of the past experiments solid state titanium- nitride (TiN) targets proved to be an excellent choice to carry out ion-beam induced reaction studies on nitrogen isotopes [7, 8, 19, 21, e.g.]. TiN can be produced at
TABLE I: AvailableEp= 278 keV resonance strength data in the literature
Reference Year Method Resonance strength
ωγ278/meV
E.J. Woodburyet al. [10] 1949 activation 10
D.B. Duncan, J.E. Perry [11] 1951 activation 20
S. Bashkinet al. [12] 1955 prompt gamma 13 ± 3
D.F. Hebbardet al. [13] 1963 prompt gamma 14 ± 2
H.W. Beckeret al.[14] 1982 prompt gamma 14 ± 1
R. C. Runkleet al. [15] 2005 prompt gamma 13.5 ± 1.2
G. Imbrianiet al. [16] 2005 prompt gamma 12.9 ± 0.9
D. Bemmereret al.[17] 2006 prompt gamma 12.8 ± 0.6
S. Daigleet al. [6] 2016 prompt gamma 12.6 ± 0.6
recommended by E.G. Adelbergeret al. [5] 2011 13.1 ± 0.6
recommended by S. Daigleet al. [6] 2016 12.6 ± 0.3
TABLE II: AvailableEp= 1058 keV resonance strength data in the literature
Reference Year Method Resonance strength
ωγ1058/meV
D.B. Duncan, J.E. Perry [11] 1951 activation 630
D.F. Hebbardet al. [13] 1963 prompt gamma 394
U. Schr¨oderet al. [18] 1987 prompt gamma 310 ± 40
M. Martaet al. [19] 2010 prompt gamma 364 ± 21
recommended by M. Martaet al. [19] 2010 353 ± 18
the required thickness and purity and these targets can withstand intense beam bombardment. The Ti:N atomic ratios are typically found to be very close to 1:1 in such targets.
Considering the advantages, solid state TiN targets were used also in the present work. They were pre- pared by reactive sputtering of TiN onto 0.5 mm thick Ta backings at the Helmholtz-Zentrum Dresden-Rossendorf, Germany. The nominal thicknesses of the TiN layers were between 100 and 300 nm, but for the purpose of the resonance strength measurements presented here, only 300 nm thick targets were used. This corresponds to roughly 1.5×10¹⁸ N atoms/cm2.
For the resonance strength determination, the total thickness of the targets does not play a role (as long as the thick target assumption holds, see Sec. III). The stoichiometry, i.e. the Ti:N ratio, on the other hand, is a crucial parameter as discussed in Sec. III. The Ti:N ratio and the amount of impurities were therefore mea- sured with three independent methods: SNMS, RBS and PIXE, as described below. For these measurements, TiN layers sputtered onto Si wafers were used. These samples had been prepared together with the actual targets on Ta backings in the same sputtering geometry and therefore the layer compositions are the same.
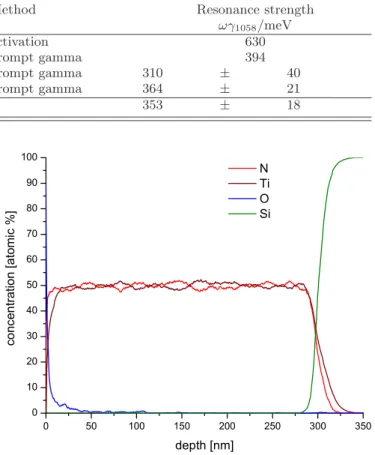
Secondary Neutral Mass Spectrometry (SNMS) tech- nique was used to measure the target composition as a function of the depth of the layer. The measurement was done with the INA-X type (SPECS GmbH, Berlin) SNMS facility of Atomki [22, 23]. Figure 1 shows a typ- ical SNMS profile of a 300 nm target. Besides the small
FIG. 1: Concentration of the various elements in the target as a function of depth measured with the SNMS technique.
amount of oxygen contamination on the surface, no ele- ments other than nitrogen and titanium were observed.
The Ti:N ratio was found to be uniform along the thick- ness of the target within the statistical fluctuation of the data and the average ratio is 1.015±0.051. The uncer- tainty includes the statistical component (less than 1 %) and a 5 % systematic uncertainty.
Rutherford Backscattering Spectrometry (RBS) was also used to measure the target composition. A 1.6 MeV
FIG. 2: A typical measured and simulated RBS spectrum.
TABLE III: Measured Ti:N ratios of the used targets. The adopted ratio is the weighted average of the results of the three methods.
Method Ti:N atomic ratio
SNMS 1.015 ± 0.051
RBS 0.976 ± 0.048
PIXE 0.981 ± 0.064
adopted 0.991 ± 0.031
α-beam provided by the 5 MV Van de Graaff accelerator of Atomki was focused onto the targets in an Oxford type microbeam setup [24]. The scatteredα-particles were de- tected by two ion-implanted Si detectors positioned at 135 and 165 degrees with respect to the incoming beam direction. Figure 2 shows a typical RBS spectrum. Based on the evaluation of the RBS spectra with the SIMNRA code [25], a Ti:N ratio of 0.976±0.048 was determined.
The uncertainty includes the fit uncertainty and a 3 % systematic one characterizing the general accuracy of the used RBS system which was assessed based on the mea- sured thickness reproducibility of several RBS standards.
Using the same microbeam setup as for the RBS mea- surement, the targets were also studied with Proton In- duced X-ray Emission (PIXE) [24]. The targets were bombarded by a 2.0 MeV proton beam and the induced X-rays were detected by a silicon drift X-ray detector.
A typical X-ray spectrum can be seen in Fig. 3. Owing to the thin window of the detector, characteristic X-rays of nitrogen could be detected with good accuracy and a Ti:N ratio of 0.981±0.064 was obtained. Here the un- certainty include a 3 % systematic component.
Table III summarizes the results of the target stoi- chiometry measurements. All three results are in excel- lent agreement with the expected 1:1 ratio. Based on the weighted average, 0.991±0.031 is adopted as the Ti:N ratio for the resonance strength calculations.
FIG. 3: PIXE spectrum of a TiN target. Major elements included in the fit are labeled.
HPGe detector
Target Vacuum gauge port
Cabling for collimator and electron suppression
Target chamber
Pump port Accelerator port Collimator water cooling
10 cm Lead shielding
Beam
FIG. 4: Drawing of the target chamber used for the activa- tions
B. Activations
The proton beams for the excitation of the studied resonances in the14N(p,γ)15O reaction were provided by the Tandetron accelerator of Atomki. The energy cali- bration of the accelerator has been carried out recently [26] and that was used for setting the energies for the res- onance studies. As the resonances are relatively strong, no high beam intensity was necessary which was useful to avoid target deterioration. The typical beam intensity was 5µA on target.
The applied beam energies for the study of the 278 keV and 1058 keV resonances wereEp= 300 keV and Ep= 1070 keV, respectively. These values correspond to the middle of the yield curve plateau, where the maxi- mum yield can be reached. See the discussion in Sec. III.
The schematic drawing of the target chamber can be seen in Fig. 4. The beam enters the chamber through a water cooled collimator of 5 mm in diameter. Behind the collimator, an electrode biased at -300 V is placed to suppress secondary electrons emitted from the target
or from the collimator. After the collimator the whole chamber serves as a Faraday-cup to measure the charge carried by the beam to the target. The measured charge was used to determine the number of protons impinging on the target.
C. Detection of the annihilation radiation As the half-life of the 15O reaction product is rather short (about two minutes), the induced activity was mea- sured without removing the target from the activation chamber. A 100 % relative efficiency HPGe γ-detector was therefore placed close behind the target. The dis- tance between the target and the detector end-cap was about 1 cm.
In order to increase the number of detected decay, the cyclic activation method was applied. The target was ir- radiated for 5 minutes and then the beam was stopped in the low energy Faraday cup of the accelerator and the decay was measured for 10 or 20 minutes. This cycle was repeated many times (up to 30 cycles in a singe irradia- tion campaign).
In order to follow the decay of 15O, the number of events in the region of 511 keV peak (selected by gating with a single channel analyzer) was recorded in five sec- ond time intervals using an ADC in multichannel scaling mode. Figure 5 shows typical examples of the recorded number of counts as a function of time. The upper panel shows a case measured on the Ep= 278 keV resonance with 10 minute counting intervals, while the lower panel represents a measurement on the Ep= 1058 keV reso- nance with 20 minute counting intervals. During the 5 minutes irradiation intervals the events in the detec- tor were disregarded as in these periods the counts were dominated by beam induced background.
D. Determination of the detector efficiency For the absolute measurement of the resonance strengths the absolute detection efficiency of the HPGe detector must be known in the counting geometry used.
In the present case of a positron decaying isotope, the positron annihilation does not occur in a point-like geom- etry and hence the precise determination of the detection efficiency is not trivial.
The positrons leave the decaying15O nucleus with typ- ically several hundreds of keV energy (the positron end- point energy is 1732 keV [20]). The positrons which travel towards the target backing stop within a few 100µm (thus well inside the backing) and annihilate therefore in a quasi point-like geometry. On the other hand, those positrons which leave towards the other direction, will move into the vacuum chamber and travel freely until they hit the walls of the chamber. Therefore, their anni- hilation takes place in an extended and not well defined geometry.
FIG. 5: Number of events detected by the HPGe detector at the 511 keV peak region as a function of time using 5 second time bins. The fit to the data including a time-independent laboratory background component and using the known half- life of15O is also shown. The upper and lower panels show the Ep= 278 keV andEp= 1058 keV measurements, respectively.
For the latter case the fit residuals are also plotted in order to indicate that the decay of15O alone fits well the measured data, no other radioactivity was present in significant amount.
This is also confirmed by the reducedχ2 value of the fit being very close to unity.
In such a situation the direct efficiency measurement with calibrated radioactive sources is not possible. In- stead, an indirect method using the following procedure was applied. As a first step, longer-lived positron emit- ters were produced in the activation chamber. For this purpose 18F (t1/2= 109.77±0.05 min, produced by the
18O(p,n)18F reaction) and13N (t1/2= 9.965±0.004 min, produced by the12C(p,γ)13N reaction) were chosen. The decay of these sources was measured with the HPGe de- tector standing next to the chamber (the one which was used for the14N(p,γ)15O reaction) for typically 1-2 half-
lives. This measurement gives information about the ef- ficiency in the non-trivial extended geometry. Then the sources were removed from the chamber, transferred to another HPGe detector (used in many recent experiments and characterized precisely, see e.g. [27]) where the decay was followed for several half-lives. At this detector the sources were placed in a position which guaranteed the point-like geometry, i.e. the sources were placed between 0.5 mm thick Ta sheets which stopped the positrons com- pletely. The absolute efficiency of this HPGe detector in the used geometry was measured with calibrated ra- dioactive sources to a precision of 3 %. The measurement with the second detector provided the absolute activity of the sources and – knowing precisely the half-lives and the elapsed time between the two countings – the ab- solute efficiency of the first detector could be obtained.
The efficiency obtained with 18F and 13N sources were in agreement within the statistical uncertainties of 0.7 % and 1.5 %, respectively.
In addition to the measurements with 18F and 13N, the same procedure was followed also with the actual
15O isotope produced by the14N(p,γ)15O reaction. Here the short half-life resulted in a higher statistical uncer- tainty of 2.5 %, but the obtained efficiency was in agree- ment with the results from18F and13N. Based on these measurements the final efficiency is determined with a precision of 4 %.
III. DATA ANALYSIS
As it can be seen by the red line in Fig. 5, the 511 keV count rate can be well fitted with a constant background plus an exponential decay with the 15O half-life. With the known detection efficiency and the decay parameters of 15O the only free parameter of the fit is the yield of the reaction (i.e. the number of reactions per incident proton) which can be related to the resonance strength.
With the thick target assumption (i.e. when the ener- getic thickness of the target ∆E is much larger than the natural width Γ of the resonance), the resonance strength ωγcan be related to the yieldY measured on the top of the resonance by the following formula:
ωγ=2ǫeffY
λ2 (1)
whereλis the de Broglie wavelength at the resonance en- ergy in the center of mass system andǫeff is the effective stopping power. If the thick target condition is not met, the maximum yieldYmaxmeasured in the middle of the resonance curve plateau can be related to the ideal thick target yield leading to the following correction factor [28]:
f ≡ Ymax
Y = 2
πtan−1∆E
Γ . (2)
Based on the target characterizations presented in Sec. II A, the energetic thickness of the targets used for the present experiments at the two studied resonances
was ∆E278= 51.9 keV and ∆E1058= 24.4 keV, respec- tively with about 5 % uncertainty. The natural widths of the two resonances (taken from the literature) are Γ278= 1.12±0.03 keV [29] and Γ1058= 3.8±0.5 keV [19].
These lead to correction factors of f278= 0.986±0.001 and f1058= 0.902±0.015. Here the uncertainties take into account the resonance widths, the target thickness and the beam energy uncertainties. The latter one mea- sures how precisely the maximum of the resonance curve is found. It is evident that in the case of the astrophys- ically more important low energy resonance this correc- tion is very close to unity and its uncertainty is negligible.
This is owing to the larger target thickness at this low energy and the small natural width of the resonance.
The effective stopping powerǫeff in the case of a target composed of Ti and N can be obtained as
ǫeff =ǫN+NTi
NN
ǫTi (3)
whereǫN and ǫTi are the stopping powers of N and Ti, respectively, taken at the resonance energy andNTi/NN
is the Ti:N atomic ratio as discussed in Sec. II A.
The stopping power was taken from the 2013 version of the SRIM code [30]. The following values were used:
• ǫN(278 keV) = 10.72 eV/(1015 atoms/cm2),
• ǫN(1058 keV) = 4.733 eV/(1015atoms/cm2),
• ǫTi(278 keV) = 22.81 eV/(1015 atoms/cm2),
• ǫTi(1058 keV) = 10.80 eV/(1015atoms/cm2).
As for Ti, the stopping power was measured by N.
Sakamotoet al. [31] with very good precision of better than 1 %. The measured values are in excellent agree- ment with the SRIM data, never deviating more than 2 %, Therefore, an uncertainty of 2 % is assigned toǫTi
in the present work. The situation is somewhat worse in the case of nitrogen. The stopping power measured with gaseous N can be different from the solid form (see e.g.
[32] for the stopping power dependence on the chemical form). Therefore, 4 % uncertainty is assigned to ǫN as recommended by SRIM. The uncertainty of the effective stopping power was calculated taking into account the uncertainty of the measured Ti:N ratio and considering theǫTi and ǫN values uncorrelated. The isotopic abun- dance of14N in natural nitrogen (99.6337 %) was taken into account in the calculation ofǫeff.
For the determination of the resonance strength, the non-resonant component of the reaction yield must be subtracted from the resonant yield. In the case of the Ep= 1058 keV resonance the yields below and above the resonance – atEp= 1000 keV and Ep= 1150 keV – were measured. Based on these measurements a 2.7 % nonres- onant contribution to the resonant yield was determined.
This non-resonant yield was subtracted from the resonant yield and a conservative relative uncertainty of 20 % was assigned to it, leading to a 0.6 % uncertainty of the de- termined resonance strength.
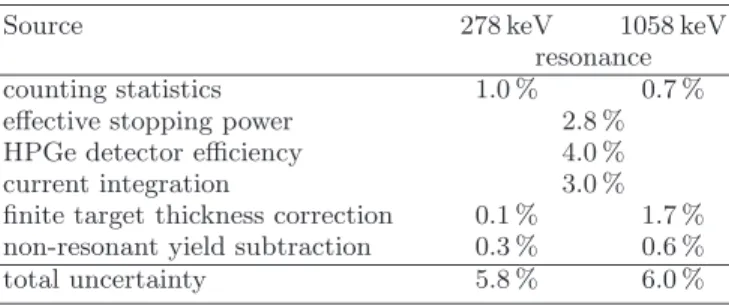
TABLE IV: Components of the resonance strength uncertain- ties
Source 278 keV 1058 keV
resonance
counting statistics 1.0 % 0.7 %
effective stopping power 2.8 %
HPGe detector efficiency 4.0 %
current integration 3.0 %
finite target thickness correction 0.1 % 1.7 % non-resonant yield subtraction 0.3 % 0.6 %
total uncertainty 5.8 % 6.0 %
In the case of the Ep= 278 keV resonance the off- resonant reaction yield was below the detection limit.
Based on some recent experiments, a cross section of about 1.5×10⁻⁸ barns can be expected at this energy [7, 8]. Such a cross section leads to a calculated non- resonant yield which is 0.3 % of the resonant yield. This tiny contribution is subtracted from the yield and - as this value is not based on our own measurement - a 100 % relative uncertainty is assigned to it.
Table IV lists the uncertainties of the final resonance strength values. As the studied resonances are relatively strong and the cyclic activations were carried out many times, the statistical uncertainty of theγ-counting is very low compared to the other sources of uncertainty. The quoted total uncertainty is the quadratic sum of the com- ponents. Other uncertainties (like for example the uncer- tainties of the15O decay parameters) are well below 1 % and are therefore neglected.
IV. RESULTS AND CONCLUSIONS The obtained strengths of the two studied resonances are the following:
• ωγ278= (13.4±0.8) meV,
• ωγ1058= (442±27) meV.
If we take into account the total uncertainties, the new result for theEp= 278 keV resonance strength is in good agreement with the adopted values recommended by the Solar Fusion II compilation [5] as well as by the more recent work of S. Daigle et al. [6] (see Table I). We do not quote here a new recommended value, we just note that considering our new value determined with an in- dependent technique, the strength recommended by the
Solar Fusion II compilation [5] and especially its some- what higher uncertainty seems more appropriate than the value of S. Daigleet al. [6] with its very small error bar.
The results of those experiments where theEp= 278 keV resonance is used as a normalization point, do not change by the present result. Therefore, the astrophysical con- sequences are also unchanged.
The strength of the Ep= 1058 keV resonance, on the other hand, was measured to be significantly higher than the ones determined in the two most recent works (see Table II). One reason can be that the finite target thick- ness correction might not have been done in those ex- periments. In the case of U. Schr¨oderet al. [18] there is no information about this in the paper. In the case of M. Marta et al. [19] it is confirmed that no such a correction has been applied [33]. Based on the informa- tion available in [19] and [34], the correction should be about 7 %. This would lead to a resonance strength of ωγ1058= (389±22) meV. This value still differs from the present one by about two standard deviations [35]. Con- sequently, as opposed to theEp= 278 keV resonance, this strength value is rather uncertain and further measure- ments would be required.
As a summary, the activation technique was success- fully used in the present work for the14N(p,γ)15O reac- tion and precise resonance strength values were derived.
This technique can also be applied for the measurement of the non-resonant14N(p,γ)15O cross section. Such an experiment is in progress using the setup introduced here.
The results will be presented in a forthcoming publica- tion. As the activation method provides data which are complementary to the prompt gamma data, the combina- tion of the results can lead to more precise cross section of the14N(p,γ)15O astrophysical key reaction.
Acknowledgments
This work was supported by NKFIH grants K120666 and NN128072, by the ´UNKP-18-4-DE-449 New National Excellence Program of the Human Capacities of Hungary and by the COST Association (ChETEC, CA16117).
G.G. Kiss acknowledges support form the J´anos Bolyai research fellowship of the Hungarian Academy of Sci- ences. The authors thank I. Rajta, I. Vajda, G. Solt´esz and Zs. Sz˝ucs for providing excellent beams and working conditions at the Tandetron accelerator.
[1] M. Wiescher, Physics in Perspective 20, 124 (2018), ISSN 1422-6960, URL https://doi.org/10.1007/s00016-018-0216-0.
[2] S. Degl’Innocenti, G. Fiorentini, B. Ricci, and F. Villante, Physics Letters B
590, 13 (2004), ISSN 0370-2693, URL
http://www.sciencedirect.com/science/article/pii/S0370269304005283.
[3] C. E. Fields, F. X. Timmes, R. Farmer, I. Peter- mann, W. M. Wolf, and S. M. Couch, The Astrophys- ical Journal Supplement Series 234, 19 (2018), URL
https://doi.org/10.3847%2F1538-4365%2Faaa29b.
[4] W. C. Haxton and A. M. Serenelli, The As- trophysical Journal 687, 678 (2008), URL https://doi.org/10.1086%2F591787.
[5] E. G. Adelberger, A. Garc´ıa, R. G. H. Robertson, K. A. Snover, A. B. Balantekin, K. Heeger, M. J.
Ramsey-Musolf, D. Bemmerer, A. Junghans, C. A.
Bertulani, et al., Rev. Mod. Phys.83, 195 (2011), URL https://link.aps.org/doi/10.1103/RevModPhys.83.195.
[6] S. Daigle, K. J. Kelly, A. E. Champagne, M. Q. Buckner, C. Iliadis, and C. Howard, Phys. Rev. C 94, 025803 (2016), URL https://link.aps.org/doi/10.1103/PhysRevC.94.025803.
[7] Q. Li, J. G¨orres, R. J. deBoer, G. Imbriani, A. Best, A. Kontos, P. J. LeBlanc, E. Uberseder, and M. Wi- escher, Phys. Rev. C 93, 055806 (2016), URL https://link.aps.org/doi/10.1103/PhysRevC.93.055806.
[8] L. Wagner, S. Akhmadaliev, M. Anders, D. Bemmerer, A. Caciolli, S. Gohl, M. Grieger, A. Junghans, M. Marta, F. Munnik, et al., Phys. Rev. C97, 015801 (2018), URL https://link.aps.org/doi/10.1103/PhysRevC.97.015801.
[9] G. Gy¨urky, Z. F¨ul¨op, F. K¨appeler, G. G. Kiss, and A. Wallner, The European Physical Jour- nal A 55, 41 (2019), ISSN 1434-601X, URL https://doi.org/10.1140/epja/i2019-12708-4.
[10] E. J. Woodbury, R. N. Hall., and W. A. Fowler, Proceed- ings of the American Physical Society75, 1462 (1949).
[11] D. B. Duncan and J. E. Perry,
Phys. Rev. 82, 809 (1951), URL
https://link.aps.org/doi/10.1103/PhysRev.82.809.
[12] S. Bashkin, R. R. Carlson, and E. B. Nel- son, Phys. Rev. 99, 107 (1955), URL https://link.aps.org/doi/10.1103/PhysRev.99.107.
[13] D. Hebbard and G. Bailey, Nuclear Physics 49, 666 (1963), ISSN 0029-5582, URL
http://www.sciencedirect.com/science/article/pii/0029558263901305.
[14] H. W. Becker, W. E. Kieser, C. Rolfs, H. P. Trautvet- ter, and M. Wiescher, Zeitschrift f¨ur Physik A Atoms and Nuclei 305, 319 (1982), ISSN 0939-7922, URL https://doi.org/10.1007/BF01419080.
[15] R. C. Runkle, A. E. Champagne, C. Angulo, C. Fox, C. Iliadis, R. Longland, and J. Polla- nen, Phys. Rev. Lett. 94, 082503 (2005), URL https://link.aps.org/doi/10.1103/PhysRevLett.94.082503.
[16] G. Imbriani, H. Costantini, A. Formicola, A. Vomiero, C. Angulo, D. Bemmerer, R. Bonetti, C. Brog- gini, F. Confortola, P. Corvisiero, et al., The European Physical Journal A - Hadrons and Nuclei 25, 455 (2005), ISSN 1434-601X, URL https://doi.org/10.1140/epja/i2005-10138-7.
[17] D. Bemmerer, F. Confortola, A. Lemut, R. Bonetti, C. Broggini, P. Corvisiero, H. Costantini, J. Cruz, A. Formicola, Z. F¨ul¨op, et al., Nuclear Physics A 779, 297 (2006), ISSN 0375-9474, URL
http://www.sciencedirect.com/science/article/pii/S0375947406005902.
[18] U. Schr¨oder, H. Becker, G. Bogaert, J. G¨orres, C. Rolfs, H. Trautvetter, R. Azuma, C. Camp- bell, J. King, and J. Vise, Nuclear Physics A 467, 240 (1987), ISSN 0375-9474, URL
http://www.sciencedirect.com/science/article/pii/0375947487905288.
[19] M. Marta, E. Trompler, D. Bemmerer, R. Beyer, C. Broggini, A. Caciolli, M. Erhard, Z. F¨ul¨op, E. Grosse, G. Gy¨urky, et al., Phys. Rev. C81, 055807 (2010), URL https://link.aps.org/doi/10.1103/PhysRevC.81.055807.
[20] F. Ajzenberg-Selove, Nuclear Physics A 523, 1 (1991), ISSN 0375-9474, URL
http://www.sciencedirect.com/science/article/pii/037594749190446D.
[21] A. Formicola, G. Imbriani, H. Costantini, C. Angulo, D. Bemmerer, R. Bonetti, C. Broggini, P. Corvisiero, J. Cruz, P. Descouvemont, et al., Physics Letters B591, 61 (2004).
[22] H. Oechsner, Applied Surface Science 70- 71, 250 (1993), ISSN 0169-4332, URL
http://www.sciencedirect.com/science/article/pii/016943329390437G.
[23] K. Vad, A. Cs´ık, and G. Langer, Spectroscopy Europe 21, 13 (2009), ISSN 0966-0941.
[24] R. Husz´ank, L. Csedreki, Z. Kert´esz, and Z. T¨or¨ok, Journal of Radioanalytical and Nuclear Chem- istry 307, 341 (2016), ISSN 1588-2780, URL https://doi.org/10.1007/s10967-015-4102-9.
[25] M. Mayer, SIMNRA version 6.06, URL http://home.mpcdf.mpg.de/~mam/.
[26] I. Rajta, I. Vajda, G. Gy¨urky, L. Csedreki, Z. Kiss, S. Biri, H. van Oosterhout, N. Podaru, and D. Mous, Nuclear Instruments and Meth- ods in Physics Research Section A: Accelerators, Spectrometers, Detectors and Associated Equip- ment 880, 125 (2018), ISSN 0168-9002, URL
http://www.sciencedirect.com/science/article/pii/S0168900217311622.
[27] G. Gy¨urky, A. Ornelas, Z. F¨ul¨op, Z. Hal´asz, G. G.
Kiss, T. Sz¨ucs, R. Husz´ank, I. Horny´ak, I. Rajta, and I. Vajda, Phys. Rev. C 95, 035805 (2017), URL https://link.aps.org/doi/10.1103/PhysRevC.95.035805.
[28] W. A. Fowler, C. C. Lauritsen, and T. Lau- ritsen, Rev. Mod. Phys. 20, 236 (1948), URL https://link.aps.org/doi/10.1103/RevModPhys.20.236.
[29] M. Borowski, K. P. Lieb, M. Uhrmacher, and W. Bolse, AIP Conference Proceedings 1090, 450 (2009), URL https://aip.scitation.org/doi/abs/10.1063/1.3087064.
[30] J. Ziegler, SRIM-2013 software code, URL http://srim.org/.
[31] N. Sakamoto, H. Ogawa, and H. Tsuchida, Nu- clear Instruments and Methods in Physics Research Section B: Beam Interactions with Materials and Atoms 164-165, 250 (2000), ISSN 0168-583X, URL
http://www.sciencedirect.com/science/article/pii/S0168583X99010885.
[32] G. Reiter, H. Baumgart, N. Kniest, E. Pfaff, and G. Clausnitzer, Nuclear Instruments and Methods in Physics Research Section B: Beam Interactions with Ma- terials and Atoms27, 287 (1987), ISSN 0168-583X, URL
http://www.sciencedirect.com/science/article/pii/0168583X87905672.
[33] D. Bemmerer, private communication.
[34] M. Marta, Ph.D. thesis, TU Dresden, Germany (2011).
[35] The subtraction of the non-resonant component in [19]
may also be overestimated. According to [34], the off- resonance measurement below the resonance was done at 1049 keV, where the contribution from the low energy tail of the resonance can still be about 5 %