www.afm-journal.de
Hybrid FeNiOOH/α-Fe 2 O 3 /Graphene Photoelectrodes with Advanced Water Oxidation Performance
Attila Kormányos,* Egon Kecsenovity, Alireza Honarfar, Tönu Pullerits, and Csaba Janáky*
In this study, the photoelectrochemical behavior of electrodeposited FeNiOOH/Fe2O3/graphene nanohybrid electrodes is investigated, which has precisely controlled structure and composition. The photoelectrode assembly is designed in a bioinspired manner where each component has its own function: Fe2O3 is responsible for the absorption of light, the graphene framework for proper charge carrier transport, while the FeNiOOH overlayer for facile water oxidation. The effect of each component on the photoelec- trochemical behavior is studied by linear sweep photovoltammetry, incident photon-to-charge carrier conversion efficiency measurements, and long-term photoelectrolysis. 2.6 times higher photocurrents are obtained for the best- performing FeNiOOH/Fe2O3/graphene system compared to its pristine Fe2O3 counterpart. Transient absorption spectroscopy measurements reveal an increased hole-lifetime in the case of the Fe2O3/graphene samples. Long-term photoelectrolysis measurements in combination with Raman spectroscopy, however, prove that the underlying nanocarbon framework is corroded by the photogenerated holes. This issue is tackled by the electrodeposition of a thin FeNiOOH overlayer, which rapidly accepts the photogenerated holes from Fe2O3, thus eliminating the pathway leading to the corrosion of graphene.
DOI: 10.1002/adfm.202002124
Dr. A. Kormányos, E. Kecsenovity, Prof. C. Janáky Department of Physical Chemistry and Materials Science University of Szeged
Szeged H-6720, Hungary
E-mail: attila.kormanyos@chem.u-szeged.hu; janaky@chem.u-szeged.hu A. Honarfar, Prof. T. Pullerits
Chemical Physics and NanoLund Lund University
Box 124 Lund 22100, Sweden Prof. C. Janáky
ELI-ALPS
ELI-HU Non-Profit Ltd.
Wolfgang Sandner utca 3, Szeged H-6728, Hungary
The ORCID identification number(s) for the author(s) of this article can be found under https://doi.org/10.1002/adfm.202002124.
in the form of chemical bonds.[1] Design of semiconductor (SC)-based nanocom- posite materials has come to the forefront of research during recent years. In these studies, the various elementary steps of the PEC process—such as light absorption (exciton formation), the transport-, and transfer of the photogenerated charge car- riers—can be separated.[2–4] This approach is inspired by natural photosynthesis where CO2 and H2O is converted into chemicals in a complex, multi-step pro- cess (each of them facilitated by different subsystems) using the energy of sun- light.[5] This strategy seems necessary, since no single material was discovered so far, which would simultaneously fulfill all requirements that are necessary to drive PEC processes (such as hydrogen evolu- tion, CO2 reduction, and water oxidation) efficiently and cost-effectively.[6,7]
One of the most extensively studied n-type SC photoelectrodes is hematite (α- Fe2O3 denoted as Fe2O3 in the following), due to its narrow bandgap (EBG = 2.0–2.2 eV), and appropriate valence band (VB) position to drive the PEC water oxidation process.[8–11] Additionally, it is non-toxic, abundant, and stable in alkaline solutions.[12–14] Although, a maximum of 16.8% solar- to-hydrogen conversion efficiency can be calculated from the bandgap,[8,15] real device performances are still far behind.[16]
The low charge carrier mobility (<1 cm2 V−1 s−1),[13] and short charge carrier lifetime[15] together result in small charge carrier diffusion length (2–4 nm).[17,18] This means that the majority of photogenerated charge carriers are lost before they could reach the substrate in the electrolyte solution. On top of this, low absorption coefficient[19] and sluggish water oxidation kinetics further limits the efficiency of the overall PEC process.
Several strategies have been employed to overcome these issues, among which doping and nanostructuring are the two most prominent. For example, doping of Fe2O3 with various elements—such as Si,[20] Ti,[13] Mo,[21] and Sn[22]—can signifi- cantly increase the charge carrier mobility and concentration.
Nanostructured hematite architectures improved the relative volume of the space-charge layer in comparison to the bulk, which resulted in reduced charge carrier recombination and thus in higher photocurrents.[23] One very interesting approach is the combination of hematite with plasmonic gold nanohole array, which resulted in a tenfold increase of the
1. Introduction
Photoelectrochemical (PEC) solar fuel generation is considered as a potential one-step strategy to store the energy of sunlight
© 2020 The Authors. Published by WILEY-VCH Verlag GmbH & Co.
KGaA, Weinheim. This is an open access article under the terms of the Creative Commons Attribution-NonCommercial License, which permits use, distribution and reproduction in any medium, provided the original work is properly cited and is not used for commercial purposes.
PEC performance compared to a low-performing bare hema- tite sample.[24]
SCs can be combined with various nanostructured carbon materials (such as graphene[25] or carbon nanotubes)[26] to facilitate the separation and transport of the photogenerated charge carriers, leading to enhanced PEC behavior. An addi- tional advantage of this synergistic combination is the improved photostability of the hybrids compared to their pristine SC coun- terparts.[26] This concept has been already applied for various inorganic SC, such as ZnO,[27] TiO2,[28] BiVO4,[29] and Cu2O,[25,26]
etc. There are also few examples, where Fe2O3 was combined with nanocarbons, such as reduced graphene oxide,[30–32]
graphene,[11,33,34] carbon nanotubes,[35] and carbon quantum dots.[36] Interestingly, in most of these studies, the nanocarbon component is located on the top of the Fe2O3 layer,[11,30,32] thus the enhanced PEC behavior is rooted in the passivation of the surface states of Fe2O3 by the nanocarbon overlayer, thereby decreasing surface recombination. The sluggish water oxidation kinetics can be alleviated by the deposition of co-catalyst over- layers such as Co-Pi,[18] FeOOH,[37] NiOOH,[38] NiFeOx,[39] Ir,[40]
and IrO2.[23] Notably, the term “co-catalyst” is used in a broader sense here, as a surface layer that helps to improve the per- formance of the photoelectrode. Its contribution can be either accelerating the kinetics of the water oxidation reaction; or the passivation the surface states suppressing recombination. Irre- spective from the mechanism, both of these contribution results in higher photocurrent density compared to the pristine semi- conductor counterpart. As a result of the complex structural-, and surface modifications, PEC performance of hematite photo- electrodes has been greatly improved over the years. The state- of-the-art systems are presented in Table 1.
Considering the presented improvements in the above studies, Fe2O3 seems to be an ideal candidate to demonstrate the effect of the various components (e.g., dopants, conductive nanoscaffolds, co-catalyst overlayers) on the PEC performance, and to precisely identify the exact role of each component. Specifically, the charge carrier dynamics of Fe2O3 has been extensively studied by both ex situ and in situ transient absorption spectroscopy (TAS) meas- urements.[20,45–47] Contrastingly, there are only two studies on the charge carrier dynamics of Fe2O3/nanocarbon nanocomposites,
where the charge carrier lifetime was greatly increased either by the reduced graphene oxide under-,[30] or graphene (GR) over- layer.[11] However, no detailed quantification of the measured data can be obtained from these reports. In general, to the best of our knowledge, there is no comprehensive study, where the effect of multiple constituents of a Fe2O3 based hybrid electrodes on the charge carrier dynamics were simultaneously probed on a broad timescale. Such exercise is indeed necessary to follow all events from the charge carrier separation, through the transport, to transfer, and recombination processes.[48]
In this work we investigated the PEC behavior of FeNiOOH/
Fe2O3/GR nanocomposite photoelectrodes, synthesized by electrodeposition. Electrodeposition allowed to assemble the three-component nanohybrid in a precise manner, where both structural-, and morphological attributes were carefully con- trolled. We investigated the effect of the Fe2O3/GR ratio as well as that of the co-catalyst loading on the PEC properties. While the highest measured photocurrent was 1.2 mA cm−2 in the case of the pristine Fe2O3 electrode, 2.5 and 3.1 mA cm−2 photo- currents were harvested for its GR-, and co-catalyst-containing counterparts. Finally, the effect of each component on the charge carrier dynamics was identified by PEC, TAS, and intensity- modulated photocurrent spectroscopy (IMPS) measurements.
2. Results and Discussion
2.1. Electrodeposition of Fe2O3/GR Nanocomposites
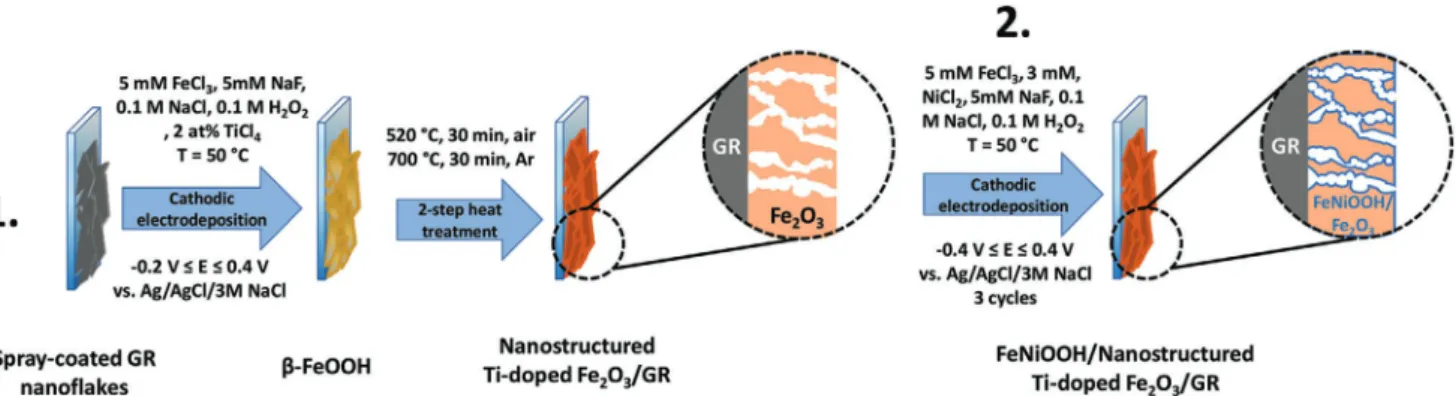
The Fe2O3/GR nanocomposite photoelectrodes were synthe- sized in three steps: i) spray-coating of GR on FTO, ii) electro- deposition of β-FeOOH on GR, iii) two-step heat treatment of β-FeOOH/GR to yield Fe2O3/GR (Scheme 1). In the first step, GR nanoflakes were spray-coated on a FTO-coated glass, from their ethanol-based suspension. This process resulted in an inter- connected nanocarbon network on the surface of the substrate electrode. The amount of the spray-coated GR was held con- stant throughout this study, namely: the electrochemically acces- sible surface area of GR was approximately three-times higher compared to a bare FTO electrode. Prior to the electrodeposition Table 1. PEC performance of state-of-the-art hematite photoelectrodes and PEC performance of the best electrodeposited hematite photoelectrodes.
Name Synthesis method Photocurrent density IPCE (λ = 500 nm) Ref.
α-Fe2O3 nanorods with TiO2 overlayer and Co-Pi catalyst
Chemical bath deposition 6 mA cm−2 at 1.23 V vs RHE in 1 m KOH, 100 mW cm−2 AM 1.5G illumination
≈5% [41]
Ru-doped α-Fe2O3 nanorods Doctor blading 5.7 mA cm−2 at 1.23 V versus RHE in 1 m NaOH, 100 mW cm−2 AM 1.5G illumination
43% [42]
Interconnected α-Fe2O3 nanosheets with Ag NPs and Co-Pi
Anodization 4.68 mA cm−2 at 1.23 V versus RHE in 1 m NaOH, 100 mW cm−2 AM 1.5G illumination
≈10% [43]
Nanostructured α-Fe2O3 with IrO2 NPs Atmospheric pressure chemical vapor deposition
≈3 mA cm−2 at 1.23 V versus RHE in 1 m NaOH, 100 mW cm−2 AM 1.5G illumination
≈22% [23]
Nanostructured α-Fe2O3 Electrodeposition 1.6 mA cm−2 at 1.6 V versus RHE in 1 m NaOH, 100 mW cm−2 AM 1.5G illumination
– [44]
Nanostructured Zn-, and Ti-doped α-Fe2O3 Electrodeposition 1.5 mA cm−2 at 1.23 V versus RHE in 1 m NaOH, 100 mW cm−2 300 W Xe lamp
≈2.5% [13]
Nanostructured Ti-, and Zr-doped α-Fe2O3 with Co(NO3)2
Electrodeposition ≈0.6 mA cm−2 at 1.23 V versus RHE in 1 m KOH, 100 mW cm−2 AM 1.5G illumination
≈3% [19]
of β-FeOOH, a conditioning step was carried out in the electrodep- osition solution to ensure the proper wetting of the GR nanoflakes and to remove any entrapped gas from the layer (potential cycling in a range where no Faradaic event occurs). This step was followed by the electrodeposition of β-FeOOH on the GR surface. Electro- deposition was chosen as a synthesis tool due to its beneficial fea- tures, most importantly: i) it allows high control over the thickness and morphology of the electrodeposited film, ii) it is faster com- pared to other synthesis methods, such as atomic layer deposition or solid state synthesis, iii) it is possible to homogeneously coat rough and complex surfaces, iv) the Fe2O3 layer inherently deposits on the GR surface, and thus an intimate contact forms between them. The thickness of Fe2O3 (in other words, the composition of the hybrid electrodes) was precisely tuned by varying the electro- deposition charge density. Pristine Fe2O3 layers were also synthe- sized on bare FTO as a comparison. Since the thickness of Fe2O3 can greatly influence PEC properties (e.g., insufficient light absorp- tion for thin layers, higher degree of recombination for thicker layers) synthesis conditions were chosen in a way to make results obtained for bare Fe2O3 and its GR-containing counterparts fully comparable. Thus, electrodeposition charge densities were normal- ized by the real surface area, thus the Fe2O3 layer thicknesses were identical both in the case of the pristine and the GR-containing photoelectrodes. The final step was the heat treatment of the elec- trodes under air/Ar (in the case of the nanostructured electrodes) to transform β-FeOOH to α-Fe2O3. All synthesis steps along with the experimental conditions are summarized in Scheme 1.
Elemental composition of Fe2O3 surface was determined with X-ray photoelectron spectroscopy (XPS). According to the survey scans (Figure S1, Supporting Information), all Fe2O3 samples contain Fe, O, Ti, and Sn (besides adventitious carbon).
To quantify the amount of each element, high resolution scans were also recorded (Figure S2, Tables S1 and S2, Supporting Information). The surface of the Fe2O3 sample mostly consist of O atoms (79.8 at%), which is followed by Fe (16.3 at%). The amount of Ti was around 3.0 at%. The positions of the Ti 2p peaks suggest that Ti is present in the sample as Ti4+. Similar conclusions apply for Sn, which is present in as small amount as 0.9 at%. The presence of Sn can be explained by the tempera- ture of the second heat treatment step, which allowed the dif- fusion of Sn from the underlying FTO to the Fe2O3 lattice.[22,49]
Morphological characteristics of the bare Fe2O3, GR, and the nanocomposite films were first studied by scanning electron
microscopy (SEM). Images taken of pristine Fe2O3 are presented in Figure S3, Supporting Information. The nanostructured Fe2O3 layer consists of granular, oval-shaped particles, with an average size of ≈100 nm, homogeneously coating the FTO sur- face, similarly to precedent literature.[50,51] The GR nanoflakes covered the FTO surface (Figure 1A). The average flake size was 1090 ± 50 nm. The morphology of the Fe2O3/GR nanocom- posites strongly depended on the composition. At high Fe2O3 loading (450 mC cm−2), for example, the GR nanoflakes were mostly and homogeneously covered by Fe2O3 (Figure 1B). For layers, containing less Fe2O3 (QED = 70 mC cm−2) islands were formed, leaving the surface of the nanoflakes partially exposed.
If the amount of Fe2O3 was more than 450 mC cm−2, all gaps among the nanoflakes were filled with Fe2O3, showing a similar morphology as in the case of the pristine Fe2O3 photoelectrode.
To estimate the average layer thickness (QED = 450 mC cm−2) of both systems, cross-section SEM images were recorded (Figure S4, Supporting Information), which revealed layer thicknesses of 220 ± 40 and 440 ± 90 nm for the Fe2O3 and Fe2O3/GR films, respectively.
Transmission electron microscopy (TEM) images fur- ther confirmed the composite formation, as both the Fe2O3 nanocrystals and the underlying GR nanoflakes are visible (Figure 1D–F). HR-TEM revealed lattice fringes in the case of the Fe2O3 nanoparticles, suggesting high crystallinity all the way to the edges of the particles. Interplanar spacings of 0.370 and 0.260 nm were determined, corresponding to the [012] and [110] lattice planes of α-Fe2O3, respectively.[50]
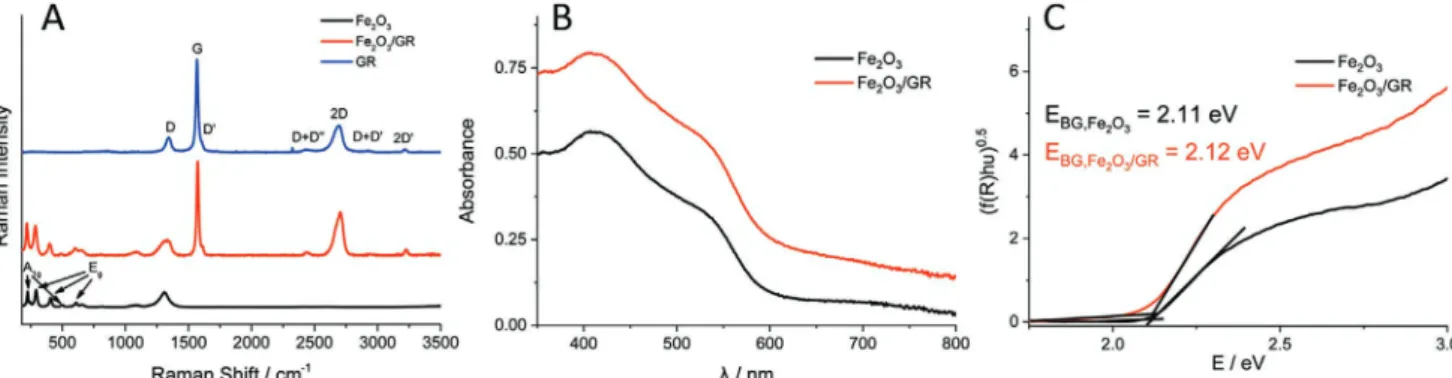
Figure 2A compares the Raman spectra recorded for the Fe2O3/GR nanocomposite sample and its pristine components.
All Raman-active bands are present on the spectrum of GR (Figure 2A, blue curve; Table S3, Supporting Information).[52]
The small D/G ratio (0.158) and the position of the 2D band (2688 cm−1) implies that few-layer graphene flakes are present in our samples.[52] In the case of the Fe2O3 film (Figure 2A, red curve) five out of the seven characteristic bands can be iden- tified, further confirming the chemical nature of the deposit.
Bands centered at 220 and 504 cm−1 are corresponding to the A1g modes, while the ones, appeared at 288, 401, and 613 cm−1 are originated from the Eg modes of α-Fe2O3.[53] Since Fe2O3 is an antiferromagnetic material, collective spin movement can be excited in it (this is called a magnon). The band cen- tered at 1315 cm−1 corresponds to a two-magnon scattering, Scheme 1. Schematic illustration of synthesis methods applied for the preparation of the nanohybrid electrodes samples: 1) cathodic electrodeposi- tion of Fe2O3 and 2) surface decoration with FeNiOOH co-catalyst. Detailed description of the methods can be found in the Experimental Section.
which appeared from the interaction of two magnons created on antiparallel close spin sites.[54] As for the Fe2O3/GR nano- composite electrode, all bands assigned both to GR and Fe2O3 are present on the spectrum (Figure 2A, red curve). Moreover, the presence of the D+D″, 2D, D+D′, and 2D′ bands in the nanocomposite is a direct proof that GR did not get oxidized during the synthetic procedure.[55] Finally, Raman bands of Fe2O3 are slightly (an average of 5 cm−1) blue-shifted in the nanocomposite, implying an interaction between GR and Fe2O3.
2.2. Optical and Photoelectrochemical Properties
Optical properties of Fe2O3 and Fe2O3/GR films were studied by UV–vis spectroscopy (Figure 2B). Three absorption features can be observed on the spectrum of bare Fe2O3, originating from the ligand d–d and from the direct O2p → Fe4s transitions.[47,56]
As for Fe2O3/GR, the only difference is a non- characteristic absorption, shifting the baseline throughout the whole spectral
range.[57] Tauc analysis was performed (Figure 2C),[58,59] and indirect bandgaps of 2.11 and 2.12 eV were calculated, in good agreement with literature values.[60]
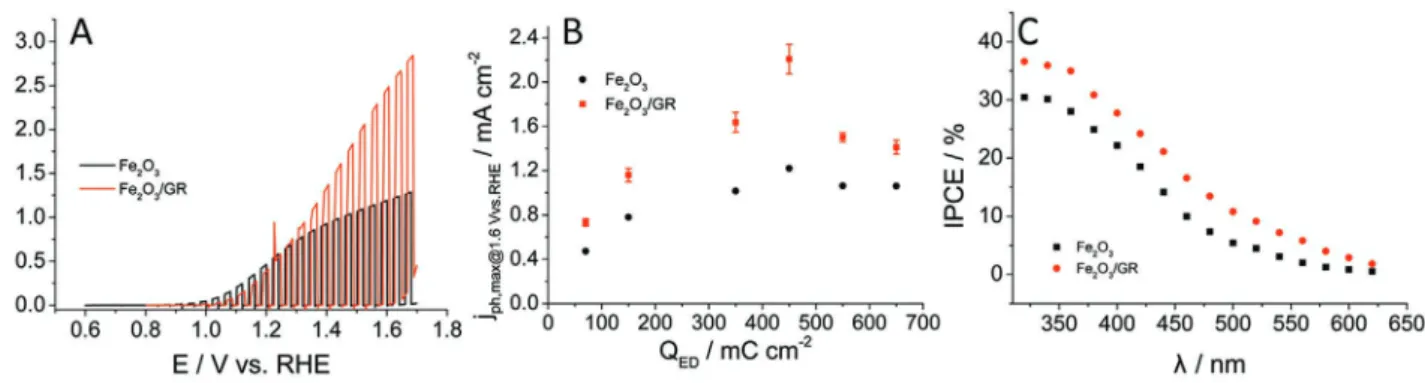
To estimate PEC water oxidation performance, linear sweep photovoltammograms (LSV) were recorded in 1 m NaOH solution (Figure 3A). Three major conclusions can be promptly made by looking at these photovoltammograms: i) signifi- cantly higher photocurrents were harvested in the case of the GR- containing layer, ii) dark currents start to develop ear- lier, and iii) the onset potential slightly shifted (≈200 mV) toward more positive potentials in the case of the nanocom- posite sample. This last phenomenon can be explained by the difference between the interfaces with the underlying FTO elec- trode surface. While the Fe2O3/FTO is a semiconductor/semi- conductor junction, the Fe2O3/GR contains a semiconductor/
metal interface. In addition, the temperature of the second heat treatment step (700 °C) is high enough for Sn to diffuse into the Fe2O3 structure, thus additionally doping it (see XPS results below). According to the literature, this slightly shifts onset potentials as well as increases the photocurrent.[22,49] The
Figure 2. A) Raman spectra recorded for Fe2O3, GR and Fe2O3/GR thin films. QED was 450 mC cm−2 in both cases. B) UV–vis spectra recorded for Fe2O3 and Fe2O3/GR thin films. Similar compositions were used as for (A). C) Tauc plots constructed from diffuse reflectance spectra recorded for Fe2O3 and Fe2O3/GR thin films.
Figure 1. SEM images captured for A) GR-coated FTO, B) Fe2O3/GR nanocomposite photoelectrode (QED = 450 mC cm−2), and for C) the same sample as (B) at higher magnification. TEM images taken for D) GR nanoflakes, E) Fe2O3/GR nanocomposite (QED = 450 mC cm−2), and F) for the same sample as (E) at higher magnification.
presence of GR nanoflakes in the electrode architecture ham- pers such a diffusion process.
The PEC behavior of nanohybrid electrodes of six different compositions was studied (Figure S5, Supporting Information).
A maximum of 1.2 mA cm−2 photocurrent was measured for Fe2O3 layers (Figure 3B), which value is in the range of the best-performing photoelectrodes prepared by electrodeposi- tion.[19,50,61] Most importantly, all Fe2O3/GR nanocomposite photoelectrodes greatly outperformed their pristine Fe2O3 counterparts. A maximum trend can be observed as a function of Fe2O3 loading, both for the pristine and the GR-containing system. Two times higher photocurrents were measured com- pared to the bare Fe2O3 (2.5 vs 1.2 mA cm−2) for nanocomposite layers with the optimal composition (QED = 450 mC cm−2). To the best of our knowledge, no electrodeposited Fe2O3-based photoelectrode showed such PEC behavior so far (see Table 1 for comparison).
Figure 3C shows the photoaction spectra recorded for the best-performing Fe2O3 and Fe2O3/GR photoelectrodes. The characteristics of the two curves are similar, with higher inci- dent photon-to-charge conversion efficiency (IPCE) values in the case of the nanocomposite electrode. IPCE curves were integrated across the AM 1.5G solar spectrum (Figure S6, Sup- porting Information). The integrated maximum photocurrent values are very close to the ones measured in the photovoltam- metry experiments (Table S4, Supporting Information), which further confirms the validity of the recorded photocurrent values. The IPCE values are comparable to the ones, obtained for Ti-doped hematite layers by others,[62] but a higher bias was applied in this study (1.5 V vs RHE). The cutoff region of the two curves are similar (Ecutoff ≈ EBG ≈ 2 eV), indicating that the wavelength range of photoactivity has not broadened in the case of the Fe2O3/GR photoelectrodes. This means that the origin of the enhanced PEC behavior is rooted in the enhanced charge carrier separation and transport (i.e., the enhanced non- characteristic absorption in Figure 2B does not result in any photocurrent).
To glean insights on the electrical properties of the nano- hybrid electrodes, electrochemical impedance spectroscopy (EIS) measurements were performed. Figure S7, Supporting Information, shows the Nyquist plots constructed from data collected at open circuit conditions for both Fe2O3 and Fe2O3/
GR. In the case of Fe2O3, a distinct semicircle can be iden- tified in the high-frequency range, assigned to an electron- transfer limited process, whereas the linear part, observed in the lower-frequency range corresponds to the diffusion- limited electron-transfer process.[63] The semicircle portion has visibly shrunk in the case of the nanocomposite layers.
By fitting the semicircle portion, information can be gained on the series resistance (Rs) and on the charge transfer resist- ance (Rct). Rs is similar for the two systems. As for Rct, one order of magnitude smaller value was calculated for the nano- hybrid sample. This phenomenon has been already discussed and elucidated in the literature for other metal-oxide/nano- carbon systems:[28,64] by electrodepositing a metal-oxide on a conductive nanocarbon network, the electric conductivity of the nanocomposite layers becomes better, compared to the pristine metal-oxides. This results in improved charge car- rier transport and thereby also in suppressed charge carrier recombination explaining the higher photocurrents in the case of the Fe2O3/GR layers.
2.3. Transient Absorption Spectroscopy
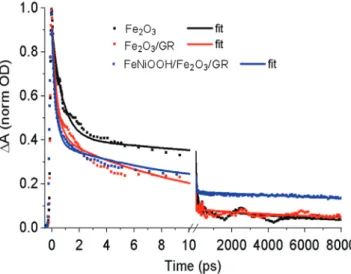
To understand photoinduced charge carrier dynamics in the photoelectrodes, transient absorption spectroscopy was employed. This method provides information about forma- tion and dynamics of photoinduced charge carriers in the time range from sub-picoseconds to nanoseconds. Time-resolved transient absorption kinetics measured at 800 nm for the bare Fe2O3, Fe2O3/GR, and for the FeNiOOH co-catalyst decorated sample, are presented in Figure 4. The loading of the Fe2O3 layer was identical for all samples (QED = 450 mC cm−2) which corresponds to about 220 nm thickness. The measurements were carried out in ex situ conditions (i.e., without any electro- lyte and applied bias).
Each kinetic trace was normalized to the maximum and fitted by three-exponential decay function (see Supporting Information). Results of the fitting are summarized in Table 2.
The main features of the transient absorption spectrum and the kinetics are consistent with the earlier studies (see an example for the TA spectrum of Fe2O3 in Figure S10, Sup- porting Information).[45,47] After excitation, an induced negative Figure 3. A) Photovoltammograms recorded for Fe2O3 and Fe2O3/GR films in 1 m NaOH under 100 W cm−2 simulated AM 1.5 solar light.
QED = 450 mC cm−2, υ = 2 mV s−1, fillumination = 0.1 Hz. B) Maximum photocurrents read from the set of photovoltammograms presented in Figure S5, Supporting Information. Error bars were calculated from at least three individual measurements on different electrodes. C) IPCE curves recorded for Fe2O3 and Fe2O3/GR photoelectrodes in 1 m NaOH solution, applying 1.5 V versus RHE bias potential. QED = 450 mC cm−2.
absorption peak around 530 nm is due to the bleach of Fe2O3 absorption band, and a broad positive band (which extends to the near IR region) originates from photo-generated free charges in Fe2O3. Interestingly, the trend observed on the decay traces for the GR-containing samples is notably comparable to its pristine and co-catalyst-coated counterparts. The TA kinetics, measured at 800 nm, have a significant sub-ps component for all samples regardless of the presence of GR or Fe2O3 loading. The compo- nent corresponds to hot carrier cooling, which is independent of the presence of graphene. In tens of ps time range, GR leads to faster decay of the signal due to the free charges. We attribute this speeding up to the more efficient injection of charges due to the increased photoelectrode surface area provided by the graphene. Graphene can attract both holes and electrons.
In contrast to the ten ps time scales, the lifetime of the ns com- ponent is somewhat prolonged due to the presence of graphene in the photoelectrode composite. Decorating the Fe2O3 surface
with a co-catalyst provides an additional channel to extract holes before they can recombine with the electrons. In presence of the FeNiOOH co-catalyst, the amplitude of the long nano- second component of the charge carrier lifetime is increased to almost 20% which is significantly higher compared to the amplitude obtained for Fe2O3 and Fe2O3/GR. We thereby con- clude that the FeNiOOH layer effectively attracts holes from the underlying Fe2O3 film, leading to a superior PEC performance.
Similar experiments have been carried out on photoelectrodes with different compositions and very similar trends were found on the t3 values. These data further support the hypothesis made according to the photostability results (see below), that significant portion of the photogenerated holes are transported to GR, thus oxidizing it. This process can be alleviated by the proper co-catalyst coating on the surface.
2.4. Photostability
To probe the photostability of the photoelectrodes, chrono- amperometry measurements were carried out for two hours under continuous solar illumination (Figure 5A). While Fe2O3 remained stable in the timeframe of the experiment, the photo- currents recorded for Fe2O3/GR decreased substantially within 40 min, approaching the values recorded for Fe2O3. It is clear from this comparison that this decrease must be tied to the degradation of the underlying GR scaffold upon applying posi- tive bias and illumination. To probe the disappearance of GR Table 2. Fitting parameters of the transient absorption kinetics in Figure 4.
Fe2O3 Fe2O3/GR FeNiOOH/Fe2O3/GR A1 0.5 ± 0.01 (55%) 0.5 ± 0.01 (55%) 0.5 ± 0.02 (58%)
t1 0.8 ± 0.05 ps 0.4 ± 0.05 ps 0.3 ± 0.02 ps
A2 0.32 ± 0.01 (35%) 0.35 ± 0.05 (36%) 0.2 ± 0.04 (24%)
t2 51 ± 3 ps 10 ± 0.5 ps 9.87 ± 0.47 ps
A3 0.08 ± 0.01 (10%) 0.08 ± 0.01 (9%) 0.16 ± 0.01 (18%) t3 9000 ± 1000 ps 14 000 ± 2000 ps 40 000 ± 4000 ps
Figure 5. A) Long-term chronoamperometry measurements performed in 1 m NaOH solution saturated with Ar, applying E = 1.45 V versus RHE potential and under 100 mW cm−2 AM 1.5 simulated sunlight. The vertical lines show the current drop upon interrupting the illumination. B) Change in the normalized area of the G band of GR in time. Values were determined by integrating the G band intensity in the Raman spectra presented in Figure S8A,B, Supporting Information, and normalizing these values with area of the G band at t = 0 min. Two lines were added to guide the eye of the reader. C) LSV curves recorded for Fe2O3/GR and FeNiOOH/Fe2O3/GR thin films in 1 m NaOH under 100 W cm−2 simulated AM 1.5 sunlight. QED = 450 mC cm−2, υ = 2 mV s−1, fillumination = 0.1 Hz.
Figure 4. Ex situ transient absorption kinetics at λ = 800 nm for Fe2O3, Fe2O3/GR, FeNiOOH/Fe2O3/GR photoelectrodes following λ = 400 nm (3.1 eV) 400 µW, 400 µm spot diameter, 500 kHz repetition rate laser pulse excitation. Fe2O3 loading is identical for all samples (i.e., QED = 450 mC cm−2).
from the hybrid electrode, Raman spectra were recorded peri- odically (for experimental details please see Supporting Infor- mation) during the long-term photoelectrolysis experiment (Figure S8A, Supporting Information; Figure 5B). The spectra were recorded every 10 min in the first hour and every 20 min in the second hour. The presence of GR was followed by moni- toring the intensity of the G band on the spectra. Clearly, this band vanished within the first hour (Figure S8A, Supporting Information). To quantify this observation, G band area was integrated for all spectra and it was normalized with the value calculated for t = 0 min (Figure 5B). The normalized area of the G band decreased monotonously, and completely vanished after 80 min, confirming the disappearance of the underlying GR layer. Our observation invokes a rather uncomfortable ques- tion about the applicability of nanocarbon-containing electrodes in oxidative processes, since the widely accepted consensus is that such corrosion should not occur. There are few among the many reports on semiconductor/nanocarbon nanocomposites, however, which describe a similar effect.[65,66] Upon illumina- tion, either the formed reactive species (OH• radicals) oxidized GR, or after charge separation, a fraction of the photogenerated holes are not transported toward the electrode/electrolyte interface, but rather to GR, which subsequently gets directly oxidized.
2.5. Synthesis and PEC Behavior of FeNiOOH/Fe2O3/GR Photoelectrodes
One viable option to tackle photostability issues is to deposit a co-catalyst layer on top of Fe2O3. By doing so, in theory, the vast majority of the photogenerated holes are rapidly transferred to the co-catalyst, which might successfully prevent the corrosion of GR. We chose amorphous mixed FeOOH and NiOOH as co-catalyst (abbreviated as FeNiOOH in the following), which was electrodeposited on Fe2O3/GR after the second heat treat- ment step (see Scheme 1 and the Experimental Section for fur- ther details). Both FeOOH and NiOOH are well-known water oxidation catalysts and have been widely applied as co-catalyst overlayers to boost the PEC performance of various metal oxide photoelectrodes.[37,38,67–70] In most of these studies, however, either only one of them was used[38,70] or they were deposited on top of each other as separate layers.[68,69] In our case, mixed FeOOH and NiOOH were synthesized in a single step by elec- trodeposition (instead of the more popular photodeposition).
The main advantage of this method is that FeOOH and NiOOH are simultaneously deposited on the electrode surface and their ratio can be easily tuned by the variation of the concentration of the Fe, and Ni salts in the electrodeposition solution.[37,71] To determine the exact composition of the FeNiOOH layer, XPS measurements were performed. Survey scans proved the pres- ence of O, Fe, and Ni in the sample (Figure S1, Supporting Information). After collecting and evaluating the high resolu- tion scans (Figure S2, Tables S1 and S2, Supporting Informa- tion), the following elemental composition was determined: 83, 16, and 1 at% for O, Fe, and Ni, respectively. The most impor- tant conclusion from these numbers is that the Fe:Ni ratio dif- fers from the one expected from the experimental conditions (Fe:Ni 5:3), and thus the formed coating is not stoichiometric.
Additionally, the position and intensity of the O 1s peaks sug- gest that O atoms in the sample are mostly in the form of hydroxide (71.0%), which is a bit more than two-times higher than in the case of the pristine Fe2O3 sample. Based on this data it can be safely concluded that the electrodeposited FeN- iOOH overlayer consists of mixed FeOOH and NiOOH.
Figure 5C shows LSV traces, recorded for Fe2O3/GR and its FeNiOOH-decorated counterpart. The onset potential has notably shifted to the cathodic direction (approximately 160 mV) in parallel with the 40% increase of the maximum photocurrent, reaching photocurrents as high as 3.1 mA cm−2. A notable improvement was also observed for the IPCE values, however, the wavelength-range of absorption did not change (Figure S6B, Supporting Information). The effect of the co- catalyst on the photostability of the Fe2O3/GR electrode was even more striking (blue curve in Figure 5A). The photocur- rents remained stable in the course of the two-hour photo- electrolysis in contrast to the previously experienced rapid decrease. Raman spectra were also taken during this measure- ment (Figure S8B, Supporting Information). The G band cor- responding to the presence of GR is clearly visible even at the end of the two-hour electrolysis. Data were quantified similarly as in the case of the Fe2O3/GR electrode (Figure 5B) revealing that the normalized area of the G band (thus the amount of GR in the sample) did not change significantly during the meas- urement. According to the PEC and Raman data, we conclude that by depositing FeNiOOH co-catalyst layer on the surface of Fe2O3/GR photoelectrode, the effect of the GR framework on the PEC properties was preserved (even slightly improved), in parallel with the protection of the underlying GR from corro- sion. To further verify that the measured photocurrents are a result of PEC water oxidation, the concentration of the evolved oxygen was measured with a Clark-type O2 sensor (Figure S9, Supporting Information). A Faradaic efficiency, close to 100%
was calculated over the course of the three hour measurement employing a FeNiOOH /Fe2O3/GR photoelectrode.
The effect of FeNiOOH on the charge carrier transfer and recombination characteristics was further studied with IMPS.[72,73] Figure S11, Supporting Information, shows a set of IMPS spectra recorded from the FeNiOOH/Fe2O3/GR and the corresponding Fe2O3 and Fe2O3/GR electrodes applying a set of potentials ranging from 0.8 to 1.55 V versus RHE. An almost perfect circle can be observed at the least positive poten- tials, meaning that the measured steady-state photocurrent (low frequency intercept, LFI) is close to zero, thus surface recombination dominates the PEC behavior of the system.[72]
LFI shifts away from zero by the increasing potential along with the increase of the high frequency intercept (corre- sponding to the maximum harvestable photocurrent, if no recombination occurs). Additionally, the diameter of the semi- circle in the upper quadrant, gradually decreases meaning that the applied potential has significantly influenced the equilib- rium between the charge carrier transfer and recombination.
In the case of the FeNiOOH-decorated sample, no semicircle can be identified in the upper quadrant above 1.4 V versus RHE, suggesting that charge carrier transfer is the domi- nating process.[73] The semicircle in the upper quadrant was shrunk, but never diminished in the case of both co-catalyst- less samples.
In the following, kinetic parameters were determined from the measured IMPS spectra and plotted versus the applied potential (Figure S12, Supporting Information). Specifically, rate constants, corresponding to charge carrier transfer (ktr) and surface recombination (ksr) were determined. The ktr values, calculated for the Fe2O3 and Fe2O3/GR imply that GR had no obvious influence on the charge carrier transfer characteristics.
On the other hand, ksr values were notably higher, but only up to 1.5 V versus RHE where it drastically dropped in the case of the Fe2O3/GR electrode. When the FeNiOOH co-catalyst was present on the electrode surface, ktr were almost identical to the ones, obtained for Fe2O3. This is rather peculiar, since if FeN- iOOH would behave as a co-catalyst, one would expect a drastic change in the ktr values. Instead of that, significantly smaller ksr values were found, indicating suppressed charge carrier recom- bination. The effect of low ksr values has also manifested in the charge transfer efficiency, thus the highest values were deter- mined for the FeNiOOH/Fe2O3/GR electrode (Figure S12C, Supporting Information). From these observations one can conclude that role of FeNiOOH is to passivate the Fe2O3 sur- face against recombination (reduced Fermi-level pinning and increased band-bending at the surface), rather than activating it for water oxidation. This phenomenon has been also observed and discussed in detail for Co-Pi[74] and even for FeNiOx[39]
co-catalyst overlayers.
3. Conclusions
We have shown that electrodeposition allows the synthesis of complex photoelectrode architectures with precisely controlled structure and composition. The photoelectrode assembly fol- lowed a bioinspired design, where the different components have different function. Fe2O3 was responsible for light absorp- tion, the GR framework ensured proper charge transport, while the FeNiOOH overlayer retained recombination at the sur- face states through passivation. Photocurrent densities were 2.6 and 1.3 times higher compared to the respective single- and two-component counterparts, and most important, exceeded all precedent literature data for electrodeposited hematite based photoelectrodes. TAS measurements revealed 1.5 times increase in hole-lifetime in the case of the Fe2O3/GR layers compared to the bare Fe2O3. Introducing a carbon component to a photoanode, however, raised an additional concern, namely that the photogenerated holes can oxidize the underlying nano-
carbon framework (as confirmed by Raman spectroscopy). By adding a third component to the system (i.e., an FeNiOOH overlayer), we were able to suppress the corrosion of the nano- carbon matrix, while all the benefits gained by the presence of GR were still present. Rate constants, corresponding to charge transfer were not affected by the presence of the co-catalyst.
Contrastingly, the addition of FeNiOOH to the hematite/gra- phene system has greatly decreased the surface recombination.
Our hypothesis of the processes occurring in the investigated systems are presented in Scheme 2.
For the pristine Fe2O3, photogenerated holes can oxidize water either directly from the valence band, or from the sur- face states, where they can also recombine with electrons from the conduction band (Scheme 2A). When GR nanoflakes are present (Scheme 2B), two additional processes occur: better transport of photogenerated electrons toward the back contact, due to the highly conductive nature of graphene and some of the photogenerated holes can also be transported to graphene and oxidize it (note the metallic nature of graphene). Finally, if the surface of Fe2O3 is decorated with a material, which passi- vates the surface states, holes can be rapidly transported to the co-catalyst (or surface passivating agent) and to the substrate (Scheme 2C). Since the electrodeposited FeNiOOH layer is thin and porous, a small fraction of holes might be also trans- ferred directly from the valence band of exposed hematite. Most importantly, because of the rapid hole-transfer to FeNiOOH, the pathway leading to the corrosion of graphene is successfully eliminated.
4. Experimental Section
Materials: Iron (III) chloride (FeCl3, Sigma-Aldrich), nickel (II) chloride (NiCl2, Sigma-Aldrich), sodium chloride (NaCl, WVR), sodium fluoride (NaF, VWR), sodium hydroxide (NaOH, VWR), potassium chloride (KCl, VWR), potassium hexacyanoferrate(II) trihydrate (K4[Fe(CN)6]⋅3H2O, Fluka), potassium hexacyanoferrate(III) (K3[Fe(CN)6], Reanal), sodium sulfate anhydrous (Na2SO4, VWR), hydrogen peroxide (H2O2, 30%, VWR), titanium tetrachloride (TiCl4, Honeywell), acetone (VWR), ethanol (VWR), and graphene powder (Elicarb Premium Graphene Powder) were of analytical grade and used without further purification. Argon (Ar, 99.995%) gas was purchased from Messer. Fluorine-doped tin-oxide- coated glass (FTO, TEC15, Sigma-Aldrich) was used as a substrate.
All solutions were prepared using ultrapure deionized water (Millipore Direct Q3-UV, 18.2 MΩ cm).
Nanocomposite Synthesis: First, the GR-dispersion (c = 2 mg mL−1 in ethanol), which was sonicated for 30 min prior to use, was spray-coated Scheme 2. Simplified models of the elementary processes occurring in the case of a A) Fe2O3, B) Fe2O3/GR, and C) FeNiOOH/ Fe2O3/GR photo- electrode. Elementary processes are: 1) absorption of a photon and generation of an electron-hole pair, 2) nonradiative recombination of an electron- hole pair, 3) electron transport toward the back contact, 4) trapping of holes in surface states, 5) electron–hole recombination in surface states, 6) hole-transfer from the valence band and from the surface states to the electrolyte, 7) hole-transport toward the graphene framework, and 8) hole- transport to the FeNiOOH co-catalyst overlayer.
on a preheated (T = 140 °C) FTO electrode, using an Alder AD320 type airbrush and a homemade spray-coater robot operated with 1 bar compressed air pressure. To remove the residual traces of the solvent and to enhance adhesion of GR, the films were heat-treated in an oven at 180 °C for 1 h. The nanocarbon loading was monitored by a Mettler Toledo XPE-26 type analytical microbalance.
As a next step, Fe2O3 was electrodeposited on the surface of the FTO or GR-coated FTO electrodes. All electrochemical syntheses and measurements were performed using an Autolab PGSTAT302 potentiostat/galvanostat. Nanostructured Ti-doped Fe2O3 thin films were synthesized using a cathodic electrodeposition procedure adapted from the literature.[13,71] A one-compartment, three-electrode electrochemical cell was employed. FTO or GR-coated FTO was used as a working electrode, an Ag/AgCl/3 m NaCl as a reference, and a Pt sheet as a counter electrode. The deposition electrolyte solution contained 5 mm FeCl3, 5 mm NaF, 0.1 m NaCl, 0.1 m H2O2, and 2 at% Ti4+ (added from the aqueous solution of 1 m TiCl4), which was gently stirred during the synthesis. To protect the spray-coated GR layer from peeling off from the FTO substrate, the concentration of H2O2 was reduced from 1 to 0.1 m compared to the originally published recipe. Potentiodynamic electrodeposition of Fe2O3 was carried out at 50 °C cycling the potential between −0.2 and 0.4 V using 200 mV s−1 sweep rate. The thickness of the deposited thin films was controlled by the passed charge during the synthesis. After electrodeposition, thin films were thoroughly washed with deionized water and dried under air at room temperature.
β-FeOOH was converted to crystalline α-Fe2O3 by annealing at 520 °C under air (ΔT = 5 °C min−1) for 30 min, which was followed by another heat treatment under Ar at 700 °C (ΔT = 5 °C min−1) for 30 min. The purpose of this second heat treatment step was to enhance crystallinity, and it was carried out under Ar to protect the underlying GR layer from oxidation. To characterize the coverage of GR after the synthesis a set of CVs were recorded in a solution containing 5-5 mm K4[Fe(CN)6] and K3[Fe(CN)6] and 1 m KCl (Figure S13, Supporting Information). Peaks corresponding to the oxidation/reduction of the Fe2+/Fe3+ ions were clearly visible on the CV recorded for GR. No peaks were visible on the pristine Fe2O3 electrode, while slightly higher currents could be seen in the case of the Fe2O3/GR sample. According to this measurement, it was concluded that the GR layer was mostly covered with Fe2O3 after the synthesis.
Electrodeposition of FeNiOOH on the Nanocomposite Electrodes: To prepare FeNiOOH-decorated Fe2O3 and Fe2O3/GR electrodes, a modified version of the previously described cathodic electrodeposition procedure was employed.[37] The deposition electrolyte solution contained 5 mm FeCl3, 3 mm NiCl2, 5 mm NaF, 0.1 m NaCl, and 0.1 m H2O2, stirred gently during the synthesis. The potential was cycled between −0.49 and 0.41 V using 200 mV s−1 sweep rate. Temperature of the deposition solution was kept at 50 °C. Three cycles gave the highest enhancement in the PEC performance.
Morphological and Structural Characterization: A Hitachi S-4700 field emission SEM was operated at an accelerating voltage of 10 kV.
TEM images were recorded by using a FEI Tecnai G2 20 X-Twin type instrument, operating at an acceleration voltage of 200 kV. Raman spectra were recorded on a DXR Raman Microscope using a green laser (λ = 532 nm), operating at 6.25 mW laser power. UV–vis spectra were recorded on a Shimadzu UV-3600 Plus spectrophotometer in between 300 and 800 nm both in absorbance and reflectance mode. Diffuse reflectance spectra were recorded to construct the Tauc plots. XPS was performed with a SPECS instrument equipped with a PHOIBOS 150 MCD 9 hemispherical analyzer. The analyzer was in FAT mode with 40 eV pass energy (survey scans) and 20 eV pass energy (high resolution scans). The Al K a radiation (hv = 1486.6 eV) of a dual anode X-ray gun was used as an excitation source and operated at 150 W power. Ten scans were averaged to get a single high-resolution spectrum, while 20–30 scans were averaged to get a single survey scan. The adventitious carbon peak was at 284.8 eV in all cases. For spectrum evaluation, CasaXPS commercial software package was used.
Photoelectrochemical Measurements: LSVs were recorded in a sealed, custom-designed one-compartment, three-electrode quartz cell. Fe2O3,
Fe2O3/GR, and FeNiOOH/Fe2O3/GR on the FTO substrate were used as working electrode, while a Pt sheet and Ag/AgCl/3 m NaCl were employed as counter, and reference electrodes, respectively. The applied light source was a Newport LCS-100 type solar simulator operated at full output. The radiation source was placed 18 cm away from the illuminated working electrode surface (100 mW cm−2 flux), which was irradiated through a quartz window. The cell contained an aqueous solution of 1 m NaOH which was saturated with Ar. Photovoltammograms were recorded using 2 mV s−1 potential sweep in parallel with periodically interrupted irradiation (0.1 Hz). Oxygen content was monitored during long term measurements by an Orion 3 Star Clark-type oxygen sensor.
Calibration of the sensor was performed in DI water, which was saturated with air for one hour and gently stirred prior to the measurement.
IPCE measurements were carried out on a Newport Quantum Efficiency Measurement System (QEPVSI-B) in a single compartment, three-electrode quartz electrochemical cell. Fe2O3, Fe2O3/GR, and FeNiOOH/Fe2O3/GR on the FTO substrate were used as working electrode, while a Pt sheet and Ag/AgCl/3 m NaCl were employed as counter- and reference electrodes, respectively. The wavelength range was 300–660 nm (Δλ = 20 nm step size). The solution was 1 m NaOH saturated with Ar. The electrodes were held at 0.55 V constant potential during the measurements.
Electrochemical impedance spectra of the pristine Fe2O3 and Fe2O3/ GR layers were recorded in a 1 m NaOH solution saturated with Ar, at OCP, in the 0.1 Hz to 20 kHz frequency range, using a sinusoidal excitation signal (10 mV RMS amplitude). The semicircle portion of each spectrum was fitted using the Nova Software of the Autolab Instrument.
Intensity-Modulated Photocurrent Spectroscopy: IMPS was performed on the photoelectrodes using the same cell and electrode setup as described in the case of the photovoltammetry and IPCE measurements but using an AUTOLAB PGSTAT302N potentiostat/galvanostat equipped with an FRA32 module (Metrohm-Autolab) and a LED driver kit (Metrohm-Autolab). Spectra were recorded in the 20 kHz to 0.1 Hz frequency range applying a sinusoidal intensity modulation and bias illumination from a 470 nm blue LED. The amplitude of the modulation was 10%, while the linearity was tested and confirmed by using Lissajous plots. Normalization of the measured signal was carried out by determining the number of the incident photons employing a calibrated silicon photodiode (Thorlabs) and assuming that the LED is monochromatic at its wavelength maximum. From this, the corresponding maximum photocurrent was calculated using the assumption that one photon generates one electron–hole pair.
Transient Absorption Spectroscopy: Spitfire Pro (Spectra Physics) amplified laser system was used for transient absorption experiments.
The excitation wavelength was 400 nm with average power 400 µW, pulse length 100 fs, and repetition rate 500 Hz. Second harmonic of the amplifier output was generated in BBO crystal and used as pump pulses with central wavelength of 400 nm. For the probe at 800 nm the attenuated amplifier pulses were directly used. The decay traces were fitted by 3 exponential decay function as the main model for the time delayed after 50 fs by using Origin software.
Supporting Information
Supporting Information is available from the Wiley Online Library or from the author.
Acknowledgements
This collaborative research received funding from the European Research Council (ERC) under the EU’s Horizon 2020 research and innovation program (A.K., E.K., and C.J., Grant Agreement No. 716539).
ELI-ALPS is supported by the EU and co-financed by the European Regional Development Fund (GOP-1.1.1-12/B-2012-000, GINOP-2.3.6- 15-2015-00001). The authors are grateful for the support from LaserLab
Europe, through campaign LLC002478J. A.H. and T.P. acknowledge financial support from Swedish Research Council and the Swedish Energy Agency. The authors thank Dr. Gergely Ferenc Samu (University of Szeged) for his help with the TA measurements in Lund and the XPS measurements in Szeged, and Dr. Bíborka Janáky-Bohner for her support in the manuscript preparation.
Conflict of Interest
The authors declare no conflict of interest.
Keywords
composite materials, interface engineering, photoelectrochemistry, solar fuels, transient absorption spectroscopy
Received: March 6, 2020 Revised: May 7, 2020 Published online: June 25, 2020
[1] N. Lewis, D. Nocera, Proc. Natl. Acad. Sci. USA 2006, 103, 15729.
[2] J. Li, N. Wu, Catal. Sci. Technol. 2015, 5, 1360.
[3] C. Janáky, K. Rajeshwar, Prog. Polym. Sci. 2015, 43, 96.
[4] C. Janáky, E. Kecsenovity, K. Rajeshwar, ChemElectroChem 2016, 3, 181.
[5] M. R. Wasielewski, Chem. Rev. 1992, 92, 435.
[6] K. Rajeshwar, A. Thomas, C. Janáky, J. Phys. Chem. Lett. 2015, 6, 139.
[7] I. Roger, M. A. Shipman, M. D. Symes, Nat. Rev. Chem. 2017, 1, 0003.
[8] C. Lohaus, A. Klein, W. Jaegermann, Nat. Commun. 2018, 9, 4309.
[9] C. Lohaus, C. Steinert, J. Brötz, A. Klein, W. Jaegermann, Adv. Mater.
Interfaces 2017, 4, 1700542.
[10] I. S. Cho, H. S. Han, M. Logar, J. Park, X. Zheng, Adv. Energy Mater.
2016, 6, 1501840.
[11] S. A. Carminati, A. do Nascimento Barbosa, A. L. M. de Freitas, F. L. Freire, F. L. Souza, A. F. Nogueira, J. Catal. 2019, 372, 109.
[12] D. A. Grave, N. Yatom, D. S. Ellis, M. C. Toroker, A. Rothschild, Adv.
Mater. 2018, 30, 1706577.
[13] N. Mirbagheri, D. Wang, C. Peng, J. Wang, Q. Huang, C. Fan, E. E. Ferapontova, ACS Catal. 2014, 4, 2006.
[14] B. Klahr, S. Gimenez, F. Fabregat-Santiago, J. Bisquert, T. W. Hamann, Energy Environ. Sci. 2012, 5, 7626.
[15] K. Sivula, F. Le Formal, M. Grätzel, ChemSusChem 2011, 4, 432.
[16] C. Li, Z. Luo, T. Wang, J. Gong, Adv. Mater. 2018, 30, 1.
[17] S. Kment, F. Riboni, S. Pausova, L. Wang, L. Wang, H. Han, Z. Hubicka, J. Krysa, P. Schmuki, R. Zboril, Chem. Soc. Rev. 2017, 46, 3716.
[18] B. Iandolo, B. Wickman, I. Zorić, A. Hellman, J. Mater. Chem. A 2015, 3, 16896.
[19] R. Franking, L. Li, M. A. Lukowski, F. Meng, Y. Tan, R. J. Hamers, S. Jin, Energy Environ. Sci. 2013, 6, 500.
[20] C. A. Mesa, A. Kafizas, L. Francàs, S. R. Pendlebury, E. Pastor, Y. Ma, F. Le Formal, M. T. Mayer, M. Grätzel, J. R. Durrant, J. Am.
Chem. Soc. 2017, 139, 11537.
[21] A. Cots, D. Cibrev, P. Bonete, R. Gómez, ChemElectroChem 2017, 4, 585.
[22] Y. Ling, G. Wang, D. A. Wheeler, J. Z. Zhang, Y. Li, Nano Lett. 2011, 11, 2119.
[23] S. D. Tilley, M. Cornuz, K. Sivula, M. Grätzel, Angew. Chem., Int. Ed.
2010, 49, 6405.
[24] J. Li, S. K. Cushing, P. Zheng, F. Meng, D. Chu, N. Wu, Nat.
Commun. 2013, 4, 1.
[25] E. Kecsenovity, B. Endrődi, P. S. Tóth, Y. Zou, R. A. W. Dryfe, K. Rajeshwar, C. Janáky, J. Am. Chem. Soc. 2017, 139, 6682.
[26] E. Kecsenovity, B. Endrődi, Z. Pápa, K. Hernádi, K. Rajeshwar, C. Janáky, J. Mater. Chem. A 2016, 4, 3139.
[27] S. Yin, X. Men, H. Sun, P. She, W. Zhang, C. Wu, W. Qin, X. Chen, J. Mater. Chem. A 2015, 3, 12016.
[28] B. Endrődi, E. Kecsenovity, K. Rajeshwar, C. Janáky, ACS Appl.
Energy Mater. 2018, 1, 851.
[29] Y. H. Ng, A. Iwase, A. Kudo, R. Amal, J. Phys. Chem. Lett. 2010, 1, 2607.
[30] F. Meng, J. Li, S. K. Cushing, J. Bright, M. Zhi, J. D. Rowley, Z. Hong, A. Manivannan, A. D. Bristow, N. Wu, ACS Catal. 2013, 3, 746.
[31] A. G. Tamirat, W.-N. Su, A. A. Dubale, C.-J. Pan, H.-M. Chen, D. W. Ayele, J.-F. Lee, B.-J. Hwang, J. Power Sources 2015, 287, 119.
[32] S. D. A. Carminati, F. L. Souza, A. F. Nogueira, ChemPhysChem 2016, 17, 170.
[33] S. Rai, A. Ikram, S. Sahai, S. Dass, R. Shrivastav, V. R. Satsangi, RSC Adv. 2014, 4, 17671.
[34] L. He, L. Jing, Z. Li, W. Sun, C. Liu, RSC Adv. 2013, 3, 7438.
[35] J. Y. Kim, J. W. Jang, D. H. Youn, J. Yul Kim, E. S. Kim, J. S. Lee, RSC Adv. 2012, 2, 9415.
[36] B. Y. Yu, S. Y. Kwak, J. Mater. Chem. 2012, 22, 8345.
[37] J. Deng, X. Lv, H. Zhang, B. Zhao, X. Sun, J. Zhong, Phys. Chem.
Chem. Phys. 2016, 18, 10453.
[38] A. G. Tamirat, W.-N. Su, A. A. Dubale, H.-M. Chen, B.-J. Hwang, J. Mater. Chem. A 2015, 3, 5949.
[39] J. E. Thorne, J. W. Jang, E. Y. Liu, D. Wang, Chem. Sci. 2016, 7, 3347.
[40] W. Li, S. W. Sheehan, D. He, Y. He, X. Yao, R. L. Grimm, G. W. Brudvig, D. Wang, Angew. Chem., Int. Ed. 2015, 54, 11428.
[41] T. H. Jeon, G. Moon, H. Park, W. Choi, Nano Energy 2017, 39, 211.
[42] X. Guo, L. Wang, Y. Tan, Nano Energy 2015, 16, 320.
[43] P. Peerakiatkhajohn, J.-H. Yun, H. Chen, M. Lyu, T. Butburee, L. Wang, Adv. Mater. 2016, 28, 6405.
[44] Y. W. Phuan, M. N. Chong, T. Zhu, S.-T. Yong, E. S. Chan, Mater.
Res. Bull. 2015, 69, 71.
[45] S. R. Pendlebury, X. Wang, F. Le Formal, M. Cornuz, A. Kafizas, S. D. Tilley, M. Grätzel, J. R. Durrant, J. Am. Chem. Soc. 2014, 136, 9854.
[46] F. Le Formal, S. R. Pendlebury, M. Cornuz, S. D. Tilley, M. Grätzel, J. R. Durrant, J. Am. Chem. Soc. 2014, 136, 2564.
[47] Z. Huang, Y. Lin, X. Xiang, W. Rodríguez-Córdoba, K. J. McDonald, K. S. Hagen, K.-S. Choi, B. S. Brunschwig, D. G. Musaev, C. L. Hill, D. Wang, T. Lian, Energy Environ. Sci. 2012, 5, 8923.
[48] T. Le Bahers, K. Takanabe, J. Photochem. Photobiol., C 2019, 40, 212.
[49] O. Zandi, A. R. Schon, H. Hajibabaei, T. W. Hamann, Chem. Mater.
2016, 28, 765.
[50] N. Mirbagheri, D. Wang, C. Peng, J. Wang, Q. Huang, C. Fan, E. E. Ferapontova, ACS Catal. 2014, 4, 2006.
[51] R. L. Spray, K.-S. Choi, Chem. Mater. 2009, 21, 3701.
[52] A. C. Ferrari, D. M. Basko, Nat. Nanotechnol. 2013, 8, 235.
[53] A. M. Jubb, H. C. Allen, ACS Appl. Mater. Interfaces 2010, 2, 2804.
[54] D. L. A. de Faria, V. S. Silva, M. T. de Oliveira, J. Raman Spectrosc.
1997, 28, 873.
[55] J.-B. Wu, M.-L. Lin, X. Cong, H.-N. Liu, P.-H. Tan, Chem. Soc. Rev.
2018, 47, 1822.
[56] S. Shen, S. A. Lindley, X. Chen, J. Z. Zhang, Energy Environ. Sci.
2016, 9, 2744.
[57] G. Wang, X. Shen, J. Yao, J. Park, Carbon 2009, 47, 2049.
[58] P. Makuła, M. Pacia, W. Macyk, J. Phys. Chem. Lett. 2018, 9, 6814.
[59] J. Tauc, Mater. Res. Bull. 1968, 3, 37.
[60] B. Iandolo, B. Wickman, I. Zorić, A. Hellman, J. Mater. Chem. A 2015, 3, 16896.
[61] Y. W. Phuan, W.-J. Ong, M. N. Chong, J. D. Ocon, J. Photochem.
Photobiol., C 2017, 33, 54.
[62] P. S. G. Bassi, T. Sritharan, L. H. Wong, J. Phys. D: Appl. Phys. 2018, 51, 473002.
[63] S. H. Aboutalebi, A. T. Chidembo, M. Salari, K. Konstantinov, D. Wexler, H. K. Liu, S. X. Dou, Energy Environ. Sci. 2011, 4, 1855.
[64] W.-D. Zhang, B. Xu, L.-C. Jiang, J. Mater. Chem. 2010, 20, 6383.
[65] J. G. Radich, A. L. Krenselewski, J. Zhu, P. V. Kamat, Chem. Mater.
2014, 26, 4662.
[66] J. G. Radich, P. V. Kamat, ACS Nano 2013, 7, 5546.
[67] A. Tsyganok, D. Klotz, K. D. Malviya, A. Rothschild, D. A. Grave, ACS Catal. 2018, 8, 2754.
[68] D. K. Lee, K. S. Choi, Nat. Energy 2018, 3, 53.
[69] T. W. Kim, K.-S. Choi, Science 2014, 343, 990.
[70] K. George, X. Zhang, A. Bieberle-Hütter, J. Chem. Phys. 2019, 150, 041729.
[71] R. Schrebler, K. Bello, F. Vera, P. Cury, E. Muñoz, R. del Río, H. G. Meier, R. Córdova, E. A. Dalchiele, Electrochem. Solid-State Lett. 2006, 9, C110.
[72] L. M. Peter, J. Li, R. Peat, H. J. Lewerenz, J. Stumper, Electrochim.
Acta 1990, 35, 1657.
[73] L. M. Peter, Chem. Rev. 1990, 90, 753.
[74] C. Zachäus, F. F. Abdi, L. M. Peter, R. van de Krol, Chem. Sci. 2017, 8, 3712.