Published online 27 October 2014 Nucleic Acids Research, 2015, Vol. 43, Database issue D485–D493 doi: 10.1093/nar/gku1007
ComPPI: a cellular compartment-specific database for protein–protein interaction network analysis
Daniel V. Veres
1,†, D ´avid M. Gyurk ´ o
1,†, Benedek Thaler
1,2, Krist ´ of Z. Szalay
1, D ´avid Fazekas
3, Tam ´as Korcsm ´aros
3,4,5and Peter Csermely
1,*1Department of Medical Chemistry, Semmelweis University, Budapest, Hungary,2Faculty of Electrical Engineering and Informatics, Budapest University of Technology and Economics, Budapest, Hungary,3Department of Genetics, E ¨otv ¨os Lor ´and University, Budapest, Hungary,4TGAC, The Genome Analysis Centre, Norwich, UK and5Gut Health and Food Safety Programme, Institute of Food Research, Norwich, UK
Received August 13, 2014; Revised September 22, 2014; Accepted October 08, 2014
ABSTRACT
Here we present ComPPI, a cellular compartment- specific database of proteins and their interactions enabling an extensive, compartmentalized protein–
protein interaction network analysis (URL: http://
ComPPI.LinkGroup.hu). ComPPI enables the user to filter biologically unlikely interactions, where the two interacting proteins have no common subcel- lular localizations and to predict novel properties, such as compartment-specific biological functions.
ComPPI is an integrated database covering four species (S. cerevisiae, C. elegans, D. melanogaster and H. sapiens). The compilation of nine protein–
protein interaction and eight subcellular localization data sets had four curation steps including a man- ually built, comprehensive hierarchical structure of
>1600 subcellular localizations. ComPPI provides confidence scores for protein subcellular localiza- tions and protein–protein interactions. ComPPI has user-friendly search options for individual proteins giving their subcellular localization, their interac- tions and the likelihood of their interactions consid- ering the subcellular localization of their interacting partners. Download options of search results, whole- proteomes, organelle-specific interactomes and sub- cellular localization data are available on its website.
Due to its novel features, ComPPI is useful for the analysis of experimental results in biochemistry and molecular biology, as well as for proteome-wide stud- ies in bioinformatics and network science helping cellular biology, medicine and drug design.
INTRODUCTION
Biological processes are separated in the cellular and sub- cellular space, which helps their precise regulation. Com- partmentalization of signalling pathways is a key regulator of several main biochemical processes, such as the nuclear translocation-mediated activation of transcription factors (1). Several proteins are located in more than one subcel- lular localizations. As an example, IGFBP-2 is a predomi- nantly extracellular protein with a key role in insulin growth factor signalling (2), while its translocation into the nucleus results in vascular endothelial growth factor-mediated an- giogenesis (3). Another important example is the HIF-1 Alpha with translocation from the cytosol to the nucleus, where it acts as a transcription factor involved in the main- tenance of cellular oxygen homeostasis (4) (Supplementary Figure S1). Their shuttling between these localizations is a key regulatory mechanism, which implicates the impor- tance of improving the systems level analysis of compart- mentalized biological processes.
Protein–protein interaction data are one of the most valu- able sources for proteome-wide analysis (5), especially to understand human diseases on the systems-level (6) and to help network-related drug design (7). However, protein–
protein interaction databases often contain data with low overlap (8), and are designed using different protocols (9), therefore, their integration is needed to improve our com- prehensive knowledge (10). Low-throughput data sets of- ten use several different protein naming conventions caus- ing difficulties in data analysis and integration. Manual cu- ration of data yields a large improvement of data quality (11).
Interaction data often contain interactions, where the two interacting proteins have no common subcellular lo- calizations (12). These interactions could be biophysically possible, but biologically unlikely (13). Thus, these interac- tions cause data bias that leads to deteriorated reliability in interactome-based studies (14), especially those involv-
*To whom correspondence should be addressed. Tel: +361 459 1500; Fax: +361 266 3802; Email: csermely.peter@med.semmelweis-univ.hu
†The authors wish it to be known that, in their opinion, the first two authors should be regarded as Joint First Authors.
C The Author(s) 2014. Published by Oxford University Press on behalf of Nucleic Acids Research.
This is an Open Access article distributed under the terms of the Creative Commons Attribution License (http://creativecommons.org/licenses/by-nc/4.0/), which permits non-commercial re-use, distribution, and reproduction in any medium, provided the original work is properly cited. For commercial re-use, please contact journals.permissions@oup.com
by guest on February 2, 2015http://nar.oxfordjournals.org/Downloaded from
D486 Nucleic Acids Research, 2015, Vol. 43, Database issue
ing subcellular localization-specific cellular processes (15).
Unfortunately, subcellular localization data are incomplete.
Despite the need of experimentally verified subcellular lo- calizations for reliable compartmentalization-based inter- actome filtering (16), only computationally predicted sub- cellular localization information is available for a large part of the proteome. Moreover, subcellular localization data are redundant, often poorly structured and miss to highlight the reliability of data (17).
Existing analysis tools involving subcellular localizations offer the download of filtered interactomes for a subset of proteins (like MatrixDB (18)). Several databases use only Gene Ontology (GO (19)) cellular component terms as the source of the subcellular localization data (such as HitPre- dict (20) or Cytoscape BiNGO plugin (21)), while GO still contains data inconsistency despite its highly structured an- notations (22). Cytoscape Cerebral plugin (23) generates a view of the interactome separated into layers according to their subcellular localization. In different data sets the sub- cellular localization structure is not uniform, which makes their comparisons often difficult.
ComPPI-based interactomes introduced here provide a broader coverage (Supplementary Tables S1 and S2), us- ing several curation steps in data integration. ComPPI of- fers highly structured subcellular localization data sup- plemented with Localization and Interaction confidence Scores, all presented with user-friendly options. As a key feature ComPPI allows the construction of high-confidence data sets, where potentially biologically unlikely interac- tions in which the interacting partners are not localized in the same cellular compartment, have been deleted. As our examples will show, this gives novel options of interactome analysis and also suggests potentially new subcellular local- izations and localization-based functions.
DESCRIPTION OF THE DATABASE Overview of ComPPI
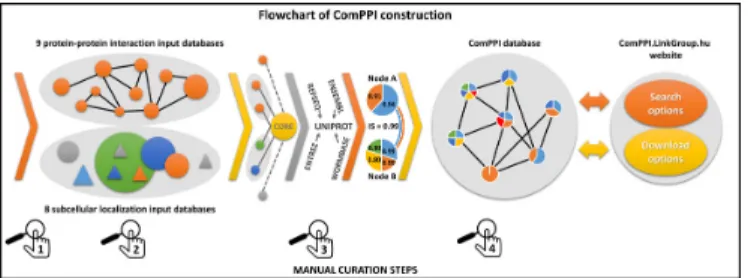
Our goal by constructing ComPPI was to provide a reli- able subcellular compartment-based protein–protein inter- action database for the analysis of biological processes on the subcellular level. A key feature of ComPPI is that it al- lows the filtering of localization-based biologically unlikely interactions resulting in localization-wise more reliable in- teraction data. During the integration of 17 databases to build up ComPPI, we used the following four curation steps to improve data quality (Figure 1). (i) Source databases were selected by comparing them to a large number of other potential databases and their data content was man- ually reviewed. (ii) Subcellular localization data were con- sistently structured to a hierarchical subcellular localization tree (Supplementary Figure S2) containing more than 1600 individual sublocalizations. (iii) We developed an algorithm to map different protein naming conventions to UniProt ac- cession numbers (24,25). (iv) Finally, a manual follow-up by six independent experts was performed in order to revise the data content searching for data inconsistence and false en- tries, and to test the functions of the web interface (Supple- mentary Table S3).
ComPPI database includes comprehensive and inte- grated data of four species (Saccharomyces cerevisiae,
Figure 1. Flowchart of ComPPI construction highlighting the four cura- tion steps. Constructing the ComPPI database we first checked the data content of 24 possible input databases for false entries, data inconsistence and compatible data structure in order to minimize the bias in ComPPI coming from the input sources(1). As a consequence we selected nine protein–protein interaction (BioGRID (29), CCSB (30), DiP (31), DroID (26), HPRD (27), IntAct (32), MatrixDB (18), MINT (33) and MIPS (28)) and eight subcellular localization databases (eSLDB (37), GO (19), Hu- man Proteinpedia (34), LOCATE (38), MatrixDB (18), OrganelleDB (39), PA-GOSUB (36) and The Human Protein Atlas (35)) in order to inte- grate them into the ComPPI data set. The subcellular localization struc- ture was manually annotated creating a hierarchic, non-redundant subcel- lular localization tree using>1600 GO cellular component terms (19) for the standardization of the different data resolution and naming conven- tions(2). All input databases were connected to the ComPPI core database with newly built interfaces in order to improve data consistency, to al- low easy extensibility with new databases and to incorporate automatic database updates. As part of the curation steps the filtering efficiency of our newly built interfaces were tested on 200 random proteins for every in- put databases, and the interfaces were accepted only when all the requested false-entries and data content errors were filtered, in order to establish a more reliable content (Supplementary Table S3). During data integra- tion, different protein naming conventions were mapped to the most reli- able protein name. In this process we used publicly available mapping ta- bles (UniProt (24) and HPRD (27)). For 30% of protein names we applied manually built mapping tables with the help of online ID cross-reference services (PICR (25) and Synergizer (http://llama.mshri.on.ca/synergizer/
translate/))(3). After data integration Localization and Interaction Scores were calculated (for detailed description see Figure2). As an illustration we show the example of Figure2with two interacting proteins (nodes A and B corresponding to HSP 90-alpha A2 and Survivin, respectively) with shared cytosolic and nuclear localizations (light blue and orange). Node B has an additional membrane (yellow) subcellular localization and an extracellular localization (green). Numbers in the circles of nodes A and B refer to their Localization Scores. The Interaction Score of nodes A and B is 0.99 (see Figure2for details). The integrated ComPPI data set was manually revised by six independent experts(4). During the revision two of the six experts tested our database on 200 random proteins each to ensure high-quality control requirements, and searched for exact matches between the entries in the input sources and the ComPPI data set. All the experts searched for false entries, data inconsistency, protein name mapping errors in the down- loadable data and tested the operation of the online services as well. After the revision we updated our source databases, their interfaces, the subcellu- lar localization tree and the algorithm generating the downloadable data, in order to acquire all the changes proposed during the tests. As the final result, the webpagehttp://ComPPI.LinkGroup.huis available for search and download options in order to extract the biological information in a user-friendly way.
Caenorhabditis elegans,Drosophila melanogasterandHomo sapiens) cataloguing 125 757 proteins, their 791 059 interac- tions and 195 815 major subcellular localizations in its cur- rent, 1.1 version. The proteome-wide data set contains lo- calizations for five main subcellular organelles (nucleus, mi- tochondrion, cytosol, secretory-pathway, membrane) and the extracellular compartment. Importantly, 60% of the ComPPI entries have high resolution cellular localization data assigning them to one or several of>1600 GO cellular
by guest on February 2, 2015http://nar.oxfordjournals.org/Downloaded from
Nucleic Acids Research, 2015, Vol. 43, Database issue D487
component terms (19) associating these proteins with dis- tinct subcellular compartments.
Design and implementation
Both protein–protein interaction and subcellular localiza- tion data are incorporated to ComPPI automatically using their own interface to bridge the difference in data structure (Supplementary Table S3). New interfaces can be added without limitations. The incoming data are merged to form a consistent internal data pool using a comprehensive pro- tein name mapping algorithm, in order to deal with the re- dundancy in the input data sets (http://comppi.linkgroup.
hu/help/naming conventions). The website and the down- loadable contents are generated from this integrated inter- nal data pool. All curated parts are stored in separate, yet interconnected containers to maintain persistency between ComPPI releases.
The website follows the hierarchical model-view- controller design pattern to ensure the separation of the data layer from the business logic and the user interface.
Each functional unit is implemented as a module to further support easy maintenance and extensibility. Protein search algorithms have been extensively optimized, and the served content is cached to ensure quick response times even on low-end infrastructure. Due to these features ComPPI can be easily run on a general laptop or desktop computer.
The downloadable data sets are pre-generated and vali- dated automatically and manually in every release to ful- fill our high quality control requirements (Figure1). The Python script that generates these data sets also contains basic tools for data retrieval and manipulation in a network- oriented manner, which enables the user to perform bioin- formatics analysis on the interactome using the open source code and also gives space for further improvement.
End-user documentation is available at the website as tu- torials, detailed descriptions and location-specific tooltips.
All components of ComPPI and the underlying software stack are open source. The source code is available in a revision controlled repository at http://bificomp2.sote.hu:
22422/comppi/summary.
Third-party tools and technologies were selected with open accessibility and scientific reproducibility in mind in- cluding the Ubuntu Linux 14.04 operating system (http:
//ubuntu.com/), the nginx HTTP server (http://nginx.org/), the MySQL 5 Community Edition database server (http:
//www.mysql.com/), the git version control system (http:
//git-scm.com/), the PHP 5 scripting language (https://php.
net/), the Symfony 2 PHP framework (http://symfony.com/), the jQuery JavaScript framework (http://jquery.com/), the D3.js JavaScript library for network visualization (http:
//d3js.org/) and the Python3 scripting language (https://
python.org/).
Database content and access
Input databases. The low overlap of protein–protein inter- action and subcellular localization databases (11) prompted us to integrate several source databases in order to im- prove data coverage and quality (Supplementary Figure S3 and Supplementary Table S2). In this process we used pub-
licly downloadable license-free data sources, preferably con- taining proteome-wide data sets. Protein–protein interac- tion data were selected to contain only physical interactions with experimental evidence coming from high-throughput, as well as low-throughput techniques. We incorporated the widely used species-specific (DroID (26), HPRD (27), Ma- trixDB (18) and MIPS (28)) and general (BioGRID (29), CCSB (30), DiP (31), IntAct (32) and MINT (33)) protein–
protein interaction databases having high data quality, up- date frequency and freely downloadable latest releases for academic research.
Subcellular localization data can be obtained from ex- perimental evidence or using predictions. Several source databases contained only experimentally verified subcellu- lar localization entries (such as Human Proteinpedia (34) and the Human Protein Atlas (HPA) (35)). Other source data had only computationally predicted information (such as PA-GOSUB (36)). Several data sources had integrated data structure (such as eSLDB (37), GO (19), LOCATE (38), MatrixDB (18), OrganelleDB (39)) containing data of both experimental and predicted origin. During the selec- tion of the proteome-wide predicted subcellular localiza- tion databases with downloadable content we focused on the use of prediction algorithms with combined methods using robust machine learning tools validated on highly re- liable training sets.
ComPPI data set. The availability of the data sources dif- fers between various species. As an example ComPPI con- tains eight protein–protein interaction and eight subcellular localization databases for human proteins (Supplementary Figure S3). Database integration was based on protein ID mapping to the most reliable naming convention available, primarily to UniProt Swiss-Prot accession numbers (11).
The 4 curation steps (Figure 1) allow the users to access interaction and localization data at a single resource hav- ing a higher coverage and reliability than the incorporated databases.
The ComPPI database contains three types of predefined data sets: (i) the compartmentalized interactome catalogues of those protein–protein interactions, where the interacting proteins have at least one common subcellular localization, (ii) the integrated protein–protein interaction data set which can be customized by the four species included and (iii) the subcellular localization data set, which is one of the biggest existing subcellular localization resource with a comprehen- sive structure for interactome analysis. All downloadable ComPPI resources are license free and publicly available for academic and industrial research.
Search and download features
Search features. The internally hyper-linked web applica- tion of ComPPI enables even those users, who have no bioinformatics expertise, to search for the interactions of in- dividual proteins. Search options (http://comppi.linkgroup.
hu/protein search) are available for protein names with au- tocomplete function giving their subcellular localization, their interactions and the likelihood of their interactions considering the subcellular localization of the interacting partners. Using the Advanced Settings of the Search page
by guest on February 2, 2015http://nar.oxfordjournals.org/Downloaded from
D488 Nucleic Acids Research, 2015, Vol. 43, Database issue
the user is able to filter the list of the possible query pro- teins for species, subcellular localizations and/or localiza- tion probability. These settings can be set for the interactors of the query protein too and are adjustable with the Custom Settings on the Results page, which allows the filtering of the interactors for subcellular localizations, localization prob- ability and interaction score. The properties of the query protein and its interactors are available for download. Af- ter filtration only those interactions are exported that ful- fill the custom filtering requirements set by the user. Net- work visualization of the whole or filtered first-neighbour interactome of the query protein is also available, where the width of the edges corresponds to the Interaction Score of the given interaction. These options together provide a user-friendly web interface for data mining for both non- experts and computational biologists. A Direct Search op- tion is also available via URL, which gives the opportunity to interconnect the ComPPI database with other resources, or to generate multiple searches for data mining.
Download options. All ComPPI data are available for download at the website. Predefined data sets can be cus- tomized by the user to contain only data for a requested species or localization: (i) Compartmentalized interactomes have interactions, where the two interacting protein-nodes have at least one common subcellular localization. These in- teractomes can be filtered to species besides subcellular lo- calizations. (ii) Integrated protein–protein interaction data sets contain all the interactions, and can be customized to the four species included. (iii) Integrated subcellular local- ization data sets contain proteins together with their local- ization data. The user can select species and localizations to customize these data sets. (iv) The current and previ- ous releases of the full database can also be downloaded. A detailed help and a tutorial for the Search and Download functions are both available.
Output. ComPPI output data provide lists of interactions, interaction scores of the interacting proteins and localiza- tions with localization scores. Moreover, the user receives the PubMed IDs and references of the source databases for both the interactions and subcellular localizations, and the additional information (if available) of the data type.
The user-defined interactomes as results of the Basic or Ad- vanced Search options and the predefined data sets on the Downloads page are available for download in plain text format to ensure convenient data handling. The complete current and previous releases of the database are download- able in SQL format to provide full access to all the data in ComPPI.
Localization and interaction scores
Subcellular localization structure. Subcellular localization data are coming from different source databases, contain- ing localizations having experimental evidence (in the fol- lowings: experimental), coming from unknown sources (un- known) or predictions (predicted; Figure2). Experimental data usually have high resolution, where the exact localiza- tion of the protein is often defined, such as the nuclear pore complex for Nup107 (40). Predicted localizations have usu- ally low resolution. As an example nuclear localization can
be predicted from the existence of a nuclear localization sig- nal in the amino acid sequence (41) without any experimen- tal evidence.
Because of the incongruity in the resolution of the lo- calization data and the different naming conventions be- tween the source databases, we standardized the subcellu- lar localization data using GO cellular component terms (19). In order to solve the problem of the unequivocally mapped GO terms (Figure3) we created a manually built, non-redundant, hierarchical localization tree (Supplemen- tary Figure S2). With the help of this we clustered the>1600 GO cellular component terms to six major compartments (cytosol, nucleus, mitochondrion, secretory-pathway, mem- brane, extracellular) (Supplementary Table S4). This new structure allows ComPPI to store all localization entries from different sources and to assign the proteins efficiently to six major compartments (Figure3 and Supplementary Figure S4).
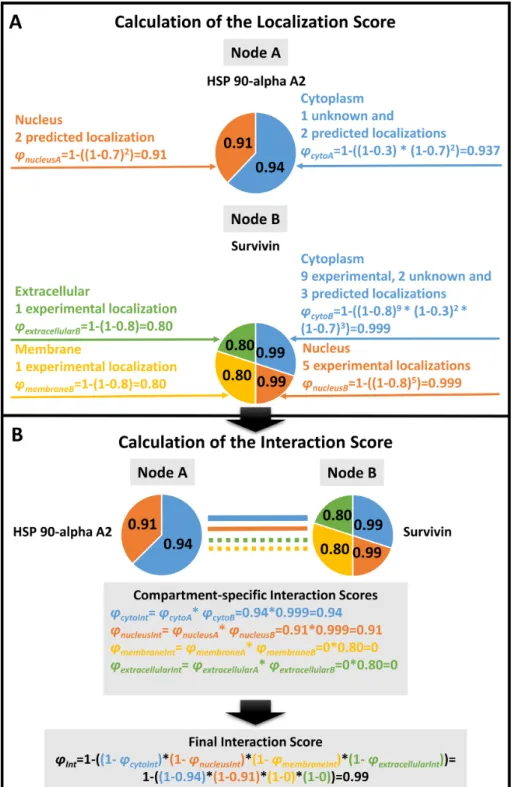
Localization and interaction scores. The ComPPI Local- ization Score is a novel measure to score the probabil- ity of a localization for a given protein. The Localiza- tion Score depends on the subcellular localization evidence type (experimental, unknown, predicted) and the number of sources (Figure2). The Interaction Score characterizes the probability of the subcellular localization of a protein–
protein interaction, and is based on the consensus of the compartment-specific Localization Scores of the interacting proteins. With the help of the scoring algorithm ComPPI provides a novel localization probability describing how likely it is that the protein exists in the given subcellu- lar compartment, and gives the opportunity to build high- confidence interactomes based on the distribution of the in- teraction scores (Supplementary Figure S5).
Localization Scores are calculated using probabilistic dis- junction (marked with operatorV) among the different lo- calization evidence types and the number of ComPPI local- ization data entries of the respective evidence type (Equa- tion (1), see top panel of Figure2for details)
ϕLocX=VrespLocX (1)
whereϕLocX andpLocX are the Localization Score and the localization evidence type (experimental, unknown or pre- dicted) for protein X and localization Loc, respectively, while res is the number of available ComPPI localization data entries for protein X.
As the first step of Interaction Score calculation, compartment-specific Interaction Scores are obtained by multiplying the Localization Scores of the two interactors for each of the six major compartments. Finally, the Inter- action Score is calculated as the probabilistic disjunction (marked with operatorV) of the Compartment-specific In- teraction Scores of all major localizations available for the interacting pair from the maximal number of six major lo- calizations (Equation (2), see bottom panel of Figure2for details)
ϕInt=Vi=16 ϕLocA∗ϕLocB (2) whereϕInt is the Interaction Score, whileϕLocA andϕLocB
are the Compartment-specific Localization Scores of inter- acting proteins A and B, respectively.
by guest on February 2, 2015http://nar.oxfordjournals.org/Downloaded from
Nucleic Acids Research, 2015, Vol. 43, Database issue D489
Figure 2. Calculation of the subcellular localization-based ComPPI scores. We illustrate the Localization Score calculation steps on the examples of Heat Shock Protein (HSP) 90-apha A2 and Survivin. HSP 90-alpha A2 has two major subcellular localizations, while Survivin has four (ϕnucleusA,ϕcytoAand ϕextracellularB,ϕmembraneB,ϕnucleusB,ϕcytoB, respectively). Localizations were manually categorized into major localizations before the calculation (see the text in section ‘Subcellular Localization Structure’ for details).(A)A Localization Score (such ascytoA) is calculated for every available major subcellular localization for both HSP 90-alpha A2 and Survivin based on the available localization evidence types and the number of the respective localization data entries (corresponding topLocXandVrecof Equation (1)). The Localization Score calculation uses the optimized localization evidence type weights of 0.8, 0.7 and 0.3 for experimental, predicted or unknown localization evidence types, respectively. (For details of the weight optimization procedure see section ‘Score Optimization’ of the main text and Supplementary Figure S6.) The Localization Score (i.e. the likelihood for the respective protein to belong to a major compartment) is represented by the probabilistic disjunction among the different localization evidence types and the number of ComPPI localization data entries of the respective evidence type (Equation (1)).(B)Calculation of the Interaction Score (ϕInt) is based on the Localization Scores of the interacting proteins. First, Compartment-specific Interaction Scores (such asϕcytoInt) are calculated as pair-wise products of the relevant Localization Scores of the two interacting proteins (HSP 90-alpha A2 and Survivin). The final Interaction Score (ϕInt) is calculated as the probabilistic disjunction of the Compartment-specific Interaction Scores of all major localizations available for the interacting pair of proteins (in the example four major localizations for HSP 90-alpha A2 and Survivin) from the maximal number of six major localizations (Equation (2)).
by guest on February 2, 2015http://nar.oxfordjournals.org/Downloaded from
D490 Nucleic Acids Research, 2015, Vol. 43, Database issue
Figure 3. Advantages of ComPPI subcellular localization structure. The subcellular localization structure of ComPPI is based on a manually cu- rated, non-redundant subcellular localization tree extracted from GO data (19) containing more than 1600 GO cellular component terms (Supple- mentary Figure S2). On Figure3an example of the redundancy in the GO cellular component tree structure is shown, where the ‘nuclear pore’ cellu- lar component can be found under several branches in the tree, such as in the ‘nucleus’ ->‘nuclear envelope’ ->‘nuclear pore’ or the ‘membrane’ ->
‘membrane part’ ->‘intrinsic component of the membrane’ ->‘integral component of the membrane’ ->‘pore complex’ pathways (highlighted in red). Because of the need of the mapping of high-resolution subcellular lo- calization data into major cellular components (Supplementary Table S4) a localization tree with a non-redundant structure was built. In our example, it can be seen that with the help of this structure the ‘nuclear pore’ derives unequivocally from the ‘nuclear envelope’ term (highlighted in green).
Score optimization. As mentioned before the ComPPI lo- calization evidence type can be experimental, unknown or predicted. ComPPI characterizes each of these localiza- tion evidence types by a parameter called the evidence type weight to achieve a unified scoring system applicable to the diverse data sources. To obtain these evidence type weights we performed their data-driven optimization. Based on the fact that experimentally validated entries are the most re- liable, while localization entries coming from unknown or predicted origin are less reliable, we set the following order of evidence type weights: experimental>predicted AND experimental >unknown as the two requirements of the optimization process. We chose the HPA database (35) con- taining only experimentally verified subcellular localiza- tions in order to build a positive control data set, where the interactors have at least one common localization accord- ing to HPA. Our goal was to find a specific ratio of the ex- perimental, unknown and predicted evidence type weights that maximizes the number of high confidence interactions in the positive control data set (HPA) and simultaneously maximizes the number of low confidence interactions in the ComPPI data set not containing HPA data. These ensure that the quality of data marked as high confidence will have a good match to the quality of experimentally verified data.
All combinations of the experimental, unknown and pre- dicted evidence type weights were set up from 0 to 1 with 0.1 increments. The kernel density of the interactions were calculated with all these settings (with a bandwidth of 0.01), which gave us the ratio of interactions belonging to a given confidence level compared to the distribution of all the in- teractions. Finally, the 285 possible kernel density solutions were tested to find the parameter combination that maxi- mizes the number of both the low and high confidence inter- actions as described above. This resulted in 0.8, 0.7 and 0.3 as the relative evidence type weights for experimental, pre- dicted and unknown data types, respectively (Supplemen- tary Figure S6). Note that this optimization is driven by the reliability of the subcellular localization data, and was not tested using gold standard protein–protein interaction data sets, therefore the Interaction Score reflects the reliability of the interaction in a subcellular localization-dependent but not in an interactome-dependent manner.
Application examples
Merging of subcellular localization and interactome data provides several application opportunities: (i) the filtration of localization-based biologically unlikely interactions––where the two interacting proteins have no common localization and (ii) the prediction of possible new localizations and localization-based biological functions (15). Both are important features of ComPPI as illustrated by an example in this section.
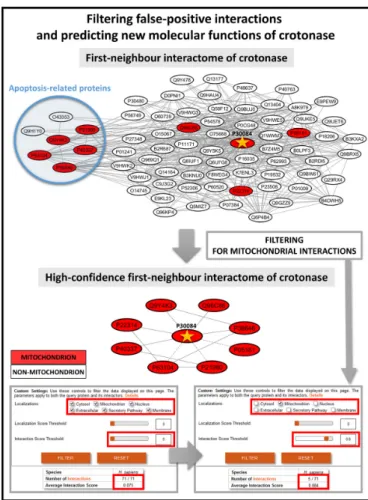
ComPPI-based interaction filtering. First, we made a sys- tematic search for an example, which highlights the impor- tance of the removal of localization-based biologically un- likely interactions looking for key hubs and bridges, where interaction structure changed the most after the filtering step. Here we calculated the degree distribution of the whole human interactome and the high-confidence interactome (containing 23 265/19 386 proteins and their 385 481/260 829 interactions, respectively) where from the latter biolog- ically unlikely interactions with no common subcellular lo- calizations have already been removed. We also calculated the distribution of the betweenness centrality in the two data sets. After these procedures we manually reviewed the first 20 proteins from the UniProt Swiss-Prot subset (15 258 proteins out of 19 386) with the highest differences in degree and centrality measures (Supplementary Table S5). Enoyl- CoA hydratase (crotonase) had the largest absolute change of degree among the top 20 proteins, thus we selected cro- tonase as our illustrative example (Figure 4). Crotonase catalyses the second step in the beta-oxidation pathway of fatty acid metabolism (42), and is a key member of the cro- tonase protein superfamily (43). Beta-oxidation takes place primarily in the mitochondrion (44). Crotonase has only a mitochondrial ComPPI localization with experimental evi- dence, which is in agreement with its cellular function.
Crotonase has 71 interacting partners in the integrated data set, of which only 8 is present in the mitochondrion, and only 5 have an interaction score equal or higher than 0.8. After the manual review of crotonase neighbours, it turned out that only one of the 8 mitochondrial interactors (mitochondrial Hsp70, (45)) has experimental evidence for
by guest on February 2, 2015http://nar.oxfordjournals.org/Downloaded from
Nucleic Acids Research, 2015, Vol. 43, Database issue D491
Figure 4. Advantages of the ComPPI data set to filter biologically unlikely interactions and to predict compartment-specific, new properties and func- tions. The figure shows the interactions of crotonase (enoyl-CoA hydratase, UniProt ID: P30084), involved in fatty acid catabolism having a mitochon- drial localization, and its first neighbours supported with experimental evidence before and after filtering to mitochondrial localization. Interac- tions with an Interaction Score below 0.80 are shown with dashed lines. On one hand, out of the original 71 neighbours of crotonase only 8 remain as mitochondrial interacting partners with a significantly higher average In- teraction Score than the whole first-neighbour network, which highlights the importance of compartment-specific filtering in the detection of high- confidence interactors in a subcellular localization-dependent manner. On the other hand, the blue circle of the upper left side of the figure shows those cytosolic crotonase interacting partners, which are involved in apop- tosis, a recently discovered function of crotonase (45–47). Thus, the very same example also reveals a potential new function of crotonase, which partially involves its unexpected cytosolic localization, which was recently verified experimentally (46).
mitochondrial localization. Mitochondrial localization of the other 7 interactors is not based on strong evidence, while 63 out of 71 interactors have no known mitochondrial local- ization at all. Figure4shows the interactome of crotonase and its 71 first neighbours containing 428 edges. In the mito- chondrial interaction subset only 13 edges remained, while the high-confidence part contains only 10 interactions (Fig- ure4). Second neighbours of crotonase contain 82% of the interactome, and their network contains 14 803 nodes and 319 305 edges. The filtered mitochondrial network of the second neighbours is much smaller, having only 2107 nodes and 8381 interactions.
ComPPI-based prediction of new or non-conventional func- tions. Importantly, 52 out of the 71 interactors, and more specifically, 7 out of the 8 mitochondrial interacting part- ners of crotonase have cytosolic localization with a lo- calization probability over 0.95. This indicates that cro- tonase may have a cytosolic localization as well. Indeed, crotonase was shown to be overexpressed and localized in the cytosol in hepatocarcinoma cells, where it contributes to lymphatic metastatis (46). GO (19) biological process term enrichment analysis of the mitochondrial crotonase interacting partners using BiNGO (21) revealed that be- sides the known function of the crotonase in ‘catabolic pro- cess’ the ‘negative regulation of apoptosis’ and related terms were also significantly enriched (Supplementary Table S6).
In agreement with this, previous studies showed that cro- tonase is overexpressed in several cancer types (47), and the knockdown of crotonase decreased cell viability and en- hanced cisplatin-induced apoptosis in hepatocellular carci- noma (48). The anti-apoptotic effect of crotonase also ex- ists in breast cancer, where its down-regulation potentiates PP2-induced apoptosis (49).
These findings may implicate that the high ratio of ‘bi- ologically unlikely’ interactions may also be a result of a transient and dynamic cytosolic subcellular localization of crotonase, where the enzyme may be involved in cur- rently not widely crotonase-associated biological processes, such as the inhibition of apoptosis. Importantly, these compartment-specific crotonase functions may be applied as potential therapeutic targets in the treatment of hepato- cellular carcinoma or breast cancer.
In summary, the crotonase example shows the utility of ComPPI both (i) to filter low-confidence interactions concentrating on high-confidence subcellular localizations and (ii) to predict unknown biological functions in previ- ously unknown or non-conventional subcellular localiza- tions. Another example of ComPPI-based prediction of po- tential, novel functions besides crotonase, is Monopolar Spindle 1 protein (MPS1) having a centromere-associated cytosolic localization (50). We identified a number of rela- tively undiscovered MPS1 functions related to the ComPPI analysis of nuclear MPS1 interactome as detailed in Sup- plementary Figure S7 and Supplementary Table S6.
CONCLUSIONS AND FUTURE DIRECTIONS
In summary, ComPPI provides a unique data set for the analysis of protein–protein interaction networks at the sub- cellular level. The assembly of the integrated ComPPI database with manual curation protocols (Figure1) pro- vides an improvement of both coverage and data quality.
ComPPI subcellular localization data have a novel struc- ture in order to incorporate localizations from different data sources (Figure 3 and Supplementary Figure S4), and to reveal compartment-specific biological functions based on the analysis of the interactomes extended with high-resolution localization data in a hierarchical struc- ture. With the use of the optimized Localization and In- teraction Scores (Figure 2) high-confidence interactomes could be created for further investigation in the field of compartment-specific biological processes (15).
by guest on February 2, 2015http://nar.oxfordjournals.org/Downloaded from
D492 Nucleic Acids Research, 2015, Vol. 43, Database issue
Comparison of integrated protein–protein interaction data and the compartmentalized interactome allow the fil- tering of biologically unlikely interactions, where the inter- acting partners have no common subcellular localization.
Our examples (Figure4and Supplementary Figure S7) il- lustrate that besides filtering, ComPPI has a strong predic- tive power to find new localizations of the proteins based on the underlying network or to suggest new compartment- specific biological functions. The comprehensive data set for four species gives the opportunity to analyse evolutionary aspects of the compartmentalization, such as the prediction of subcellular localization ortologes (‘localogs’).
The web interface of ComPPI (http://ComPPI.
LinkGroup.hu) provides user-friendly search and down- load options. Besides the basic Search feature to explore and download the interactions of individual proteins, Advanced Settings could be applied to both query proteins and their interactors. Interactome-wide studies could be applied using the downloadable compartment-specific interactomes or the integrated protein–protein interaction data set, while the integrated subcellular localization data set is also available on the webpage for further analyses.
ComPPI is available at http://ComPPI.LinkGroup.hu, and has an open source code, which allows further improve- ment and the construction of ‘ComPPI-based databases’.
ComPPI is a community-annotated resource, which will be continuously enriched by a user community of experts helped by a public issue-tracking system and by feedbacks from the core-team, and will be updated and upgraded an- nually for minimum 5 years.
We plan to resolve current ComPPI limitations, such as the relatively low amount (29% of total) of experimental subcellular localization entries with the incorporation of newly available experimental data. Future plans include the development of improved gold standard-based Localiza- tion and network neighbourhood-based Interaction Scores, as well as further advanced download and search options, such as advanced localization-based network visualization and extended number of output formats.
In summary, the ComPPI-based interactomes introduced here provide a broader coverage, offer highly structured subcellular localization data, as well as offer Localization and Interaction confidence Scores, all in a user-friendly manner. Importantly, ComPPI enables the user to filter bi- ologically unlikely interactions, where the two interacting proteins have no common subcellular localizations, and to predict novel subcellular localization as well as localization- based properties, such as compartment-specific biological functions.
SUPPLEMENTARY DATA
Supplementary Dataare available at NAR Online.
ACKNOWLEDGEMENT
Authors acknowledge the members of the LINK-Group (http://LinkGroup.hu) and Cellular Network Biology Group (http://NetBiol.elte.hu) for their advice, as well as Judit Gyurk ´o for the design of the ComPPI website.
FUNDING
Hungarian Science Foundation [OTKA-K83314]; Fellow- ship in computational biology at The Genome Analysis Centre (Norwich, UK) in partnership with the Institute of Food Research (University of Norwich, UK); Biotechno- logical and Biosciences Research Council, UK [to T.K.];
J´anos Bolyai Scholarship of the Hungarian Academy of Sciences [to T.K.]. Funding for open access charge: Hun- garian Science Foundation [OTKA-K83314].
Conflict of interest statement.None declared.
REFERENCES
1. Hao,N. and O’Shea,E.K. (2012) Signal-dependent dynamics of transcription factor translocation controls gene expression.Nat.
Struct. Mol. Biol.,19, 31–39.
2. Firth,S.M. and Baxter,R.C. (2002) Cellular actions of the insulin-like growth factor binding proteins.Endocr. Rev.,23, 824–854.
3. Azar,W.J., Zivkovic,S., Werther,G.A. and Russo,V.C. (2014) IGFBP-2 nuclear translocation is mediated by a functional NLS sequence and is essential for its pro-tumorigenic actions in cancer cells.Oncogene, 33, 578–588.
4. Semenza,G.L. (2009) Regulation of oxygen homeostasis by hypoxia-inducible factor 1.Physiology (Bethesda),24, 97–106.
5. Koh,G.C.K.W., Porras,P., Aranda,B., Hermjakob,H. and
Orchard,S.E. (2012) Analyzing protein-protein interaction networks.
J. Proteome Res.,11, 2014–2031.
6. Vidal,M., Cusick,M.E. and Barab´asi,A.-L. (2011) Interactome networks and human disease.Cell,144, 986–998.
7. Bulusu,K.C., Tym,J.E., Coker,E.A., Schierz,A.C. and Al-Lazikani,B.
(2014) canSAR: updated cancer research and drug discovery knowledgebase.Nucleic Acids Res.,42, D1040–D1047.
8. De Las Rivas,J. and Fontanillo,C. (2010) Protein–protein interactions essentials: key concepts to building and analyzing interactome networks.PLoS Comput. Biol.,6, e1000807.
9. von Mering,C., Krause,R., Snel,B., Cornell,M., Oliver,S.G., Fields,S.
and Bork,P. (2002) Comparative assessment of large-scale data sets of protein-protein interactions.Nature,417, 399–403.
10. Kamburov,A., Stelzl,U., Lehrach,H. and Herwig,R. (2013) The ConsensusPathDB interaction database: 2013 update.Nucleic Acids Res.,41, D793–D800.
11. UniProt Consortium. (2014) Activities at the Universal Protein Resource (UniProt).Nucleic Acids Res.,42, D191–D198.
12. Wiwatwattana,N. and Kumar,A. (2005) Organelle DB: a cross-species database of protein localization and function.Nucleic Acids Res.,33, D598–D604.
13. Levy,E.D., Landry,C.R. and Michnick,S.W. (2009) How perfect can protein interactomes be?Sci. Signal.,2, pe11.
14. Sprinzak,E., Sattath,S. and Margalit,H. (2003) How reliable are experimental protein–protein interaction data?J. Mol. Biol.,327, 919–923.
15. Lee,K., Sung,M.-K., Kim,J., Kim,K., Byun,J., Paik,H., Kim,B., Huh,W.-K. and Ideker,T. (2014) Proteome-wide remodeling of protein location and function by stress.Proc. Natl. Acad. Sci. U.S.A., 111, E3157–E3166.
16. Nastou,K.C., Tsaousis,G.N., Kremizas,K.E., Litou,Z.I. and Hamodrakas,S.J. (2014) The human plasma membrane peripherome:
visualization and analysis of interactions.Biomed. Res.
Int.,2014, 397145.
17. Sprenger,J., Fink,J.L. and Teasdale,R.D. (2006) Evaluation and comparison of mammalian subcellular localization prediction methods.BMC Bioinformat.,7, Suppl. 5:S3.
18. Chautard,E., Ballut,L., Thierry-Mieg,N. and Ricard-Blum,S. (2009) MatrixDB, a database focused on extracellular protein-protein and protein-carbohydrate interactions.Bioinformatics,25, 690–691.
19. Ashburner,M., Ball,C.A., Blake,J.A., Botstein,D., Butler,H., Cherry,J.M., Davis,A.P., Dolinski,K., Dwight,S.S., Eppig,J.T.et al.
(2000) Gene Ontology: tool for the unification of biology.Nat.
Genet.,25, 25–29.
by guest on February 2, 2015http://nar.oxfordjournals.org/Downloaded from
Nucleic Acids Research, 2015, Vol. 43, Database issue D493
20. Patil,A., Nakai,K. and Nakamura,H. (2011) HitPredict: a database of quality assessed protein-protein interactions in nine species.
Nucleic Acids Res.,39, D744–D749.
21. Maere,S., Heymans,K. and Kuiper,M. (2005) BiNGO: a Cytoscape plugin to assess overrepresentation of gene ontology categories in biological networks.Bioinformatics,21, 3448–3449.
22. Faria,D., Schlicker,A., Pesquita,C., Bastos,H., Ferreira,A.E.N., Albrecht,M. and Falc˜ao,A.O. (2012) Mining GO annotations for improving annotation consistency.PLoS ONE,7, e40519.
23. Barsky,A., Gardy,J.L., Hancock,R.E.W. and Munzner,T. (2007) Cerebral: a Cytoscape plugin for layout of and interaction with biological networks using subcellular localization annotation.
Bioinformatics,23, 1040–1042.
24. Huang,H., McGarvey,P.B., Suzek,B.E., Mazumder,R., Zhang,J., Chen,Y. and Wu,C.H. (2011) A comprehensive protein-centric ID mapping service for molecular data integration.Bioinformatics,27, 1190–1191.
25. Wein,S.P., C ˆot´e,R.G., Dumousseau,M., Reisinger,F., Hermjakob,H.
and Vizca´ıno,J.A. (2012) Improvements in the Protein Identifier Cross-Reference service.Nucleic Acids Res.,40, W276–W280.
26. Murali,T., Pacifico,S., Yu,J., Guest,S., Roberts,G.G. and Finley,R.L.
(2011) DroID 2011: a comprehensive, integrated resource for protein, transcription factor, RNA and gene interactions for Drosophila.
Nucleic Acids Res.,39, D736–D743.
27. Keshava Prasad,T.S., Goel,R., Kandasamy,K., Keerthikumar,S., Kumar,S., Mathivanan,S., Telikicherla,D., Raju,R., Shafreen,B., Venugopal,A.et al., (2009) Human Protein Reference Database - 2009 update.Nucleic Acids Res.,37, D767–D772.
28. Pagel,P., Kovac,S., Oesterheld,M., Brauner,B.,
Dunger-Kaltenbach,I., Frishman,G., Montrone,C., Mark,P., St ¨umpflen,V., Mewes,H.-W.et al.(2005) The MIPS mammalian protein-protein interaction database.Bioinformatics,21, 832–834.
29. Chatr-Aryamontri,A., Breitkreutz,B.-J., Heinicke,S., Boucher,L., Winter,A., Stark,C., Nixon,J., Ramage,L., Kolas,N., O’Donnell,L.
et al.(2013) The BioGRID interaction database: 2013 update.Nucleic Acids Res.,41, D816–D823.
30. Yu,H., Tardivo,L., Tam,S., Weiner,E., Gebreab,F., Fan,C., Svrzikapa,N., Hirozane-Kishikawa,T., Rietman,E., Yang,X.et al.
(2011) Next-generation sequencing to generate interactome datasets.
Nat. Methods,8, 478–480.
31. Salwinski,L., Miller,C.S., Smith,A.J., Pettit,F.K., Bowie,J.U. and Eisenberg,D. (2004) The Database of Interacting Proteins: 2004 update.Nucleic Acids Res.,32, D449–D451.
32. Orchard,S., Ammari,M., Aranda,B., Breuza,L., Briganti,L., Broackes-Carter,F., Campbell,N.H., Chavali,G., Chen,C., del-Toro,N.et al.(2014) The MIntAct project–IntAct as a common curation platform for 11 molecular interaction databases.Nucleic Acids Res.,42, D358–D363.
33. Licata,L., Briganti,L., Peluso,D., Perfetto,L., Iannuccelli,M., Galeota,E., Sacco,F., Palma,A., Nardozza,A.P., Santonico,E.et al.
(2012) MINT, the molecular interaction database: 2012 update.
Nucleic Acids Res.,40, D857–D861.
34. Kandasamy,K., Keerthikumar,S., Goel,R., Mathivanan,S., Patankar,N., Shafreen,B., Renuse,S., Pawar,H., Ramachandra,Y.L., Acharya,P.K.et al.(2009) Human Proteinpedia: a unified discovery resource for proteomics research.Nucleic Acids Res.,37, D773–D781.
35. Uhlen,M., Oksvold,P., Fagerberg,L., Lundberg,E., Jonasson,K., Forsberg,M., Zwahlen,M., Kampf,C., Wester,K., Hober,S.et al.
(2010) Towards a knowledge-based Human Protein Atlas.Nat.
Biotechnol.,28, 1248–1250.
36. Lu,P., Szafron,D., Greiner,R., Wishart,D.S., Fyshe,A., Pearcy,B., Poulin,B., Eisner,R., Ngo,D. and Lamb,N. (2005) PA-GOSUB: a searchable database of model organism protein sequences with their predicted Gene Ontology molecular function and subcellular localization.Nucleic Acids Res.,33, D147–D153.
37. Pierleoni,A., Martelli,P.L., Fariselli,P. and Casadio,R. (2007) eSLDB:
eukaryotic subcellular localization database.Nucleic Acids Res.,35, D208–D212.
38. Sprenger,J., Lynn Fink,J., Karunaratne,S., Hanson,K.,
Hamilton,N.A. and Teasdale,R.D. (2008) LOCATE: a mammalian protein subcellular localization database.Nucleic Acids Res.,36, D230–D233.
39. Wiwatwattana,N., Landau,C.M., Cope,G.J., Harp,G.A. and Kumar,A. (2007) Organelle DB: an updated resource of eukaryotic protein localization and function.Nucleic Acids Res.,35, D810–D814.
40. Hoelz,A., Debler,E.W. and Blobel,G. (2011) The structure of the nuclear pore complex.Annu. Rev. Biochem.,80, 613–643.
41. Brameier,M., Krings,A. and MacCallum,R.M. (2007)
NucPred–predicting nuclear localization of proteins.Bioinformatics, 23, 1159–1160.
42. Waterson,R.M. and Hill,R.L. (1972) Enoyl Coenzyme A Hydratase (Crotonase): catalytic properties of Crotonase and its possible regulatory role in fatty acid oxidation.J. Biol. Chem.,247, 5258–5265.
43. Hamed,R.B., Batchelar,E.T., Clifton,I.J. and Schofield,C.J. (2008) Mechanisms and structures of crotonase superfamily enzymes–how nature controls enolate and oxyanion reactivity.Cell. Mol. Life Sci., 65, 2507–2527.
44. Turteltaub,W. and Murphy,A. (1987) Subcellular localization and capacity of ß-oxidation and aldehyde dehydrogenase in porcine liver.
Arch. Biochem. Biophys.,255, 120–126.
45. Bhattacharyya,T., Karnezis,A.N., Murphy,S.P., Hoang,T., Freeman,B.C., Phillips,B. and Morimoto,R.I. (1995) Cloning and subcellular localization of human mitochondrial hsp70.J. Biol.
Chem.,270, 1705–1710.
46. Zhang,J., Sun,M., Li,R., Liu,S., Mao,J., Huang,Y., Wang,B., Hou,L., Ibrahim,M.M. and Tang,J. (2013) Ech1 is a potent suppressor of lymphatic metastasis in hepatocarcinoma.Biomed. Pharmacother., 67, 557–560.
47. Yeh,C.-S., Wang,J.-Y., Cheng,T.-L., Juan,C.-H., Wu,C.-H. and Lin,S.-R. (2006) Fatty acid metabolism pathway play an important role in carcinogenesis of human colorectal cancers by
microarray-bioinformatics analysis.Cancer Lett.,233, 297–308.
48. Chen,Z., Dai,Y.-C., Chen,Z.-X., Xie,J.-P., Zeng,W., Lin,Y.-Y. and Tan,Q.-H. (2013) Knockdown of ECHS1 protein expression inhibits hepatocellular carcinoma cell proliferation via suppression of Akt activity.Crit. Rev. Eukaryot. Gene Exp.,23, 275–282.
49. Liu,X., Feng,R. and Du,L. (2010) The role of enoyl-CoA hydratase short chain 1 and peroxiredoxin 3 in PP2-induced apoptosis in human breast cancer MCF-7 cells.FEBS Lett.,584, 3185–3192.
50. Fisk,H.A., Mattison,C.P. and Winey,M. (2003) Human Mps1 protein kinase is required for centrosome duplication and normal mitotic progression.Proc. Natl. Acad. Sci. U.S.A.,100, 14875–14880.
by guest on February 2, 2015http://nar.oxfordjournals.org/Downloaded from
Supplementary Material to
ComPPI: a cellular compartment-specific database for protein- protein interaction network analysis
Daniel V. Veres
1, Dávid M. Gyurkó
1, Benedek Thaler
1,2, Kristóf Z. Szalay
1, Dávid Fazekas
3, Tamás Korcsmáros
3,4,5and Peter Csermely
1,*1Department of Medical Chemistry, Semmelweis University, Budapest, Hungary; 2Faculty of Electrical Engineering and Informatics, Budapest University of Technology and Economics, Budapest, Hungary;
3Department of Genetics, Eötvös Loránd University, Budapest, Hungary; 4TGAC, The Genome Analysis Centre, Norwich, UK; 5Gut Health and Food Safety Programme, Institute of Food Research, Norwich, UK;
*To whom correspondence should be addressed. Tel: +361-459-1500; Fax: +361-266-3802; Email:
csermely.peter@med.semmelweis-univ.hu; The authors wish it to be known that, in their opinion, the first 2 authors should be regarded as joint First Authors.
Table of Contents
Supplementary Figure S1. The role of multiple subcellular localizations on the example of IGFBP-2 and HIF-1 Alpha proteins. ... 2 Supplementary Figure S2. The localization tree used for the ComPPI subcellular localization data integration. ... 4 Supplementary Figure S3. The overlap between subcellular localization and protein-protein interaction input databases used in the assembly of ComPPI. ... 6 Supplementary Figure S4. Advantages of multiple localization evidence. ... 10 Supplementary Figure S5. The distribution of the ComPPI Localization and Interaction Scores.
... 12 Supplementary Figure S6. Optimization of the ComPPI localization evidence type weights. .... 15 Supplementary Figure S7. Advantages of ComPPI: prediction of compartment-specific, new properties and functions of MPS1. ... 18 Supplementary Table S1. Comparison of ComPPI with similar tools and databases... 20 Supplementary Table S2. Statistics of the ComPPI database. ... 22 Supplementary Table S3. Comparison of the ComPPI content to the input databases, and the effects of our filtering algorithms and manual validation steps... 25 Supplementary Table S4. Mapping of high resolution subcellular localization data into major cellular components. ... 28 Supplementary Table S5. Importance of the removal of localization-based biologically unlikely interactions. ... 30 Supplementary Table S6. The results of the Gene Ontology biological process enrichment analysis of the two example proteins, crotonase and MPS1. ... 33 Supplementary References ... 35
Supplementary Figure S1. The role of multiple subcellular localizations on the example of IGFBP-2 and HIF-1 Alpha proteins.
Panel (A) depicts the compartment-specific functions of IGFBP-2. IGFBP-2 is a secreted (dark blue), predominantly extracellular (green) protein involved in insulin growth factor (IGF) signalling (1).
IGFBP-2 is also localized in the nucleus (orange), where it is required for the activation of VEGF- mediated angiogenesis (2). This binary function of IGFBP-2 turned out to be an important prognostic biomarker in several cancer types, such as breast cancer (3). Panel (B) shows another important example, HIF-1 Alpha, which is a member of the hypoxia inducible factor (HIF) family, and has a key importance in the maintenance of cellular oxygen homeostasis, particularly in the response to hypoxia (4). In order to act as a transcription factor, HIF-1 Alpha has to translocate from the cytosol (light blue) into the nucleus (orange). HIF-1 Alpha and the aryl hydrocarbon receptor nuclear translocator (ARNT) form a heterodimer in the nucleus, which is required for their stable nuclear association (5). This regulated transport has key role in HIF-1 Alpha activity control both in healthy conditions (6) and in the development of cancer (7).
2
Supplementary Figure S2. The localization tree used for the ComPPI subcellular localization data integration.
ComPPI subcellular localization data are assembled from several sources with different naming conventions and resolution, therefore a standardization step is required before integration. We built a non-redundant, hierarchical subcellular localization tree based on more than 1,600 Gene Ontology (8) cellular component terms manually. The tree structure is needed to separate the high resolution subcellular localization data unequivocallyto the 6 major cellular compartments of low resolution for further analysis (Supplementary Table S4). On the example shown we demonstrate the tree structure on a segment of the hierarchical subcellular localization tree with the nucleus in focus. The high resolution data, such as the components of the nuclear pore complex, are highlighted in orange at the bottom part of the figure. The whole subcellular localization tree is downloadable (http://www.linkgroup.hu/pic/loctree.svg), or available online:
http://bificomp2.sote.hu:22422/comppi/files/c6f5587545cca11928563be40a0f8d6bf4bf45b2/databases /loctree/loctree.textile
4
Supplementary Figure S3. The overlap between subcellular localization and protein-protein interaction input databases used in the assembly of ComPPI.
Panels (A) and (B) show the overlap between the source subcellular localization and protein-protein interaction (interactome) databases graphically for all the data and after filtering by species as well.
Nodes in the networks symbolize the source databases, their size is proportional to the number of proteins originated from the given database. Edges connecting the nodes represent the overlap, their width correlates with the number of common proteins in the interconnected databases. Interestingly, these graphs are fully connected, e.g. all databases share proteins with each other (except DroID, a D.
melanogaster-specific database, which has no overlap with databases lacking fruit fly data). The reason is usually the redundancy between the databases (for example MINT and IntAct share their data as part of the MIntAct project (9)).
Panels (C) and (D) display numerically the same data as Panel (A) and (B), respectively: the number of proteins (Y axis) are plotted for every input database (X axis), each bar represents an edge from Panel (A) or (B). Significant differences can be observed in the amount of source data provided by the input databases.
Panel (E) shows the number of proteins (Y axis) per source database (X axis) for the given species compared to the number of proteins in ComPPI (highlighted in orange). The number of common proteins in all source databases, in databases with more than 5000 proteins, and only in interactome databases are also represented on the charts. Panel (F) shows the number of interactions (Y axis) for the given species per interactome source databases (X axis) compared to the number of proteins in ComPPI (highlighted in orange).
Abbreviations: HPA, Human Protein Atlas; H.Proteinpedia, Human Proteinpedia
6
8
Supplementary Figure S4. Advantages of multiple localization evidence.
The Venn-diagrams represents the number of proteins with experimental, unknown, predicted, or mixed localization evidence in the integrated ComPPI subcellular localization dataset and in the sub- dataset of ComPPI containing GO-based localization data for its proteins. Interestingly, the number of proteins with only unknown localization evidence is much lower in ComPPI compared to its GO-subset (57%), while the number of proteins with experimental (264%) and mixed evidence (376%) is higher, than the estimation based on the number of proteins in ComPPI compared to the GO sub-dataset (203%). These findings implicate that the integration of subcellular localization data from different sources having different localization evidence types increases not only the quantity of the data, but their reliability as well.
10
Supplementary Figure S5. The distribution of the ComPPI Localization and Interaction Scores.
Panel (A) shows the distribution histogram of the Localization Scores for the 4 species of ComPPI separated by the 6 major cellular compartments containing all subcellular localization data. The X axis represents the confidence intervals of the Localization Score between 0 and 1 by 0.1 increments, while the Y axis shows the number of proteins belonging to the given compartment. On panel (B) the distribution histogram of the Interaction Scores is shown for the 4 species of ComPPI containing the integrated protein-protein interaction data. The X axis depicts the confidence intervals of the Interaction Score between 0 and 1 by 0.1 increments, while the Y axis shows the number of interactions in the given confidence interval. See more about the Localization and Interaction Scores in Figure 2 and Supplementary Figure S6.
12
14