For Peer Review
Hemin and bile pigments are the secondary structure regulators of intrinsically disordered antimicrobial peptides
Ferenc Zsila,
[a]Tünde Juhász,
[a]Szilvia Bősze,
[b]Kata Horváti,
[b]Tamás Beke-Somfai
[a]Corresponding Author: Ferenc Zsila*
[a]Keywords: bilirubin; biliverdin; circular dichroism spectroscopy; CM15; fluorescence quenching; hemin; intrinsic disorder; melittin;
secondary structure
Introduction
Heme serves as an essential prosthetic group for a wide range of proteins.1,2 Besides the vitally important catalytic and oxygen transfer functions, compelling evidences have been accumulated in recent years which point out that heme, as a regulator molecule, is also involved in numerous cellular and molecular pathways, such as cell proliferation/differentiation, gene transcription/translation and control of ion channel function.3-7 However, the underlying molecular mechanisms by which heme modulates the function of protein targets are poorly understood. From this point of view, the enzymatic degradation products of heme such as biliverdin, the strongly lipophilic bilirubin and its water soluble conjugate have received much less attention. Employing circular dichroism (CD), UV/VIS absorption, and fluorescence spectroscopic techniques, we report herein that hemin and related bile pigments (Scheme 1) can substantially affect the natively unfolded structure of melittin and its hybrid derivative called CM15 (Table 1).
Melittin accounts for major percentage of the crude venom of the honey bee Apis melifera. Its maturated form shows multiple pharmacological actions including antibacterial, antiviral, anticancer and anti-inflammatory effects.8-12 According to the primary sequence, the N-terminal part of melittin (1-20) consists mostly of hydrophobic/neutral residues whereas the C- terminal (21-26) is enriched in polar, basic side chains (Table 1). This unbalanced charge arrangement renders the peptide chain amphipathic. Melittin contains a lone proline residue that gives rise to a flexible hinge region at the middle of the
molecule. Melittin is freely soluble in water and exhibits a monomer-tetramer equilibrium which sensitively depends on experimental conditions. The increase of the ionic strength (~1.5 M NaCl), pH (>8) and/or the peptide concentration (~0.1 mM) of the solution promote the tetramerization and the concomitant helical folding of melittin.13-15 In dilute aqueous environment the extended, monomeric peptide chains are mainly unstructured but also contain two short, somewhat ordered segments (residues 5-9 and 14-20).16 Upon binding to lipid membranes or in membrane mimetic environments, the α- helical content of melittin rises sharply from ~0-20% to ~70%.17-
19 CM15 is a synthetic cecropin-melittin hybrid peptide that preserves the antimicrobial activity of the 37-mer cecropin A (from silk moth) but displays decreased hemolysis compared to
[a] Biomolecular Self-Assembly Group
Institute of Materials and Environmental Chemistry, Research Centre for Natural Sciences
Magyar tudósok körútja 2, Budapest, Hungary Fax: (+) 36-382 6200
E-mail: zsila.ferenc@ttk.mta.hu
[b] MTA-ELTE Research Group of Peptide Chemistry Eötvös Loránd University
Pázmány Péter sétány 1/A, Budapest, Hungary
Received: ((will be filled in by the editorial staff)) Revised: ((will be filled in by the editorial staff)) Published online: ((will be filled in by the editorial staff))
Abstract: The interaction of protoporphyrin compounds of human origin with the major bee venom component melittin (26 a.a., Z +6) and its hybrid derivative (CM15, 15 a.a., Z +6) were studied by a combination of various spectroscopic methods. Throughout a two-sate, concentration dependent process, hemin and its metabolites (biliverdin, bilirubin, bilirubin ditaurate) increase the parallel β-sheet content of the natively unfolded melittin suggesting the oligomerization of the peptide chains. In contrast, α-helix promoting effect was observed with the also disordered but more cationic CM15. According to fluorescence quenching experiments, the sole Trp residue of melittin is the key player during the binding, in the vicinity of which the first pigment molecule is accommodated presumably making indole-porphyrin π-π stacking interaction. As circular dichroism titration data suggest,
cooperative association of additional ligands subsequently occurs resulting in multimeric complexes with an apparent dissociation constant ranged from 20 to 65 µM.
Spectroscopic measurements conducted with the bilirubin catabolite uro- and stercobilin refer to the requirement of intact dipyrrinone moieties for inducing secondary structure transformations. The binding topography of porphyrin rings on a model parallel β-sheet motif was evaluated by VIS absorption spectroscopy and computational modeling showing a slipped-cofacial binding mode responsible for the red shift and hypochromism of the Soret absorption band.
Our results may aid to recognize porphyrin-responsive binding motifs of biologically relevant, intrinsically disordered peptides and proteins, where transient conformations play a vital role in their functions.
1
2
3
4
5
6
7
8
9
10
11
12
13
14
15
16
17
18
19
20
21
22
23
24
25
26
27
28
29
30
31
32
33
34
35
36
37
38
39
40
41
42
43
44
45
46
47
48
49
50
51
52
53
54
55
56
57
58
59
60
For Peer Review
melittin.20,21 It consists of 15 residues from the N-terminus of cecropin A (1-7) and melittin (2-9) possessing much higher average charge per residues than its congeners (Table 1).
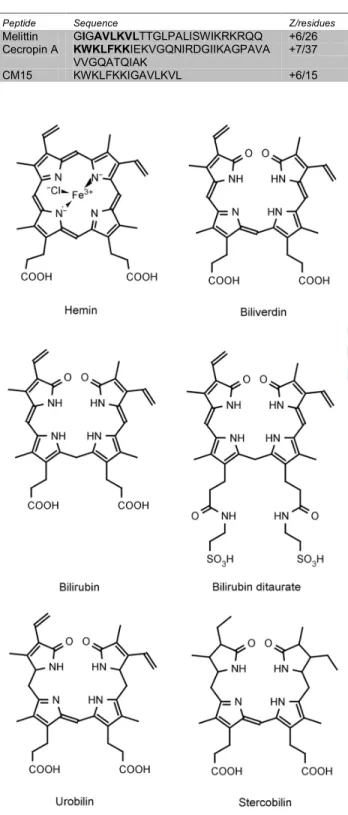
TABLE 1 Amino acid composition and net charge (Z) at neutral pH of melittin, cecropin A and CM15. Note that positive charge at the N- terminus increases Z by 1 unit. Melittin and CM15 used in this work are amidated at the C-terminus. Parent sequences in melittin and cecropin A are indicated by bold.
Peptide Sequence Z/residues
Melittin GIGAVLKVLTTGLPALISWIKRKRQQ +6/26 Cecropin A KWKLFKKIEKVGQNIRDGIIKAGPAVA
VVGQATQIAK
+7/37
CM15 KWKLFKKIGAVLKVL +6/15
SCHEME 1 The chemical structure of hemin and bile pigments used in this study.
Materials and Methods
See Supporting Information.
Results and Discussion
Pigment binding induced conformational changes in melittin
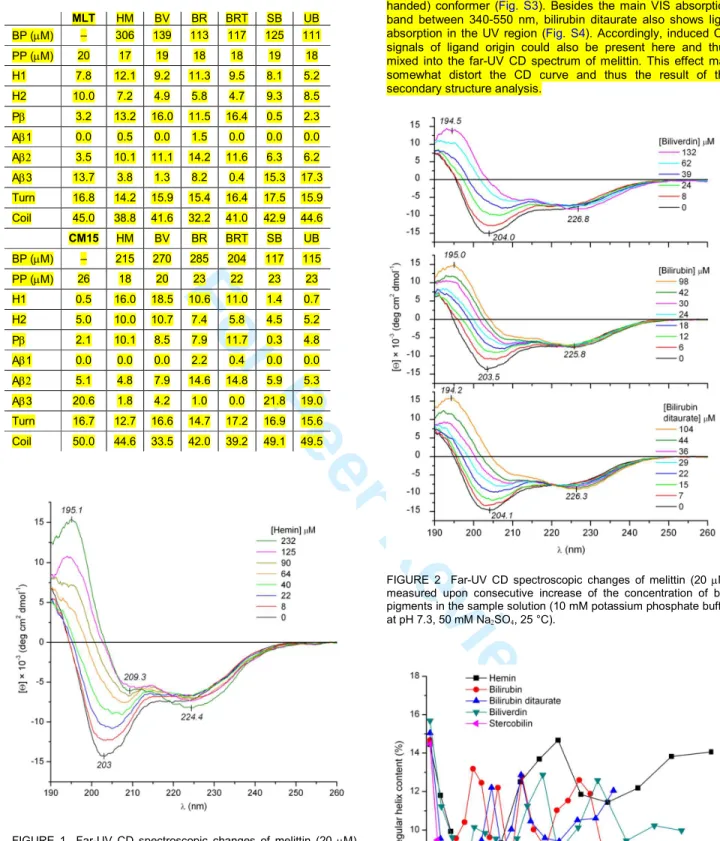
The far-UV CD spectrum of free melittin measured in pH 7.3 potassium phosphate buffer is dominated by a negative peak centered around 203 nm, together with a weaker positive band below 195 nm and a shoulder above 215 nm (Fig. 1). Regarding the secondary structure, this ellipticity profile refers to the prevalence of the unordered fraction but is also indicative of a significant α-helix and/or β-sheet content. In line with this qualitative assessment, deconvolution of the CD curve showed the dominance of the disordered structure (~45%) and a minor α-helix and β-sheet contribution (Table 2). Upon successive addition of hemin, this CD pattern was converted into a new one.
The amplitude of the main negative band gradually diminished and its λmax shifted to about 209 nm. Concomitantly, the short- wavelength positive peak gained intensity and displayed a red shift up to 195 nm (Fig. 1). Additionally, the bathochromically shifted lowest energy broad band became resolved with appreciable intensity increase. According to the secondary structure analysis, these spectral transformations reflect the four- fold increase of the parallel β-sheet together with the modest rise of the regular α-helix content of the peptide (Table 2). Moreover, the reverse of the relaxed/right-hand twisted sheet ratio within the antiparallel β-sheet subgroups points to some additional conformational redistribution. Upon using biliverdin, bilirubin, and bilirubin ditaurate analogous CD spectral changes were witnessed (Fig. 2, Table 2). Both the visual comparison of the CD curves (Fig. S1) and the secondary structure data show that the parallel β-sheet promoting ability of hemin and bile pigments is close to each other (Table 2). This kind of structural transition of melittin has not been reported previously and is in contrast to the result of membrane interactions, when the low helicity of the peptide rises sharply to ~70%.17,18 The development of parallel β-sheet fraction in the pigment loaded form of melittin suggests intermolecular sheet formation, i.e. the ligand-mediated oligomerization of the peptide chains.
The BeStSel algorithm used in this work to predict the secondary structure content discriminates between two kinds of α-helical components.22,23 The regular, middle part of the helix where all the backbone-backbone H-bonds are formed (H1) and the so called distorted helix (H2) that corresponds to 2-2 residues at both ends of the helix with unsatisfied H-bonding (Table 2).
Interestingly, at the beginning of the CD titrations an abrupt,
~50% decline of the H1 fraction was detected which was completed around equimolar pigment-peptide composition (Fig.
3). Subsequent addition of the ligands, however, started the helix content to regain reaching a somewhat higher level at the end of the titration (Table 2). In this respect, hemin was the most effective substance which is also reflected by the emergence of the resolved, 209 nm negative branch of the π-π* exciton CD couplet of the right-handed α-helix (Fig. S1).24
TABLE 2 Estimation of the secondary structure content of free and ligand-loaded forms of melittin (MLT) and CM15. Far-UV CD spectral data were analysed by using the BeStSel online platform available at bestsel.elte.hu. BP, bile pigment; PP, peptide; HM, hemin; BV, biliverdin; BR, bilirubin; BRT, bilirubin ditaurate; SB, stercobilin; UB, urobilin; H1, regular α-helix; H2, distorted α-helix; Pβ, parallel β- sheet; Aβ1, left-hand twisted β-sheet; Aβ2, relaxed β-sheet; Aβ3, right-hand twisted β-sheet.22
1
2
3
4
5
6
7
8
9
10
11
12
13
14
15
16
17
18
19
20
21
22
23
24
25
26
27
28
29
30
31
32
33
34
35
36
37
38
39
40
41
42
43
44
45
46
47
48
49
50
51
52
53
54
55
56
57
58
59
60
For Peer Review
MLT HM BV BR BRT SB UB BP (µM) – 306 139 113 117 125 111
PP (µM) 20 17 19 18 18 19 18
H1 7.8 12.1 9.2 11.3 9.5 8.1 5.2
H2 10.0 7.2 4.9 5.8 4.7 9.3 8.5
Pβ 3.2 13.2 16.0 11.5 16.4 0.5 2.3
Aβ1 0.0 0.5 0.0 1.5 0.0 0.0 0.0
Aβ2 3.5 10.1 11.1 14.2 11.6 6.3 6.2 Aβ3 13.7 3.8 1.3 8.2 0.4 15.3 17.3 Turn 16.8 14.2 15.9 15.4 16.4 17.5 15.9 Coil 45.0 38.8 41.6 32.2 41.0 42.9 44.6 CM15 HM BV BR BRT SB UB BP (µM) – 215 270 285 204 117 115
PP (µM) 26 18 20 23 22 23 23
H1 0.5 16.0 18.5 10.6 11.0 1.4 0.7
H2 5.0 10.0 10.7 7.4 5.8 4.5 5.2
Pβ 2.1 10.1 8.5 7.9 11.7 0.3 4.8
Aβ1 0.0 0.0 0.0 2.2 0.4 0.0 0.0
Aβ2 5.1 4.8 7.9 14.6 14.8 5.9 5.3 Aβ3 20.6 1.8 4.2 1.0 0.0 21.8 19.0 Turn 16.7 12.7 16.6 14.7 17.2 16.9 15.6 Coil 50.0 44.6 33.5 42.0 39.2 49.1 49.5
FIGURE 1 Far-UV CD spectroscopic changes of melittin (20 µM) measured upon consecutive increase of the concentration of hemin in the sample solution (10 mM potassium phosphate buffer at pH 7.3, 50 mM Na2SO4, 25 °C).
Noticeably, upon melittin association bilirubin ditaurate displays a negative-positive induced CD band pair allied to its VIS absorption band (Fig. S2). Such an exciton CD couplet was reported by several times for the macromolecular complexes of bilirubin and reflects the enantioselective binding of the pigment molecules to the chiral host.25-30 In line with the so called exciton chirality rule,31-33 the CD signal pattern shown in Fig. S2 indicates the slight binding preference of the M-helical (left-
handed) conformer (Fig. S3). Besides the main VIS absorption band between 340-550 nm, bilirubin ditaurate also shows light absorption in the UV region (Fig. S4). Accordingly, induced CD signals of ligand origin could also be present here and thus mixed into the far-UV CD spectrum of melittin. This effect may somewhat distort the CD curve and thus the result of the secondary structure analysis.
FIGURE 2 Far-UV CD spectroscopic changes of melittin (20 µM) measured upon consecutive increase of the concentration of bile pigments in the sample solution (10 mM potassium phosphate buffer at pH 7.3, 50 mM Na2SO4, 25 °C).
1
2
3
4
5
6
7
8
9
10
11
12
13
14
15
16
17
18
19
20
21
22
23
24
25
26
27
28
29
30
31
32
33
34
35
36
37
38
39
40
41
42
43
44
45
46
47
48
49
50
51
52
53
54
55
56
57
58
59
60
For Peer Review
FIGURE 3 Concentration dependent changes of the regular helix content (H1) of 20 µM melittin titrated with hemin and various bile pigments.
Pigment binding induced conformational changes in CM15 CM15 is even more disordered than melittin but responds distinctly to porphyrin derivatives (Fig. S5 and S6). Beside the slight increase of the parallel β-sheet fraction, a significant degree of helix content was induced with simultaneous reduction of the unordered fraction (Table 2). For instance, the biliverdin induced qualitative and quantitative CD spectral changes closely match to that obtained with heparin, the polyanionic helicogenic agent used in structural studies of disordered peptides and proteins (Fig. S7).34-36 In relation to bilirubin and its taurine conjugate, hemin and biliverdin were more effective helix promoters. These observations are similar to the impact of heme on the secondary structure of aggregating α-synuclein. In the presence of the pigment, this natively disordered protein adopts α-helical conformation instead of a β-sheet rich structure, the hallmark of pathological protein inclusions in the brain.37 Furthermore, the specific α-synuclein binding of porphyrin phtalocyanine tetrasulfonate has also been reported which results in the stabilization of helical structure of the membrane- associated protein.38 This small molecule-mediated structural effect has been attributed to aromatic stacking between the porphyrin ring and Phe/Tyr residues of α-synuclein. Likewise, the more prominent helix-inducing feature of hemin and biliverdin can tentatively be assigned to their aromatic stacking with the Trp (and Phe) side chain of CM15. Presumably due to structural reasons, bilirubins are less suitable for this purpose. The so called ridge-tile conformation of these compounds differs sharply from the planar and close planar stereochemistry of hemin and biliverdin, respectively (Fig. S3).32,39,40
Estimation of melittin binding parameters of hemin and bile pigments
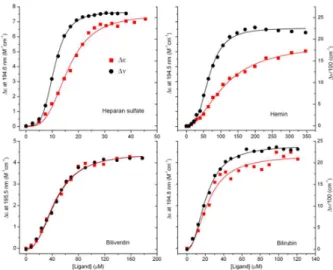
Two approaches were used to calculate the apparent dissociation constants (Kd) of ligand-melittin complexes. CD curve of the free peptide exhibits a zero crossing point around 194-195 nm (Fig. 1 and 2). Upon successive addition of the folding inducers, the CD signal at this wavelength begins to increase and finally shows saturation at high ligand/melittin molar ratios. On the other hand, spectral position of the zero crossing point is also varied during the titration displaying a gradual bathochromic shift (Fig. 1 and 2). Plotted against the inducer concentration, both of these numerical changes resulted in sigmoidal curves that are indicative of cooperative binding interactions (Fig. 4). Non-linear regression analysis of the data points yielded the Kd values and the Hill coefficients (h). Except for hemin, the binding parameters estimated from these different data sets are in close correlation but better fit was obtained by using the zero crossing shift (Table 3). Presumably, aqueous aggregation of the hemin molecules (vide infra) may be responsible for the large deviation of the stability constants distorting the CD intensities especially above the equimolar composition. For a reference, CD titration data obtained with heparan sulfate (not shown) were also analyzed and compared to previously published results.34 The good agreement between the dissociation constants refers to the reliability of our method for the quantitative assessment of small molecule-melittin interactions (Table 3).
TABLE 3 Ligand-melittin binding parameters (Kd and the Hill coefficient) obtained from non-linear regression analysis of CD spectroscopic data. ∆ṽ and ∆ε refer to the type of spectroscopic changes utilized for the calculations (see text for more details).
Ligand Kd
(µM)
h Method
Hemin 65.5 (±1.3) 112.9 (±5.1)
3.1 (±0.2) 1.9 (±0.1)
∆ṽ
∆ε Biliverdin 44.4 (±1.3)
45.5 (±1.4)
2.4 (±0.2) 2.5 (±0.2)
∆ṽ
∆ε Bilirubin 21.0 (±0.5)
23.2 (±1.6)
2.2 (±0.1) 2.1 (±0.3)
∆ṽ ∆ε Bilirubin
ditaurate 33.0 (±0.7) 35.4 (±1.4)
3.4 (±0.2) 2.7 (±0.3)
∆ṽ ∆ε Heparan
sulfate 10.7 (±0.1) 15.8 (±0.4)
4.1 (±0.1) 3.3 (±0.2)
∆ṽ
∆ε Heparan
sulfate
10.0a no data ITC
a: Kd from isothermal titration calorimetry (ITC).34
In relation to heparan sulfate, hemin and biliverdin are the weakest melittin binders. The disaccharide unit of heparan sulfate bears ~2-3 negative charges (Fig. S8) which are sterically separated from each other enabling to establish multiple ionic contacts with the cationic residues of melittin. In contrast, the acidic functions of hemin and biliverdin are located on the same side of the rigid porphyrin scaffold that limits conformational adaptation necessary for optimizing the binding interactions (Scheme 1). From this point of view, the structure of bilirubin and its conjugate encode a much larger flexibility which is reflected in their tighter melittin association (Table 3). These molecules can adopt two, nonsuperimposable mirror-image conformations similar to a half-opened book (Fig. S3). By rotation about the central –CH2– group, these isoenergetic species interconvert rapidly in solution via a succession of non- planar intermediates.39,40 Therefore, bilirubin can accommodate to a variety of macromolecular targets having binding sites of diverse topography.25-28,41,42
The Hill coefficients indicate the formation of multimeric pigment- melittin complexes where 2-3 ligand molecules are attached to a peptide chain (Table 3). According to earlier reports, bilirubin also binds to some peptides and polypeptides in dimeric and oligomeric forms.28,43
FIGURE 4 CD titration data of melittin plotted against the ligand concentration in the sample solutions. ∆ε: ∆ε/residue values calculated at the zero cross-over point of the CD curves. ∆ν: the shift in wavenumber of the zero cross-over point measured during the titrations. Solid lines are the results of non-linear curve fitting analysis performed by using the “One site - specific binding with Hill slope” equation built in the Graph Pad Prism software (ver. 6.01, San Diego, California, USA). The Kd values and the Hill coefficients (h) are listed in Table 3. Data for bilirubin ditaurate are very similar to that of bilirubin and thus are not shown..
1
2
3
4
5
6
7
8
9
10
11
12
13
14
15
16
17
18
19
20
21
22
23
24
25
26
27
28
29
30
31
32
33
34
35
36
37
38
39
40
41
42
43
44
45
46
47
48
49
50
51
52
53
54
55
56
57
58
59
60
For Peer Review
Melittin induced changes in the VIS absorption spectrum of porphyrin pigments
Since all ligand molecules used in this study exhibit characteristic absorption band above 300 nm, VIS absorbance curves of the free and peptide-loaded form of the pigments were recorded to gain further insight into the structural features of pigment-melittin complexes (Fig. 5). Upon addition of melittin, the Soret peak of hemin showed a moderate red shift, a broadening of envelope and hypochromism, i.e. an intensity loss.44,45 Contrary to this, the 379 nm band of biliverdin was hardly altered even in the two-fold molar excess of the peptide. It displays a very small hypochromism and a slight band broadening. These spectral differences are attributable to the distinct conformations of hemin and biliverdin: planarity of the hemin molecules allows them to attach close to each other along the peptide chain which favours exciton interaction between the π-π* transitions of the porphyrin chromophores. Depending on the orientation factor of the adjacent rings, the exciton coupling may produce various combinations of red/blue shift and hypo/hyperchromism of the respective absorption band. The bathochromic shift obtained in our experiments suggests the head-to-tail like rather than face-to-face arrangement of the melittin-bound hemin units.46
In contrast to hemin, steric repulsion between the lactamic carbonyl groups enforces biliverdin to adopt a non-planar, helical geometry.47 It seems from the very similar absorption curves displayed in Fig. 5 that this conformation prevents the spatial proximity of the peptide-bound biliverdin molecules, the prerequisite of intermolecular exciton interaction.
No induced CD signals were observed either with hemin or biliverdin (data not shown) suggesting the lack of stereospecific binding.
The bichromophoric bilirubin behaves as a molecular exciton.32 The π-π* electric dipole transition moments of the intramolecularly H-bonded, unconjugated dipyrrinone moieties are excitonically coupled resulting in a broad absorption band consisting of a longer- and a shorter-wavelength component.
The magnitudes as well as λmax values of such sub-bands are strictly dependent on the relative spatial disposition of the interacting transition moments.33,39 In the case of bilirubin, their amplitudes are nearly equal whereas for the conjugated derivative the longer-wavelength component is more intense (Fig.
5). This indicates that in bilirubin ditaurate the angle of intersection of the two planar dipyrrinone moiety is larger (Θ>
100º) than in the unconjugated form (Θ ~ 100º). Bilirubin- melittin interaction provokes a strong hypochromism and band broadening at the red edge of the spectrum (Fig. 5). Intensity loss can also be seen in the absorption spectrum of the conjugate but the envelope broadens toward the opposite, shorter-wavelength direction with the development of two, partially resolved peak centered around ~406 and ~447 nm (Fig.
5). In both cases, the hypochromism is indicative of the self- association (oligomerization) of the pigment molecules bound to the melittin matrix. During the binding process, however, the ridge-tile structure of free bilirubin (Θ ~ 100º) converts into a more extended shape (Θ > 100º) whereas opposite change occurs with the ditaurate derivative (Θ < 100º) resulting in a more compact conformation.28
Effect of sterco- and urobilin on the secondary structure of melittin and CM15
These water soluble fecal pigments are the products of bacterial reduction of bilirubin in the gut (Scheme 1).47 Racemic samples were used which thus do not exhibit intrinsic CD activity.
Strikingly, either with melittin or CM15, these compounds were unable to trigger conformational transitions witnessed by using hemin and bile pigments and caused only a moderate intensity reduction of the CD values and a small blue shift of the λmin (Fig.
S9). In proportion to the ligand concentration applied, the largest relative intensity decrease was measured at the beginning of the titration. This implies some initial structure altering effect which,
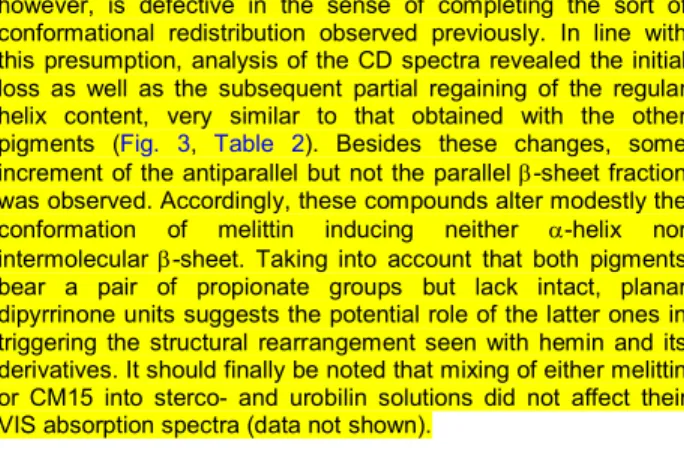
however, is defective in the sense of completing the sort of conformational redistribution observed previously. In line with this presumption, analysis of the CD spectra revealed the initial loss as well as the subsequent partial regaining of the regular helix content, very similar to that obtained with the other pigments (Fig. 3, Table 2). Besides these changes, some increment of the antiparallel but not the parallel β-sheet fraction was observed. Accordingly, these compounds alter modestly the conformation of melittin inducing neither α-helix nor intermolecular β-sheet. Taking into account that both pigments bear a pair of propionate groups but lack intact, planar dipyrrinone units suggests the potential role of the latter ones in triggering the structural rearrangement seen with hemin and its derivatives. It should finally be noted that mixing of either melittin or CM15 into sterco- and urobilin solutions did not affect their VIS absorption spectra (data not shown).
FIGURE 5 Effect of the addition of melittin on the main VIS absorption band of hemin and bile pigments (10 mM potassium phosphate buffer at pH 7.3, 50 mM Na2SO4, 25 °C).
Sensing of porphyrin binding to melittin via fluorescence quenching method
To obtain additional structural information on pigment-melittin complexes, fluorescence spectroscopy measurements were carried out. We exploited the intrinsic tryptophan (Trp) fluorescence which can sensitively report a binding event. The polarity decrease of the Trp microenvironment leads to a blue shift in the emission spectrum accompanied by intensity fluctuations as shown for peptides embedded into a hydrophobic protein or lipid interior. In other cases, the binding of a partner simply decreases the fluorescence intensity, which we observed for melittin in the presence of hemin-derived compounds.
Upon addition of porphyrin agents inducing gross conformational rearrangements detected by CD spectroscopy (Table 2), a significant quenching of the Trp emission was measured (Fig.
1
2
3
4
5
6
7
8
9
10
11
12
13
14
15
16
17
18
19
20
21
22
23
24
25
26
27
28
29
30
31
32
33
34
35
36
37
38
39
40
41
42
43
44
45
46
47
48
49
50
51
52
53
54
55
56
57
58
59
60
For Peer Review
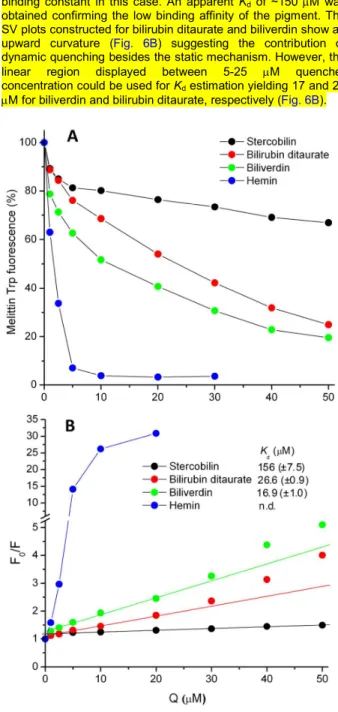
6A). Contrary to this, the emission decreasing effect of stercobilin was quite modest. For this compound, the Stern- Volmer (SV) plot gave rise to a straight line allowing to calculate the quenching constant (KSV) that is equivalent to the equilibrium binding constant in this case. An apparent Kd of ~150 µM was obtained confirming the low binding affinity of the pigment. The SV plots constructed for bilirubin ditaurate and biliverdin show an upward curvature (Fig. 6B) suggesting the contribution of dynamic quenching besides the static mechanism. However, the linear region displayed between 5-25 µM quencher concentration could be used for Kd estimation yielding 17 and 27 µM for biliverdin and bilirubin ditaurate, respectively (Fig. 6B).
FIGURE 6 (A): Effect of various porphyrin compounds on the Trp fluorescence of 2 µM melittin. Maximal emission intensities were corrected according to Eq. 1, normalized, and plotted against the quencher (Q) concentration. (B): Stern-Volmer plots of the titrations constructed according to Eq. 2 (see Supporting Information). Lines represent linear regression fit to the linear regions of the data, except for hemin where the data points were connected by straight lines to guide the eye. Kd values estimated from the linear regression analysis are shown.
In comparison to the constants derived from CD data (Table 3), a substantial deviation can be noted for biliverdin which might be related to the distinct phenomena detected by these techniques.
CD spectral changes refer to the overall conformational transformation of the peptide chains in which all residues make contribution. Conversely, however, fluorescence quenching
stems only from the sole Trp residue of melittin and as such it does not report information on the other side chains.
The most effective quenching was seen with hemin, which diminished even at 5 µM the Trp emission almost completely (Fig. 6A). This phenomenon can be attributed to the iron ion positioned adjacently to the indole ring within hemin-melittin complexes. Abrupt Trp fluorescence quenching by heme (and even non-heme) moieties has been reported previously and the effect was argued due to either energy or electron transfer from Trp to heme.48,49
It is worth to note that at low ligand concentrations (<5 µM), the emission has declined more sharply than at higher pigment loadings (Fig. 6A) suggesting the formation of an initial complex serving as a scaffold for the binding of additional molecules. As such, it is in analogy with the sudden loss of the helical content of melittin measured at the beginning of the CD titrations (Fig. 3).
Trp is a typical structure stabilizing side chain in proteins and peptides. In melittin it is the part of the fragment 14-20 shown to be more highly structured thank the rest of the sequence.16 According to these mutually supportive CD and fluorescence results, porphyrin-melittin binding can be described by a two- state scenario. It seems that the very first step of the binding process is the accommodation of a pigment molecule close to the indole ring giving rise to a sharp decline in the emission (Fig.
6A) and the simultaneous unfolding the ordered segment (Fig. 3).
During the second phase, cooperative association of additional ligands takes place. Noticeably, the importance of the aromatic residue-porphyrin ring interaction in the binding of heme to amyloid-β peptides has recently been demonstrated and proposed to be a key point in dismantle of the aggregates.50 Finally, it is worth to recall that both CD and fluorescence results refer to the involvement of sterco- and urobilin in the first stage only but they are unable to proceed with forming multimeric complexes what is thought to be required to the conformational conversion of the peptide.
Conclusions
Hemin and its metabolites are constantly produced in the human body and their levels show large fluctuations both under physiological and pathological conditions (e.g., neonatal hyperbilirubinemia, malaria, porphyrias, etc.). A plethora of clinical observations have indicated the beneficial effects of mildly elevated serum bilirubin level in reducing the prevalence of a variety of diseases such as diabetes, cardiovascular and even malignant disorders.51-53 Moreover, heme binding to amyloid-β peptides and the altered heme homeostasis in Alzheimer’s disease have also been demonstrated.50,54 There are serious lacuna, however, in understanding the chemical nature of hemin-peptide and bile pigment-peptide interactions which instigated us to study how these compounds affect the secondary structure of intrinsically disordered model peptides.
Our work supplies direct spectroscopic evidences on the complex, sequence dependent, significantly different structure modifying ability of hemin and its natural derivatives mediated by hydrophobic (Trp-porphyrin) and most likely ionic (Lys/Arg- propionate) forces. Being present in the extra- and intravascular space, these porphyrin agents thus can alter the biological activity of melittin and related antimicrobial peptides. In a more broader sense, it could be assumed that these pigments modulate not only the structure of peptidic compounds with external origin, but also endogenous proteins/peptides participating in intrinsic disorder-based interactions. The porphyrin derivates studied here allow a promising opportunity to explore transient conformations of bioactive (poly)peptides to better understand their regulatory functions.
1
2
3
4
5
6
7
8
9
10
11
12
13
14
15
16
17
18
19
20
21
22
23
24
25
26
27
28
29
30
31
32
33
34
35
36
37
38
39
40
41
42
43
44
45
46
47
48
49
50
51
52
53
54
55
56
57
58
59
60
For Peer Review
Acknowledgements
This work was funded by the Momentum programme of the Hungarian Academy of Sciences (LP2016-2), the National Competitiveness and Excellence Program, Hungary (NVKP_16- 1-2016-0007) and the BIONANO_GINOP-2.3.2-15-2016-00017b project. The Marie Curie fellowship for T. Beke-Somfai (MSCA-IF BARREL 660030) is greatly acknowledged.
Supporting information
Additional supporting information may be found in the online version of this article at the publisher’s website.
Description: Materials and Methods, Computational studies, Table S1, Figure S1-S10.
REFERENCES AND NOTES
1. Kleingardner JG, Bren KL. Biological significance and applications of heme C proteins and peptides.
Accounts Chem. Res. 2015;48:1845-1852.
2. Paoli M, Marles-Wright J, Smith A. Structure-function relationships in heme-proteins. DNA Cell. Biol.
2002;21:271-280.
3. Watanabe-Matsui M, Matsumoto T, Matsui T, Ikeda- Saito M, Muto A, Murayama K, Igarashi K. Heme binds to an intrinsically disordered region of Bach2 and alters its conformation. Arch. Biochem. Biophys.
2015;565:25-31.
4. Sahoo N, Goradia N, Ohlenschlager O, Schonherr R, Friedrich M, Plass W, Kappl R, Hoshi T, Heinemann SH. Heme impairs the ball-and-chain inactivation of potassium channels. Proc. Natl. Acad. Sci. USA 2013;110:E4036-E4044.
5. Burton MJ, Kapetanaki SM, Chernova T, Jamieson AG, Dorlet P, Santolini J, Moody PCE, Mitcheson JS, Davies NW, Schmid R and others. A heme-binding domain controls regulation of ATP-dependent potassium channels. Proc. Natl. Acad. Sci. USA 2016;113:3785-3790.
6. Chiabrando D, Mercurio S, Tolosano E. Heme and erythropoieis: more than a structural role.
Haematologica 2014;99:973-983.
7. Hou SW, Reynolds MF, Horrigan FT, Heinemann SH, Hoshi T. Reversible binding of heme to proteins in cellular signal transduction. Acc. Chem. Res.
2006;39:918-924.
8. Gajski G, Garaj-Vrhovac V. Melittin: A lytic peptide with anticancer properties. Environ. Toxicol. Pharmacol.
2013;36:697-705.
9. Liu CC, Hao DJ, Zhang Q, An J, Zhao JJ, Chen B, Zhang LL, Yang H. Application of bee venom and its main constituent melittin for cancer treatment. Cancer Chemother. Pharmacol. 2016;78:1113-1130.
10. Uddin M, Lee BH, Nikapitiya C, Kim JH, Kim TH, Lee HC, Kim C, Lee JS, Kim CJ. Inhibitory effects of bee venom and its components against viruses in vitro and in vivo. J. Microbiol. 2016;54:853-866.
11. Tőke O. Antimicrobial peptides: New candidates in the fight against bacterial infections. Biopolymers 2005;80:717-735.
12. Dosler S, Karaaslan E, Gerceker AA. Antibacterial and anti-biofilm activities of melittin and colistin, alone and in combination with antibiotics against Gram-negative bacteria. J. Chemotherapy 2016;28:95-103.
13. Wilcox W, Eisenberg D. Thermodynamics of melittin tetramerization determined by circular dichroism and implications for protein folding. Protein Sci. 1992;1:641- 653.
14. Bello J, Bello HR, Granados E. Conformation and aggregation of melittin: dependence on pH and concentration. Biochemistry 1982;21:461-465.
15. Terra RMS, Guimaraes JA, Verli H. Structural and functional behavior of biologically active monomeric melittin. J. Mol. Graph. Model. 2007;25:767-772.
1
2
3
4
5
6
7
8
9
10
11
12
13
14
15
16
17
18
19
20
21
22
23
24
25
26
27
28
29
30
31
32
33
34
35
36
37
38
39
40
41
42
43
44
45
46
47
48
49
50
51
52
53
54
55
56
57
58
59
60
For Peer Review
16. Lauterwein J, Brown LR, Wüthrich K. High-resolution
1H-NMR studies of monomeric melittin in aqueous solution. Biochim. Biophys. Acta 1980;622:219-230.
17. Kuznetsov AS, Dubovskii PV, Vorontsova OV, Feofanov AV, Efremov RG. Interaction of linear cationic peptides with phospholipid membranes and polymers of sialic acid. Biochemistry-Moscow 2014;79:459-468.
18. Sui SF, Wu H, Guo Y, Chen KS. Conformational- changes of melittin upon insertion into phospholipid monolayer and vesicle. J. Biochem. (Tokyo) 1994;116:482-487.
19. Hirota N, Mizuno K, Goto Y. Cooperative α-helix formation of β-lactoglobulin and melittin induced by hexafluoroisopropanol. Protein Sci. 1997;6:416-421.
20. Schlamadinger DE, Wang Y, McCammon JA, Kim JE.
Spectroscopic and computational study of melittin, cecropin A, and the hybrid peptide CM15. J. Phys.
Chem. B 2012;116:10600-10608.
21. Sato H, Felix JB. Peptide-membrane interactions and mechanisms of membrane destruction by amphipathic a-helical antimicrobial peptides. Biochim. Biophys. Acta 2006;1758:1245-1256.
22. Micsonai A, Wien F, Kernya L, Lee YH, Goto Y, Refregiers M, Kardos J. Accurate secondary structure prediction and fold recognition for circular dichroism spectroscopy. Proc. Natl. Acad. Sci. USA 2015;112:E3095-E3103.
23. Sreerama N, Venyaminov SYU, Woody RW.
Estimation of the number of α-helical and β-strand segments in proteins using circular dichroism spectroscopy. Protein Sci. 1999;8:370-380.
24. Sreerama N, Woody RW. Computation and analysis of protein circular dichroism spectra. Methods Enzymol.
2004;383:318-351.
25. Zsila F, Matsunaga H, Bikadi Z, Haginaka J. Multiple ligand-binding properties of the lipocalin member chicken α1-acid glycoprotein studied by circular dichroism and electronic absorption spectroscopy: The essential role of the conserved tryptophan residue.
Biochim. Biophys. Acta 2006;1760:1248-1273.
26. Zsila F. A new ligand for an old lipocalin: induced circular dichroism spectra reveal binding of bilirubin to bovine β-lactoglobulin. FEBS Lett. 2003;539:85-90.
27. Zsila F. Circular dichroism spectroscopy is a sensitive tool for investigation of bilirubin-enzyme interactions.
Biomacromolecules 2011;12:221-227.
28. Goncharova I, Urbanova M. Stereoselective bile pigment binding to polypeptides and albumins: a circular dichroism study. Anal. Bioanal. Chem.
2008;392:1355-1365.
29. Kano K, Imaeda K, Ota K, Doi R. Reexamination of cyclodextrin-induced conformational enantiomerism of bilirubin in aqueous solution. Bull. Chem. Soc. Jpn.
2003;76:1035-1041.
30. Goncharova I, Urbanová M. Bile pigment complexes with cyclodextrins: electronic and vibrational circular
dichroism study. Tetrahedron Asymmetry 2007;18:2061-2068.
31. Pescitelli G, Di Bari L, Berova N. Conformational aspects in the studies of organic compounds by electronic circular dichroism. Chem. Soc. Rev.
2011;40:4603-4625.
32. Boiadjiev SE, Lightner DA. Chirality inversion in the bilirubin molecular exciton. Chirality 2001;13:251-257.
33. Boiadjiev SE, Lightner DA. Exciton chirality. (A) Origins of and (B) applications from strongly fluorescent dipyrrinone chromophores. Monatsh. Chem.
2005;136:489-508.
34. Klocek G, Seelig J. Melittin interaction with sulfated cell surface sugars. Biochemistry 2008;47:2841-2849.
35. Yang J, Tsutsumi H, Furuta T, Sakurai M, Mihara H.
Interaction of amphiphilic α-helical cell-penetrating peptides with heparan sulfate. Org. Biomol. Chem.
2014;12:4673-4681.
36. Tchoumi Neree A, Nguyen PT, Chatenet D, Fournier A, Bourgault S. Secondary conformational conversion is involved in glycosaminoglycans-mediated cellular uptake of the cationic cell-penetrating peptide PACAP.
FEBS Lett. 2014;588:4590-4596.
37. Hayden EY, Kaur P, Williams TL, Matsui H, Yeh SR, Rousseau DL. Heme stabilization of α-synuclein oligomers during amyloid fibril formation. Biochemistry 2015;54:4599-4610.
38. Fonseca-Ornelas L, Eisbach SE, Paulat M, Giller K, Fernandez CO, Outeiro TF, Becker S, Zweckstetter M.
Small molecule-mediated stabilization of vesicle- associated helical α-synuclein inhibits pathogenic misfolding and aggregation. Nat. Commun. 2014;5.
39. Person RV, Peterson BR, Lightner DA. Bilirubin conformational analysis and circular dichroism. J. Am.
Chem. Soc. 1994;116:42-59.
40. Boiadjiev SE, Lightner DA. On the conformation of bilirubin ditaurate. Monatsh. Chem. 2003;134:51-59.
41. Zsila F. Aromatic side-chain cluster of biotin binding site of avidin allows circular dichroism spectroscopic investigation of its ligand binding properties. J. Mol.
Recognit. 2011;24:995-1006.
42. Marrleisy D, Lahiri K, Balaram P. Bilirubin binding to polypeptides and chiral amines - Induced circular dichroism and fluorescence studies. Int. J. Peptide Protein Res. 1985;25:290-296.
43. Bouvier M, Brown GR. The induced circular dichroism of bilirubin complexed with the α-helix form of poly(L- lysine) Biochim. Biophys. Acta 1989;991:303-309.
44. D'Urso A, Fragala ME, Purrello R. From self-assembly to noncovalent synthesis of programmable porphyrins' arrays in aqueous solution. Chem. Commun.
2012;48:8165-8176.
45. Pirota V, Monzani E, Dell'Acqua S, Casella L.
Interactions between heme and tau-derived R1 peptides: binding and oxidative reactivity. Dalton Trans.
2016;45:14343-14351.
1
2
3
4
5
6
7
8
9
10
11
12
13
14
15
16
17
18
19
20
21
22
23
24
25
26
27
28
29
30
31
32
33
34
35
36
37
38
39
40
41
42
43
44
45
46
47
48
49
50
51
52
53
54
55
56
57
58
59
60
For Peer Review
46. Morisue M, Hoshino Y, Shimizu K, Shimizu M, Kuroda Y. Self-complementary double-stranded porphyrin arrays assembled from an alternating pyridyl-porphyrin sequence. Chem. Sci. 2015;6:6199-6206.
47. Boiadjiev SE, Lightner DA. Optical activity and stereochemistry of linear oligopyrroles and bile pigments. Tetrahedron-Asymmetry 1999;10:607-655.
48. Hochstrasser RM, Negus DK. Picosecond fluorescence decay of tryptophans in myoglobin. Proc. Natl. Acad.
Sci. USA 1984;81:4399-4403.
49. Consani C, Aubock G, van Mourik F, Chergui M.
Ultrafast tryptophan-to-heme electron transfer in myoglobins revealed by UV 2D spectroscopy. Science 2013;339:1586-1589.
50. Yuan C, Gao ZH. Aβ interacts with both the iron center and the porphyrin ring of heme: mechanism of heme's
action on Aβ aggregation and disaggregation. Chem.
Res. Toxicol. 2013;26:262-269.
51. Dwarka D, Thaver V, Naidu M, Baijnath H. New insights into the presence of bilirubin in a plant species Strelitzia nicolai (Strelitziaceae). Afr. J. Tradit.
Complement. Altern. Med. 2017;14:253-262.
52. Gazzin S, Vitek L, Watchko J, Shapiro SM, Tiribellil C.
A novel perspective on the biology of bilirubin in health and disease. Trends Mol. Med. 2016;22:758-768.
53. Zhu B, Wu XM, Bi YF, Yang Y. Effect of bilirubin concentration on the risk of diabetic complications: A meta-analysis of epidemiologic studies. Sci. Rep.
2017;7.
54. Ghosh C, Seal M, Mukherjee S, Dey SG. Alzheimer's disease: a heme-Aβ perspective. Acc. Chem. Res.
2015;48:2556-2564.
.