ISSN 2416-2140 European Ecocycles Society
Ecocycles, Vol. 7, No. 1, pp. 38-46 (2021) DOI: 10.19040/ecocycles.v7i1.189
CASE STUDY
Mapping floristic diversity: a case study in Sicily
Giuseppe Bazan
a, Giuseppe Baiamonte
b, Pasquale Marino
cand Rosario Schicchi
daDepartment of Biological, Chemical Pharmaceutical Science and Technology, University of Palermo, Italy.
b Department of Architecture, University of Palermo, Italy.
c Bona Furtuna LLC, Los Gatos, CA 95031, USA.
d Department of Agricultural, Food and Forest Sciences, University of Palermo, Italy.
giuseppe.bazan@unipa.it
Abstract – This paper presents an operational methodology to map and analyze the floristic richness of “target species” in Natura 2000 sites, making use of G.I.S. tools and procedures. A Floristic diversity map (scale 1:50,000), covering an area of 612 km2, was produced by a team of experts as part of the management plans of “Madonie Mountains” Sites of Community Importance (SCIs), located in Sicily (Italy). The primary grid map represents the richness of “target species”, which include species of Community interests, taxa on the National Red List, endemic and threatened, species protected under International Conventions, taxa of phytogeographic importance. Secondary data frames include a three-dimensional map representing the number of species present in each cell, a coarser species richness distribution (scale 1:400,000) and a reference map of endemism rate in the Mediterranean area. Such a cartographic document has proven to be an effective tool in biodiversity conservation planning.
Furthermore, the knowledge of floristic richness and distribution is not only important for the management of protected areas, but it is also important for the sustainable management of cultural landscapes.
Keywords – Biodiversity; Plant species richness; Biological Conservation; Environmental planning; Grid mapping; Geographical Information Systems.
Received: April 24, 2021 Accepted: May 9, 2021
INTRODUCTION
Mapping the geographic distribution of vascular plants has been a subject of interest since the end of the 19th century (Pedrotti, 2012). Methods improved over time, following the evolution of cartographic techniques first and computer science later on.
Mapping species distribution can be accomplished using different approaches. A typical example is the classic chorological cartography that shows the distribution range of taxa using various representation techniques, such as a line indicating the boundary within which the taxon is supposed to be present. However, within this geographic range, the distribution of the species is discontinuous and linked to the presence of its habitat.
One of the most widespread methods used in floristic cartography to map the distribution of single individuals or
populations, in terms of presence/absence, makes use of a reference grid. This technique was developed in Holland around 1930 (Sloff, 1935) and has been used at very different scales. One of the first coarse-scale applications was the Atlas of the British Flora (Perring and Walters, 1962), consisting of some 1.700 maps, one for each taxon, in which the British Isles are divided into the 3.500 10-kilometre squares of the National Grid and the presence of each species within them is recorded. After the Atlas of the British Flora, Ehrendorfer and Hamann (1965) proposed a mapping project of Central European Vascular Plants (Pteridophyta and Spermatophyta) based on grid units of 10’ long. × 6’ lat., covering an area of about 700.000 km2 over Germany, Switzerland, Austria, western Czechoslovakia, northern Yugoslavia and Italy (north of 45° N and west of 19° 10' E); a few years later the mapping effort was extended to standardized data collection and recording, precursor of contemporary G.I.S., that would allow automatic computer processing and map printing (Niklfeld, 1971). Pignatti (1978) applied the same approach
39
to the Italian territory, with a finer grid based on geographical longitudes and latitudes (5' long. × 3' lat.). The method remained in use for decades and found wide application in several Italian regions, such as Friuli-Venezia Giulia (Poldini, 1991, 2002), Lazio (Lucchese and Lattanzi, 2000), Sicily (Raimondo et al., 2000). A similar method was adopted in the Atlas Florae Europaeae (AFE) project (Jalas and Suominen, 1967, 1972-2002], although using an orthogonal Universal Transverse Mercator (UTM) grid of 50 × 50 km.
Literature offers examples of grid-based mapping applications even on smaller areas, such as the floristic map of Zingaro Natural Reserve, which makes use of the second kilometric grid of the Rome 40 - Gauss Boaga (EPSG 3004) coordinate system (Pedrotti, 2012).
The wider availability of computers led to the development of specific software designed to manage and organize floristic data, including cartographic layouts, such as the network of databanks for the Italian flora and vegetation (Nimis et al., 1984; Poldini et al., 1991), the CFT programme (Festi, 2005), BIODAT (Hartl and Radic, 1992). The increase in available processing power and the improvement of commercial and open-source G.I.S. software made ad hoc programs obsolete and allowed, at the same time, the management of larger databases and the production of more refined maps.
FLORKART is the outcome of a wider project which produced a large floristic database from a cumulative mapping effort involving literature reviews and thousands of voluntary surveyors in several organizational subunits (Haeupler and Schönfelder, 1989). FLORKART database covers Germany at a geographical grid resolution of 6×10 and includes presence/absence data for 3917 vascular plant species (Van Der Maaten et al., 2012). A similar project on the wild flora (indigenous species, archeophytes and naturalised aliens) is Florabank1 (Van Landuyt et al., 2011).
It is a database of about 3 million records containing distributional data on Flanders and the Brussels Capital Region (Belgium), also including ecological data on vascular plant species, Red List category information, Ellenberg values, legal status, global distribution, seed bank, etc., dating from 1800 until the present.
A more advanced approach to floristic cartography is based on statistical methods and aimed at the spatial prediction of vascular flora distribution. Predictive habitat distribution modelling in ecology uses a large variety of statistical methods (e.g., Austin, 2006; Franklin, 1995; Guisan and Zimmermann, 2000) and has proven effective in field survey planning and in compiling floristic atlases (Hill, 1991;
Buckland and Elston, 1993; Carpenter et al., 1993; Lenihan, 1993; Huntley et al., 1995; Guisan et al., 2006; Bazan et al., 2010).
These modern geostatistical methods, however, have not made binary (presence/absence) cartographic representation obsolete, since it is still essential in mapping primary data on biodiversity. Grid-based floristic mapping is often used in environmental monitoring and threatened species monitoring,
such as IUCN Red Lists (IUCN, 2019). The most important geographic information to evaluate the conservation status of a taxon is the area of occupancy (AOO), counted in terms of the number of grid cells in which the taxon is present. As an example, see the standard grid (2 × 2 km square, available in digital format) proposed by Gargano (2011), that satisfies IUCN requirements (using Italy as a case study).
At the European scale, the Council Directive 92/43/EEC on the conservation of natural habitats and wild fauna and flora aims to promote the maintenance of biodiversity. Article 17 of the Directive involves the assessment of the conservation status of the habitats and species targeted by means of habitat or species distribution mapping on a 10 × 10 km grid (e.g., Riveccio et al., 2020).
Within Sites of Community Importance (SCIs) of the Natura 2000 ecological network, plant mapping has found application in distribution analysis and management of species of Community interest, threatened species, especially those included in Red Lists, endemic and rare taxa, species of biogeographical interest.
The purpose of this paper is to present an operational methodology to map and analyze the floristic richness of
“target species” in Natura 2000 sites, making use of G.I.S.
tools and procedures. The presented map was produced by a team of experts as part of the management plans of “Madonie Mountains” Sites of Community Importance and it has proved an effective tool in biodiversity conservation planning.
STUDY AREA
Sicily is the largest island of Italy and is a biodiversity hotspot in the Mediterranean area (Médail and Quézel, 1999). The island has an area of about 25500 km2, approximately 1000 km of coastline and an elevation range from sea level to 3340 m (Mount Etna). It has a vascular flora of 3252 species and 321 exclusive endemic taxa (Giardina et al., 2007; Geraci et al., 2017; Troia et al., 2012, 2018). Most of this diversity is concentrated in the major mountainous systems (Madonie Mts and Mt. Etna) (Baiamonte et al., 2015). On the Madonie Mountains, about 1700 taxa occur, with an endemism rate of over 20%, including endemic trees such as Abies nebrodensis (Lojac.) Mattei (Fig. 1) (Schicchi et al., 2017).
As a case study, we consider the “Madonie Mountains”
Natura 2000 sites, an ambit of planning including 9 different Sites of Community Importance (SCIs) and 1 Special Protection Area (SPA).
The Madonie Mountains are the terminal portion of the Italian Apennine mountain range and are mainly made up of sedimentary rocks formed during the Triassic (about 200 million years ago), both carbonate (concentrated in the core area) and siliceous (Numidian Flysch, more common in the northern part, facing the Tyrrhenian Sea, and in the southern part) (Basilone, 2018). They are characterized by a significant morphologic diversity, with uneven and rough terrain where
40
calcareous rocks are more abundant and karst processes frequent, and a gentler morphology in areas with a prevalence of clay.
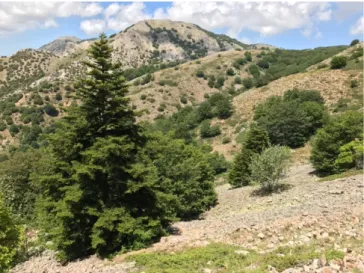
Figure 1. Abies nebrodensis is an endemic species of Sicily. The relict population of this fir consists of only 30 individuals.
The macro climate is Mediterranean, but the local climate is strongly affected by altitude and aspect. The temperature rises from spring to summer, reaching its maximum in August (with a mean daily maximum temperature of 29.8 °C). The temperature gradually declines through fall to reach its minimum in January (with a mean daily minimum temperature of 9.6 °C). Mean annual precipitation ranges from 693.3 mm (at Cefalù meteorological stations, 30 m a.s.l.) to 809.9 mm (at Petralia Sottana, 930 m a.s.l.), with significant peaks during fall and winter, and rain days range from 80 to 100. At higher altitudes, snow is frequent during winter and can persist until late spring. Northern facing slopes are exposed to high atmospheric humidity coming from the Tyrrhenian Sea that condensates into mist, mitigating summer draught. The area is characterized by ten different bioclimatic types (Bazan et al., 2015), ranging from Thermomediterranean dry to Oromediterranean humid, each corresponding to a different natural potential vegetation type.
Lithologic, geomorphologic and climatic diversity are the main causes of the impressive biological diversity of the Madonie area, which is extremely heterogeneous and significantly different from the surrounding geographical context.
Nonetheless, natural history is no sufficient explanation for the biological richness of the area, expressed at all levels (species, community and ecosystem), since human history has given a significant contribution to the diversification and preservation of the land mosaic (Bazan et al., 2020a, 2020b).
The vegetation of the study area, classified according to the CORINE Biotopes legend (Moss and Wyatt, 1997), includes 45 vegetation types (Raimondo et al., 2004; Schicchi, 2008).
Woodlands include acidophilous (Anemone apenninae-
Fagetum) and basiphilous beech formations (Luzulo siculae- Fagetum) (Fig. 2), mixed durmast oak and holly formations (Ilici aquifolii-Quercetum austrotyrrhenicae), deciduous oak formations (Ilici aquifoliae-Quercetum congestae, Oleo sylvestris-Quercetum virgilianae, Quercetum leptobalanae), holm oak dominated communities (Geranio versicoloris- Quercetum ilicis, Teucrio siculi-Quercetum ilicis, Aceri campestris-Quercetum ilicis), cork oak formations (Erico- Quercion ilicis). Scrublands (Rhamno lojaconoi-Lauretum nobilis, Armerion nebrodensis, Berberidion aetnensis, Cerastio-Astragalion nebrodensis, Cisto salvifolii- Genistetum madoniensis) and grasslands (Dactylorhizo- Juncion striati, Mentho-Juncion inflexi, Helianthemion guttati, Trachynion distachyae, Armerion nebrodensis, Plantaginion cupanii) are extremely variegated and often associated with peculiar biologic and biocoenotic expressions (Gianguzzi et al., 2015; Gianguzzi & Bazan 2019, 2020;
Marino et al., 2012a, 2012b, 2013; Schicchi et al., 2013).
METHODS
In the first step of plant biodiversity assessment, we made use of the wide scientific literature available on the area of study.
On this basis, we updated the Natura 2000 data-entry form and database (Baimonte et al., 2015) of the 9 SCIs and 1 SPA denominated “Monti Madonie”.
We focused on plant “target species” as reported in the Natura 2000 Standard Data Form of each SCI. Target species are the taxa for which a particular SCI has been designated and include species of Community interests, as listed in Annex II, Annex IV and Annex V of the Habitat Directive. We also took into account other important species of flora and in particular taxa on the National Red List (Conti et al., 1992), which comprises several endemic and threatened species, taxa with different endemism ranges (local, regional, national, sub- endemic), species protected under International Conventions (such as the Bern Convention, 1979 and Convention on Biological Diversity, 1992), taxa of phytogeographic or naturalistic importance.
The checklist includes vascular plants, bryophytes, lichens and fungi. The list of vascular flora is made up mainly on the basis of the Catalogue of the Vascular plant of Sicily (Giardina et al., 2007). The nomenclature of bryophytes follows Düll (1992), the nomenclature adopted for lichens follows Nimis (1993) and the nomenclature of fungi follows Moser (1980).
Primary data used to define species richness distributions patterns comes from the cross-referencing of specimen collections of the Herbarium Mediterraneum (PAL), literature data from Taxonomic Checklists (Raimondo et al., 2010), field data confirmation and new field data collection.
41
Figure 2. Beech forest of Madonie Mountains. Fagus sylvatica reaches the southernmost extremity of their ranges here, rising to an elevation of 1,960 m a.s.l.
When literature or herbarium specimen labels reported place names instead of coordinates, we performed geocoding using the official toponymical dataset of the Istituto Geografico Militare (Military Geographic Institute) of Italy, available as WMS service (http://map.sitr.regione.sicilia.it/ArcGIS/rest- /services/WGS84_F33/Toponimi_IGM25000_f33/Map- Server), for final confirmation.
We performed extensive and prolonged field surveys to confirm existing information and to acquire new and up to date data on the presence and exact distribution of species of interest. We recorded qualitative and quantitative information for each population, using a GPS device to acquire coordinates.
Data analysis and processing were carried out using ESRI ArcGIS 10.2. We created an ad hoc ESRI Geodatabase (Flora.gbd) including geometry, attributes and a spatial reference system. Geometry is constituted by a vector polygon grid feature class of 612 square cells (1 km × 1 km) corresponding to the UTM grids that intersects the study area.
We used the National Grid of “Monte Mario Italy 2” (EPSG Projection 3004) coordinate system. In this reference grid, each polygonal cell presents as attributes the presence/ab- sence of all species listed in the area. The attribute table is structured so that cells number are the record ID and names of taxa are the field heading. Species richness per cell, classified according to Jenks optimization method (Jenks, 1967), has been represented through a colour ramp in which a darker green indicates a higher number of species. All cartographic work was carried out using ArcGIS.
The Floristic Diversity Map of “Monti Madonie” Natura 2000 Sites includes a principal data frame displaying “Natura 2000 Target Species Richness” in the scale of 1:50,000 and a topographic raster base-map produced by the Military Geographic Institute of Italy at a reference scale of 1:50,000, simplified to increase readability. Secondary data frames show other relevant information on biodiversity. The first one includes a three-dimensional map representing the number of species present in each cell as an extruded parallelepiped and the grid overlaid on the Italian Digital Elevation Model with a 20 meters accuracy (SINAnet, 2021). The second one
depicts a coarser species richness distribution of total flora (scale 1:400,000), using the reference grid defined by Pignatti (1978) and floristic data obtained from Raimondo et al.
(2000). The third one shows the endemism rate in the Mediterranean area, based on Médail and Quézel (1999), with an inset map locating the “Monti Madonie” area within the context of the Mediterranean region.
The primary map, designed according to ISO standards (A0 size), uses the topographic map provided by Istituto Geografico Militare (I.G.M., aut. N.4848, 27/07/1998) as a base (only available in raster format). I.G.M. base-map (scale 1:50,000) is a de facto standard for Italian maps. Data on species richness is represented in the overlaid vector layer, presented as a coloured grid. A lighter green represents a lower number of species within the cell and a darker green indicates a higher number of species. Within each cell, the exact number of species present is also indicated. The left column includes the legend of the primary map, a 3D representation of species richness (depicted as extruded parallelepipeds) associated with a Digital Elevation Model (useful to understand the correlation between species richness and elevation), a broader scale (1:400,000) representation of species richness and a map showing endemism rate in the whole Mediterranean area.
In addition to the map, we make available an ancillary document detailing the distribution of each target species in grid cells. The document has two columns, one for each taxon and another listing every cell in which the species is present (indicated by cell number IDs corresponding to the ones on the map).
RESULTS
Field data collection allowed us to identify 1.700 specific and intra-specific taxa, confirming literature data on the flora of the Madonie Mountains. Among these, we mapped 264 Natura 2000 target species, of which only 7 vascular plants and 2 Bryophyte are included in the Habitat Directive as species of Community interest (5 in Annex II and Annex IV and 4 in Annex V) (Table S1). Regarding the other examined species, 125 are included in the national Red List and 130 are endemic. Within the area of study, the endemism rate is extremely significant: 73% of endemic taxa of the Palermo province and 42% of endemic taxa of Sicily are present in the Madonie Mountains (Fig. 3).
The 612 cells in the reference grid have a number of endemic, rare or threatened taxa that range from a minimum of 15 to a maximum of 86 per cell, with a mean value of 26.88, a median value of 23 and a standard deviation of 11.96.
Quantitative distribution analysis of endemic, rare or threatened taxa species per cell, shows that 398 cells have less than 26 species, 158 cells have 26 to 40 species, 37 cells have 41 to 63 species, 19 cells have more than 63 species.
42
Figure 3. The Floristic Diversity Map of “Monti Madonie” Natura 2000 sites (full resolution image is in supplementary materials).
43
Regarding the pattern of species distribution, 25 taxa are present only in one cell (1 Km2). Among these species, the rare Adenostyles alpina subsp. nebrodensis should be noted, in addition to other 8 threatened species of Sicilian flora, such as Cardamine chelidonia, Carex laevigata, Gagea chrysantha, Hieracium racemosum subsp. pignattianum, Iris pseudacorus, Ranunculus peltatus, Rhamnus lojaconoi and Tripolium sorrentinoi (the last one listed in Annex 2 of Habitat Directive).
Other vascular plants listed in the Habitats Directive are:
Abies nebrodensis located in 3 cells, Ophrys lunulata present in 9 cells, Galanthus nivalis present in 9 cells, Leontodon siculus distributed in 12 cells, Dianthus rupicola distributed in 15 cells and Ruscus aculeatus spread in 212 cells. Half of the species surveyed occupy an area smaller or equal to 13km2 (median). The average area of distribution is 62,3 km2. Some bryophytes (Sphagnum auriculatum, Sphagnum contortum) and the Sicilian endemic plant Carlina sicula are uniformly spread in the study area.
The part of the territory with the highest biodiversity is the area of Monte Mufara (m 1865 a.s.l.) at Serre di Quacella, considered among the most important plant areas of the Mediterranean Region for species richness and endemism rate.
The geostatistical analysis also indicated a significant positive correlation (r=0.618) between species richness and elevation (calculated as mean elevation per cell, using ArcGIS Zonal Statistics tool to obtain the simple average of DTM values within each cell).
DISCUSSION AND CONCLUSIONS
The purpose of the Directive 92/43/EEC is to contribute to
“ensuring bio-diversity through the conservation of natural habitats and of wild fauna and flora”. The Directive provides measures aimed at maintaining or restoring favourable conservation status of natural habitats and species of wild fauna and flora of Community interest. One of these measures, set out in Article 6 of the Directive, is the definition of management plans specifically designed for the sites for SCIs and SPAs.
A proper management plan needs an appropriate cartographic representation of the target species. The European Environment Agency (2017) provides a vector polygon reference grid (available in shapefile format) which is the base system suggested for all spatial analysis and statistic data in Europe. However, in the Monti Madonie SCI’s management plan, a regional grid-based representation (1 × 1 km) was chosen, using the “Monte Mario Italy 2” coordinate system, to be consistent with the Regional Geographic Information System of Sicily (https://www.sitr.regione.- sicilia.it). This way, floristic distribution data can easily be related to other information, such as habitat or land-use type, to evaluate, for example, their floristic value.
The weakness of this method could be the loss of information, which is more significant for species with the smallest distribution range. However, the magnitude of information loss strictly depends on the resolution of the sampling grid (the bigger the grid cells, the higher loss of information). In any case, a grid-based representation is the only viable choice for species with a scattered distribution range.
Furthermore, the use of a grid allows overlaying information on the distribution ranges of different species. The sum of the number of species present in each grid cell is a direct measure of the floristic diversity (alpha-diversity), hence a measure of the biodiversity of the area of study.
Presence/absence data is used to measure species richness, the actual number of species present. This measure is related to species diversity but does not take into account the proportional abundances of individuals (Tuomisto, 2010).
Nevertheless, measuring endemic and rare species richness is an effective assessment of landscape floristic quality.
Floristic richness knowledge, in fact, is not only crucial for the management of protected areas, but also extremely important for the sustainable management of cultural landscapes. The high biodiversity of the Madonie Mountains, which have been exploited by humans since the Neolithic Period, is the result of long-term interactions between human societies and nature, of which endemic and rare species are the witnesses.
ACKNOWLEDGEMENTS
The authors would like to thank the anonymous reviewers for their helpful readings and suggestions that improved the overall quality of the text.
OPEN ACCESS STATEMENT
This article has been published under a Creative Commons Attribution 4.0 international license that provides immediate open access to its content on the principle that making research freely available to the public supports a greater global exchange of knowledge.
REFERENCES
Austin, M. (2006): Species distribution models and ecological theory: A critical assessment and some possible new approaches. Ecological Modelling, 200, pp.1-19.
DOI: 10.1016/j.ecolmodel.2006.07.005
Baiamonte, G., Domina, G., Raimondo, F.M., Bazan, G.
(2015): Agricultural landscapes and biodiversity conservation: a case study in Sicily (Italy). Biodiversity and Conservation, 24, pp.3201-3216.
DOI: 10.1007/s10531-015-0950-4
Basilone, L. (2018): Lithostratigraphy of Sicily (pp.1-349).
Heidelberg: Springer.
DOI: 10.1007/978-3-319-73942-7
44
Bazan, G., Domina, G., Schicchi, R. (2010): Land Unit definition for potential distribution of endangered species.
Bocconea, 24, pp.213-219.
Bazan, G., Marino, P., Guarino, R., Domina, G., Schicchi, R.
(2015): Bioclimatology and vegetation series in Sicily: a geostatistical approach. Annales Botanici Fennici, 52(6), pp.1-18.
DOI: 10.5735/085.052.0202
Bazan, G., Speciale, C., Castrorao Barba, A., Cambria, S., Miccichè, R., Marino, P. (2020a): Historical Suitability and Sustainability of Sicani Mountains Landscape (Western Sicily): An Integrated Approach of Phytosociology and Archaeobotany. Sustainability, 12, p.3201.
DOI: 10.3390/su12083201
Bazan, G., Castrorao Barba, A., Rotolo, A., Marino, P.
(2020b): Vegetation series as a marker of interactions between rural settlements and landscape: New insights from the archaeological record in Western Sicily. Landscape Research, 45, pp.484-502.
DOI: 10.1080/01426397.2020.1730774
Buckland, S.T., Elston, A. (1993): Empirical models for the spatial distribution of wildlife. Journal of Applied Ecology, 30, pp.478-495.
DOI: 10.2307/2404188
Carpenter, G., Gillison, A.N., Winter, J. (1993): DOMAIN: a flexible modeling procedure for mapping potential distributions of plants, animals. Biodiversity & Conservation, 2, pp.667-680.
DOI: 0.1007/BF00051966.
Conti, F., Manzi, A., Pedrotti F. (eds) (1992): Libro Rosso delle Piante d’Italia (637 pp.). Roma: Ministero dell’Ambiente, Associazione Italiana per il WWF, Società Botanica Italiana.
Düll, R. (1992): Distribution of European and Macaronesian mosses (Bryophytina). Biologische Beitraege, 4, pp.1-109.
Ehrendorfer, F., Hamann, U. (1965): Vorschlige zu einer floristischen Kartierung von Mitteleuropa. Ber. Deutschen Botanischen Gesellschaft, 78, pp.35-50.
European Environment Agency (2017): EEA reference grids:
EEA reference grid samples for projection ETRS89- LAEA 52N 10E. Available at:
https://www.eea.europa.eu/data-and-maps/data/eea- reference-grids-2 (Accessed: 10 april 2021).
Festi, F. (2005): CFT: un programma di gestione per i dati della cartografia floristica Tridentina. Annali Museo civico di Rovereto, 20 (2004), pp.107-126.
Franklin, J. (1995): Predictive vegetation mapping:
geographic modelling of biospatial patterns in relation to
environmental gradients. Progress in Physical Geography:
Earth and Environment, 1, pp.474-499.
DOI: 10.1177/030913339501900403
Gargano, G. (2011): Verso la redazione di nuove Liste Rosse della flora d’Italia: una griglia standard per la misura dell’Area of Occupancy (AOO). Informatore Botanico Italiano, 43, pp.455-458.
Geraci, A., Cortis P.L, Schicchi, R. Troia, A. (2017):
Morphological observations on the reproductive structures of Ambrosina (Araceae), a Mediterranean endemic monotypic genus. Phytotaxa, 328(5), pp.3-66.
DOI: 10.11646/phytotaxa.328.1.2
Gianguzzi, L., Bazan, G. (2020): A phytosociological analysis of the Olea europaea L. var. sylvestris (Mill.) Lehr.
forests in Sicily. Plant Biosystems, 154(5), pp.705-725.
DOI: 10.1080/11263504.2019.1681532
Gianguzzi, L., Bazan, G. (2019): The Olea europaea L. var.
sylvestris (Mill.) Lehr. forests in the Mediterranean area.
Plant Sociology, 56, pp.3-34.
DOI: 7338/pls2016531/02
Gianguzzi, L., Papini, F., Cusimano, D. (2015):
Phytosociological survey vegetation map of Sicily (Mediterranean region). Journal of Maps, 12(5), pp.845-851.
DOI: 10.1080/17445647.2015.1094969
Giardina, G., Raimondo, F.M., Spadaro, V. (2007): A catalogue of the plants growing in Sicily. Bocconea, 20, pp.5- 582.
Guisan, A., Broennimann, O., Engler, R., Vust, M., Yoccoz, N.G., Lehmann, A., Zimmermann, N.E. (2006): Using Niche- Based Models to Improve the Sampling of Rare Species.
Conservation Biology, 20(2), pp.501-511.
DOI: 10.1111/j.1523-1739.2006.00354.x
Guisan, A., Zimmermann, N.E. (2000): Predictive habitat distribution models in ecology. Ecological Modelling, 135(2), pp.147-186.
DOI: 10.1016/S0304-3800(00)00354-9
Haeupler, H., Schönfelder, P., (1989): Atlas der Farn und Blütenpflanzen der Bundesrepublik Deutschland. Stuttgart:
Ulmer.
Hartl, H., Radic, J. (1992): Neuigkeiten über das Kartierungsprogramm “BIODAT". Carinthia II, 181/101, pp.191-194.
Hill, M.O. (1991): Patterns of species distribution in Britain elucidated by canonical correspondence analysis. Journal of Biogeography, 18(3), pp.247-255.
DOI: 10.2307/2845395
Huntley, B., Berry, P.M., Cramer, W., McDonald, A.P.
(1995): Modelling present and potential future ranges of
45
some European higher plants using climate response surfaces.
Journal of Biogeography, 22(6), pp.967-1001.
DOI: 10.2307/2845830
IUCN Standards and Petitions Committee (2019): Guidelines for Using the IUCN Red List Categories and Criteria.
Version 14. Prepared by the Standards and Petitions Committee. [online]. Available at:
http://www.iucnredlist.org/documents/RedListGuidelines.pd f (Accessed: 10 April 2021).
Jalas, J., Suominen, J. (eds) (1972-1994): Atlas Florae Europaeae. Distribution of Vascular Plants in Europe. (Vols.
1-1). The Committee for Mapping the Flora of Europe &
Societas Biologica Fennica Vanamo, Helsinki.
Jalas, J., Suominen, J. (1967): Mapping the distribution of vascular plants. Memoranda Societatis pro Fauna et Flora Fennica, 43, pp.60-72.
Jenks, G.F. (1967): The data model concept in statistical mapping. International yearbook cartography, 7(1), pp.186- 190.
Lucchese, F., Lattanzi, E. (2000): Atlante della flora dei Monti Ausoni. New pubblihouse, Roma.
Marino P., Geraci A., Schicchi R. (2012a): Notes on the karyology, genetics and ecology of Genista sect. Voglera in Sicily. Plant Biosystems, 146(sup. 1), pp.324-329.
DOI: 10.1080/11263504.2012.707154
Marino, P., Guarino, R., Bazan, G. (2012b): The Sicilian taxa of Genista sect. Voglera and their phytosociological framework. Flora Mediterranea 22, pp.169-190.
DOI: 10.7320/FlMedit22.169
Marino, P., Schicchi, R., Barone, E., Raimondo, F.M., &
Domina, G. (2013): First results on the phenotypic analysis of wild and cultivated species of Pyrus in Sicily. Flora Mediterranea, 23, pp.237-243.
DOI: 0.7320/FlMedit23.237
Médail, F., Quézel, P. (1999): Biodiversity hotspots in the Mediterranean Basin: setting global conservation priorities.
Conservation Biology, 13(6), pp.1510-1513.
DOI: 10.1046/j.1523-1739.1999.98467.x
Moser, M. (1980): Guida alla determinazione dei funghi.
Vol. 1-3. Saturnia. Trento. ISBN: 9788885013483
Moss, D., Wyatt, B.K. (1997): The CORINE biotopes project: a database for conservation of nature and wildlife in the European community. Applied Geography, 14(4), pp.327- 349.
DOI:10.1016/0143-6228(94)90026-4
Niklfeld, H. (1971): Bericht uiberdie Kartierung der Flora Mitteleuropas. Taxon, 20(4), pp.545-57.
DOI: 10.2307/1218258
Nimis, P.L., Feoli, E, Pignatti, S. (1984): The network of databanks for the Italian flora and vegetation. In: Allkin, R, Bisby, F.A. (eds.), editors. Databases in systematics. London and Orlando: Academic Press. ISBN: 978-012053040.
Nimis, P.L. (1984): The Lichens of Italy. Torino: Museo Regionale di Scienze Naturali; 1993.
Pedrotti, F. (2012): Plant and vegetation mapping. Springer Science & Business Media
DOI: 10.1007/978-3-642-30235-0
Perring, F.H., Walters S.M. (1962): Atlas of the British Flora.
London: Thomas Nelson & Sons.ISBN: 0-901158-19-4.
Pignatti, S. (1978): Dieci anni di cartografia floristica nell’Italia di Nord-Est. Informatore Botanico Italiano, 10, pp.212-219.
Pignatti, S. (1975): Zum Stande der floristichen Kartierung in Bayern: Gesamtubersicht und allgemeiner Bericht. Mitt.
Arbeitsgem. Flora Kartierung Bayerns., 7, pp.14-19.
Poldini, E. (1991): Atlante corologico delle Piante vascolari del Friuli-Venezia Giulia. Udine: Arti Grafiche Friulane.
Poldini, E. (2002): Nuovo atlante corologico delle Piante vascolari del Friuli-Venezia Giulia. Udine: Regione Auto- noma Friuli-Venezia Giulia, Azienda Parchi e Foreste Regionali, Università degli Studi di Trieste.
Raimondo, F.M., Bazan G., Gianguzzi, L., Ilardi, V., Schicchi, R., Surano, N. (2000): Carta del paesaggio e della biodiversità vegetale della Provincia di Palermo. Quaderni di Botanica ambientale e applicata, 9(2001), pp.3-160.
Raimondo, F.M., Domina, G., Spadaro, V. (2010): Checklist of the vascular flora in Sicily. Quaderni di Botanica Ambien- tale e Applicata, 21(2010), pp.189-252.
Raimondo, F.M, Surano, N., Schicchi, R. (2004): Carta del paesaggio e della biodiversità vegetale del Parco delle Madonie (Sicilia): Naturalista Siciliano, 28(1), pp.71-137.
Schicchi, R. (2008): editor. Piano di gestione "Monti Madonie. C.I.R.I.T.A., Università degli Studi di Palermo.
[online]. Available at:
http://www.artasicilia.eu/old_site/web/natura2000/
(Accessed: 10 April 2021).
Rivieccio, G., Bagella, S., Bazan, G., Bonini, F., Caria, M.C., Dagnino, D., Mariotti, M., Turcato, C., Gianguzzi, L. (2020):
New national and regional Annex I Habitat records: from# 16 to# 20. Plant Sociology, 57, pp.133-144.
DOI: 10.3897/pls2020572/05
Schicchi, R., Geraci, A., Rosselli, S., Maggio, A., & Bruno, M. (2017): Chemodiversity of the essential oil from leaves of
46
Abies nebrodensis (Lojac.) Mattei. Chemistry & biodiversity, 14(2), e1600254.
DOI: 10.1002/cbdv.201600254
Schicchi, R., Marino, P., Raimondo, F. M. (2013): Il dina- mismo della vegetazione in un massiccio montuoso rappre- sentativo della Sicilia: le Madonie. Colloques Phytosocio- logiques, 24: pp. 627-646.
SINAnet (2021): Sistemi informativi ambientali ISPRA – DEM 20. [online]. Available at:
http://www.sinanet.isprambiente.it/it/sia-ispra/download- mais/dem20/view (Accessed: 10 April 2021).
Sloff, J. G. (1935): Plant-maps for the Netherlands 1:3.000.000. Blumea, 2, pp.1-23.
Troia, A., Bazan, G., & Schicchi, R. (2012):
Micromorphological approach to the systematics of Medi- terranean Isoëtes species (Isoëtaceae, Lycopodiophyta):
analysis of the megaspore surface. Grana, 51(1), pp.35-43.
DOI: 10.1080/00173134.2011.637131
Troia, A., Schicchi, R., Geraci, A. (2018): Typification of the Linnaean name Ambrosinia bassii and other nomenclatural remarks in the genus Ambrosinia (Araceae). Taxon, 67(6):
1183-1186
DOI: 10.12705/676.15
Tuomisto, H. (2010): A consistent terminology for quantifying species diversity? Yes, it does exist. Oecologia, 164(4), pp.853-860.
DOI: 10.1007/s00442-010-1812-0.
Van Der Maaten, L., Schmidtlein, S., Mahecha, M.D. (2012):
Analyzing floristic inventories with multiple maps.
Ecological Informatics 9: pp.1-10.
DOI: 10.1016/j.ecoinf.2012.01.005
Van Landuyt, W., Vanhecke, L., Brosens, D. (2011):
Florabank 1: a grid-based database on vascular plant distri- bution in the northern part of Belgium (Flanders and the Brussels Capital region). PhytoKeys, 12, pp.59-67.
DOI: 10.3897/phytokeys.12.2849
© 2021 by the author(s). This article is an open-access article distributed under the terms and conditions of the Creative Commons Attribution (CC BY) license (http://creativecommons.org/licenses/by/4.0/).