1 The vulnerability of plant-pollinator communities to honeybee decline: a comparative 1
network analysis in different habitat types 2
3
Anikó Kovács-Hostyánszki1,2, Rita Földesi1,3, András Báldi1, Ferenc Jordán2,4,#
4 5
1: Lendület Ecosystem Services Research Group, Institute of Ecology and Botany, MTA 6
Centre for Ecological Research, Vácrátót, Hungary 7
2: GINOP Evolutionary Systems Research Group, MTA Centre for Ecological Research, 8
Tihany, Hungary 9
3: University of Bonn, Institute of Crop Science and Resource Conservation, 10
Agroecology/Organic Farming, Bonn, Germany 11
4: Danube Research Institute, MTA Centre for Ecological Research, Budapest, Hungary 12
13 14
#corresponding author: Danube Research Institute, MTA Centre for Ecological Research, 15
Karolina 29, 1113, Budapest, Hungary; jordan.ferenc@gmail.com 16
17
keywords: ecological interactions, distance-based fragmentation, plant-pollinator network, 18
macroscopic indicators 19
20
Abstract 21
The populations of most pollinators, including honeybees, are declining that heavily affects 22
both crop and wild plant pollination. Wild bee diversity and habitat type may modulate these 23
effects. We addressed the question how the structure of plant-pollinator networks in different 24
habitat types may influence the vulnerability of pollinator communities to the hypothetical 25
loss of honeybees. We performed network analysis based on plant-visitation data in a 26
traditional agricultural landscape and quantified the structural vulnerability (i.e. the effect of 27
the loss of honeybee) of the plant-pollinator networks by a topological index (distance-based 28
fragmentation). We found that very different plant-pollinator communities inhabited the 29
studied different agricultural habitat types. The early summer arable fields had the most, 30
pastures in mid-summer had the less vulnerable structure and, in general, an intermediate 31
plant/pollinator ratio is was associated with high vulnerability in the absence of honeybees.
32
We suggest that increased plant species richness can ensure higher wild bee diversity and 33
more stable plant-pollinator networks without honeybee, where flower-visitation can rely 34
2 more on wild bees. Decreased management intensity in agricultural landscapes can therefore 35
contribute to the maintenance of diverse plant-pollinator communities in agricultural 36
landscapes and to sustainable farming.
37 38
1. Introduction 39
40
Ecosystem services like pollination (Daily, 1997; Ollerton, 2017) may be better managed if 41
the evolutionary ecology of the underlying processes is better understood (Bronstein, 2001).
42
In the age of the pollination crisis (Ghazoul, 2005; Potts et al., 2016; IPBES, 2016), it is a 43
major challenge to better understand the ecological and economical aspects of pollination as 44
an ecosystem service. The decline of pollinators seems to be strongly related to agricultural 45
activities at both local and landscape scales (Carvell et al., 2017; Kovács-Hostyánszki et al., 46
2017). Such disturbance, however, might have no visible effect on the number of foraging bee 47
species, while disturbance can reduce the number or frequency of bee and flower interactions, 48
and consequently foraging and pollination success (Carman and Jenkins, 2016). This calls for 49
an explicit analysis of plant-pollinator communities along a gradient of human influence.
50
Western honeybee (Apis mellifera) is widely used, managed pollinator, responsible for 51
pollination of highly commercial crops (e.g. almond, cherry, apple, etc.; Abrol et al., 2012), 52
but it is also important supergeneralist pollinator in wild plant communities (Giannini et al., 53
2015; Hung et al., 2018; Kovács-Hostyánszki et al., in prep). The exclusive dependence on 54
honeybees, however, has several risks. On the one hand honeybees show massive decline in 55
several parts of the world (Goulson et al., 2015; IPBES 2016) that can be balanced by 56
beekeepers in a certain extent dividing existing colonies, but still the number of honeybee 57
colonies cannot keep up with the even faster growing of insect-pollination demand of 58
agricultural crops (Aizen et al., 2009). On the other hand, honeybees are capable for effective 59
pollination only among favourable weather conditions (Brittain et al., 2013), and only for 60
certain plant species at limited extent (Garibaldi et al., 2013), while their pollination service is 61
often well supplemented, substituted by wild pollinators or even exclusively provided by them 62
(Aslan et al., 2016). Furthermore, the presence of honeybees within agricultural and (semi-) 63
natural habitats is strongly influenced by beekeeper activities (e.g. location and number of 64
colonies), and in natural habitats in 33% of plant-pollinator networks honeybee visit was not 65
even observed (Hung et al. 2018), which consequently rely on only wild pollinator species. To 66
conclude, the decline or lack of honeybees in agricultural and (semi-) natural habitats can be a 67
realistic scenario among different circumstances that can have a considerable but still partly 68
3 unknown effect on plant-pollinator communities. Looking at from the wild pollinators point 69
of view, wild bees and others face also the detrimental effects of land-use change, land 70
management and other effects such as pathogens, climate change, invasion (Goulson et al.
71
2015; IPBES 2016), therefore the stability of managed and semi-natural ecosystems against 72
wild bee decline is also questionable.
73
A systems approach to understand land use and land management effects and the 74
reliance of plant-pollinator communities on honeybee and wild bees is the analysis of plant- 75
pollinator networks that have been extensively studied in the last decades (Jordano, 1987;
76
Memmott, 1999; Olesen et al., 2002; Bascompte et al., 2003; Vamosi et al., 2006; Waser and 77
Ollerton, 2006; Bascompte, 2009; Kaiser-Bunbury et al., 2017; Guimarães et al., 2017; Soares 78
et al., 2017). The analysis of these mutualistic bipartite networks may help in quantifying 79
either their local (e.g. hubs, Biella et al., 2017) or global (e.g. nestedness, Podani et al., 2014) 80
properties, characterizing particular species or the whole community, respectively. Since 81
plant-pollinator interaction networks encompass the characteristics of species, their 82
interactions, and the evolutionary processes (Bascompte, 2007), they may be better indicators 83
of environmental change effects than species diversity (Tylianakis et al. 2010; Carman and 84
Jenkins, 2016; Soares et al., 2017).
85
In this paper, (1) we describe a large-scale, total plant-pollinator network for a 86
traditional agricultural landscape in Transylvania, Romania, (2) we analyse and compare its 87
16 subnetworks representing different habitat types (according to land use and land 88
management) and (3) we study the vulnerability of these networks to honeybee loss, using a 89
network measure imported from social sciences to ecology. We hypothesised that the 90
structure of plant-pollinator networks is different in different habitat types based on their land- 91
use, sown crop type or management in the case of grasslands, which may also influence the 92
vulnerability of their flower-visitation networks to the hypothetical loss of honeybees. We 93
expected higher vulnerability of those networks that are comprised buy fewer plant and/or 94
pollinator species, whereas flower-visitation networks of floristically diverse habitats were 95
hypothesised to be more stable and based more on wild bees as flower visitors. Such 96
differences can be also expected within land-use or crop types depending on the season and 97
the availability of flowering plant species between months.
98 99
2. Data: network construction 100
We collected flower-visitation data in Southern Transylvania, Romania in 2012 (see map in 101
Kovács-Hostyánszki et al. 2016, S1. Fig), in 19 village catchments characterised by a 102
4 traditionally managed agricultural landscape of small parcels of low-intensity arable fields 103
(15%), pastures (40%) and deciduous forests (33%). In each catchment typically two arable 104
fields and two grasslands (land-use types) were chosen, which varied along different crop 105
and/or management types, including alfalfa (N=15), cereal (winter wheat and barley; N=8), 106
corn (N=8), fallow (N=4), grassland with shrubs (N=7), pasture (grazed by cattle or sheep;
107
N=24), hay meadow (N=10) and mowed grasslands or harvested arable fields (hereafter 108
stubbles; N=14). (for further details see Kovács-Hostyánszki et al., 2016). Landscape 109
composition around the study sites was considered by the calculation of percentage area of 110
semi-natural habitats (vineyards; fruit trees and berry plantations; pastures; complex 111
cultivation patterns; land principally occupied by agriculture, with significant areas of natural 112
vegetation; natural grasslands; transitional woodland-shrub) and Shannon index of land cover 113
diversity (land cover categories: urban, arable, semi-natural, forest, water) within 1000 m 114
radius circle using CORINE land cover data (European Environment Agency 2013) and 115
ARCGIS software (ESRI 2008). We compared the two land-use types (arable vs. grassland) 116
and the eight crop and/or management types in the function of semi-natural area ratio and 117
Shannon habitat diversity in the 1000 m radius circle around the focal fields. We found that 118
arable fields and grasslands (t-test; t = 0.37, df = 146.901, p-value = 0.711) and the seven crop 119
and /or habitat types (Anova; df = 6, F = 1.99, p = 0.070) did not differ in the sense of habitat 120
diversity. The percentage of semi-natural habitats was higher around grasslands (that is a 121
semi-natural habitat itself; t = -5.79, df = 147.252, p < 0.001). Here especially pastures were 122
surrounded by higher percentage of semi-natural habitats compared to the arable fields 123
(Anova; df = 6, F = 4.24, p < 0.001; Tukey-test: pasture – cereal: 0.007; Appendix A).
124
We sampled flower-visiting bees by transect walk method along two parallel 100 m 125
long transects (1.5 m width either side) per field, at least 30 m from the edge and 50 m from 126
each other, over 20 min per transect once per month in May, June, July in 10-12 days periods 127
on dry and warm days with minimal wind, and 20ºC minimum temperature, between 9 AM 128
and 6 PM. All bee specimens and plant species that were visited by the bees were identified at 129
species level.
130
Based on plant-visitation field data from 38 arable field and 38 grassland 131
communities, we created a „total” interaction network of 256 species: 123 plant (Appendix 132
AB) and 133 wild bee species (Appendix BC). For clarity, we omitted samples that were 133
impossible to taxonomically specify (e.g. individuals identified only at genus level) – these 134
represented only 3.65 % of individuals in the samples. The interaction network is a weighted 135
5 (by frequency of visits), undirected (effects spreading in both bottom-up and top-down
136
direction) and unsigned (all interactions are mutually positive) graph.
137
We note here that this pooled „total” network represents the plant-pollinator 138
community at a larger-scale, with lower spatial resolution (at the landscape level). We have 139
also studied 16 subnetworks of this „total” network, describing particular locations (habitat 140
types). We note that these communities (and the networks) are not perfectly independent of 141
each other (e.g. pastures are subsets of grasslands), they must be considered as various 142
appropriately defined subsets. Based on land use, we constructed separate networks for 143
grasslands (G) and arable fields (A). According to habitat type and land management, we 144
constructed separate networks such as shrubby grassland (SHG), cereal field (CEF), hay 145
meadow (HAM), cornfield (COF), pasture (PAS), stubble (STU), alfalfa (ALF) and fallow 146
(FAL). Moreover, based on existing temporal data series, for the grassland (G) and the arable 147
field (A) networks, we could construct interaction networks for May (G5 and A5), June (G6 148
and A6) and July (G7 and A7), where numbers refer to months. The details of these 149
communities and land use effects are studied and discussed in Kovács-Hostyánszki et al.
150
(2016).
151
Most of the networks contained either isolated species or smaller (dwarf) components 152
including only a few species. We focused on the giant component of the networks, presenting 153
also the pollinator species composition in the dwarf components (Appendix CD). We note 154
that the identity of components is perfectly consistent (a component with only species i and j 155
and another component with only species j and k imply the existence of a third component 156
with only species i and k). In the case of the total network, there was only a single dwarf 157
component (of two species), and this component was deleted together with all the isolated 158
nodes (species sampled in the field with no detected interaction partner).
159
For the total network, we have also calculated the relative abundance values (RAi) of 160
pollinators: this equals the number of individuals of species i per all identified individuals.
161
The sum of RAi values equals one. We plotted the RAi values with and without the honeybee 162
(APIMEL) in Appendix DE: almost 35% of the pollinator individuals belonged to honeybee 163
(a), so the plot without honeybee (b) could show the abundance rank of further, wild bee 164
species.
165 166 167 168
6 169 170
171
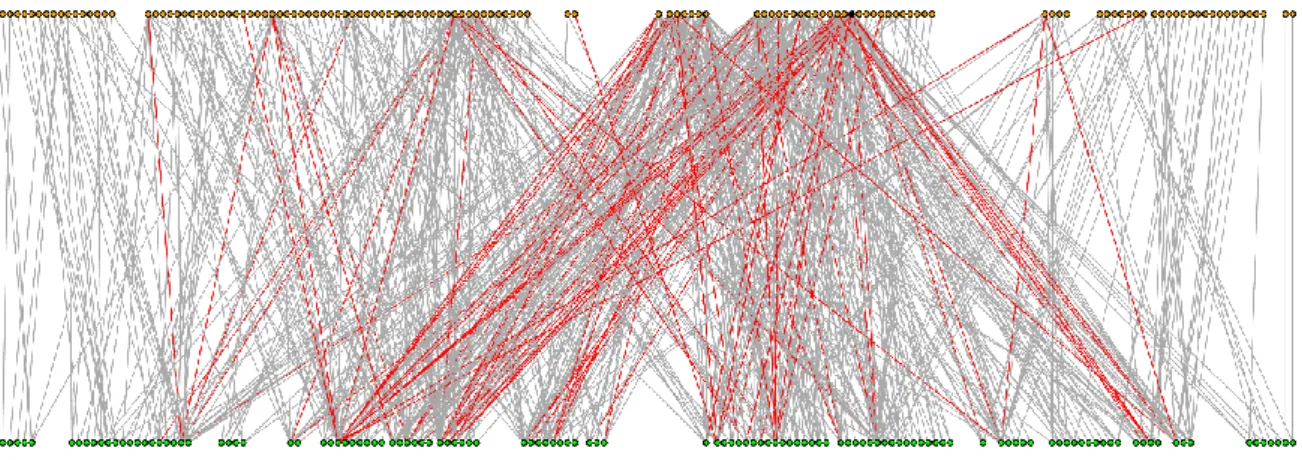
Figure 1. Topology of the aggregated total network. Orange and green nodes correspond to 172
wild bee pollinators and plants, respectively. Honeybee is marked by black and indicated by 173
an arrow. Interactions with a frequency value greater than 4 are red. We show only the giant 174
component of the network (by removing isolated nodes and dwarf components). Drawn by 175
igraph (Csardi and Nepusz 2006).
176 177
3. Methods: network analysis 178
179
Several methods have been used for studying mutualistic, bipartite networks in ecology 180
(Benedek et al., 2007; Blüthgen et al., 2006; Podani et al., 2014). In this paper, we studied 181
some global properties of the plant-pollinator networks, quantifying them by simple 182
topological measures. These network-level (macroscopic) indicators may quantify system- 183
level changes and ecosystem health, similarly to other types of ecological interaction 184
networks (Ulanowicz, 1996). Network-level topological metrics are increasingly used as 185
system-level indicators in different areas of ecology (Baranyi et al., 2011; Ortiz et al., 2017;
186
Pereira and Jordán, 2017).
187
In the case of each network, we were interested in the total number of nodes (N), as the 188
sum of the number of plant species (NP) and the number of pollinator species (NA):
189 190
𝑁 = 𝑁𝑃 + 𝑁𝐴 191
192
These provide information about species diversity in the particular communities.
193
In several networks, there are isolated nodes (pollinators and plants where the species 194
are detected but no pollination interaction was detected for them), isolated pairs of nodes (a 195
plant and a pollinator in a mutually exclusive interaction) and also smaller sets of species (a 196
7 dwarf component) isolated from the majority of species in the community (giant component).
197
Since the spread of direct and indirect effects needs connectedness in the network, we were 198
interested in network components and quantified the number of nodes in the giant component 199
(NG), the number of dwarf components (d), the number of species in dwarf component(s) (Nd) 200
and the percentage of nodes in the giant component (G%).
201
In order to better understand interaction diversity, we calculated the ratio of plant and 202
animal species (NP/NA), the number of plant-pollinator interactions (L) and the connectivity of 203
the bipartite network (C):
204 205
𝐶 = 𝐿 𝑁𝑃∗ 𝑁𝐴 206
207
following the previous abbreviations. The distance between two nodes i and j in a network 208
(dij) is the minimal number of links connecting them (i.e. the length of the shortest path 209
between i and j). From this, their reciprocal distance is 210
211
𝑑𝑖𝑗𝑟 = 1 𝑑𝑖𝑗 212
213
and this measure can be used when a network consists of more than one components (i.e.
214
disconnected). Since the distance between nodes i and j equals infinity if they belong to 215
different components, dij is not easy to use for disconnected networks. In this case, drij helps, 216
since the reciprocal of infinity equal, by definition, zero. The distance-weighted fragmentation 217
(Fd) of the network can be calculated as 218
219
1 − 𝐶𝑂𝑀 220
221
where COM (compactness) is 222
223
𝐶𝑂𝑀 = ∑2 ∗ 𝑑𝑖𝑗𝑟 𝑖 ∗ 𝑗
𝑁
𝑖,𝑗
224
225
which is the average reciprocal distance for each pair of nodes in the network. The distance- 226
weighted fragmentation of a particular node k is the difference of Fd between the networks 227
8 with and without node k. We studied here only the distance-weighted fragmentation for the 228
honeybee (FdAPIMEL). Several other, frequently studied topological metrics could have also 229
been calculated but, for example, nestedness and modularity did not show major differences 230
between vegetation types (Kishi et al. 2017) and different landscapes (Nielsen and Totland 231
2013).
232 233
4. Results 234
235
The topology of the total network is shown in Figure 1. In this total network, honeybee 236
(APIMEL) dominated the network also by abundance, its RA was almost 0.35 (i.e. each third 237
individual was honeybee, Appendix DE). After the removal of the honeybee, RA values were 238
more evenly distributed but still showed a quite skewed rank with 4-6 numerically dominant 239
wild bee species (e.g. Bombus terrestris, Halictus gavarnicus, Lasioglossum malachurum, L.
240
pauxillum, Andrena flavipes). However, the in silico removal of honeybee is an easy way to 241
simulate extinctions (see Memmott et al. 2004), switching mechanisms can certainly re-wire 242
the network (but switching parameters are not really available). This network described the 243
plant-pollinator community of the studied landscape in general, but our main question was 244
how diverse was this network for different habitat types representing various land use 245
scenarios.
246 247
248 249
Table 1. Network properties (N: number of nodes, NG: number of nodes in the giant 250
component, d: number of dwarf components, Nd: number of nodes in the dwarf component(s), 251
G%: percentage of nodes in the giant component, Fd: distance-based fragmentation for the 252
network, FdAPIMEL: distance-based fragmentation for honeybee, NP: number of plant species, 253
NA: number of pollinator species, NP/NA: the ratio of plants and pollinators, L: number of 254
web SHG CEF HAM COF PAS STU ALF FAL G G5 G6 G7 A A5 A6 A7
N 98 52 71 26 159 8 83 72 198 63 108 122 159 47 91 95
NG 78 46 65 24 152 4 79 69 198 55 105 122 153 25 81 91
d 8 3 3 1 3 2 1 1 0 3 1 0 2 4 4 2
Nd 20 6 6 2 7 4 4 3 0 8 3 0 6 22 10 4
G% 79,59 88,46 91,55 92,31 95,60 50,00 95,18 95,83 100,00 87,30 97,22 100,00 96,23 53,19 89,01 95,79
Fd 0,78 0,70 0,72 0,64 0,70 0,77 0,68 0,69 0,68 0,74 0,66 0,69 0,69 0,86 0,74 0,67
FdAPIMEL 0,83 0,77 0,78 0,70 0,74 - 0,72 0,71 0,71 0,78 0,68 0,74 0,71 0,92 0,75 0,69
NP 50 22 31 9 71 4 26 33 93 26 56 51 69 21 37 41
NA 48 30 40 17 88 4 57 39 105 37 52 71 90 26 54 54
NP/NA 1,04 0,73 0,78 0,53 0,81 1,00 0,46 0,85 0,89 0,70 1,08 0,72 0,77 0,81 0,69 0,76
L 133 70 95 30 294 5 117 108 428 82 217 181 324 44 135 181
C 0,06 0,11 0,08 0,20 0,05 0,31 0,08 0,08 0,04 0,09 0,07 0,05 0,05 0,08 0,07 0,08
9 plant-pollination interactions, C: connectivity of the bipartite network) of the 16 particular 255
networks (SHG: shrubby grassland; CEF: cereal field; HAM: hay meadow; COF: cornfield;
256
PAS: pasture; STU: stubble; ALF: alfalfa; FAL: fallow; G: aggregated grassland; G5:
257
grassland in May; G6: grassland in June; G7: grassland in July; A: aggregated arable field;
258
A5: arable field in May; A6: arable field in June; A7: arable field in July). For the 259
abbreviation of network properties, see the text. We provide the size distribution of dwarf 260
components, however, it is not considered in the network analysis of the giant component.
261 262
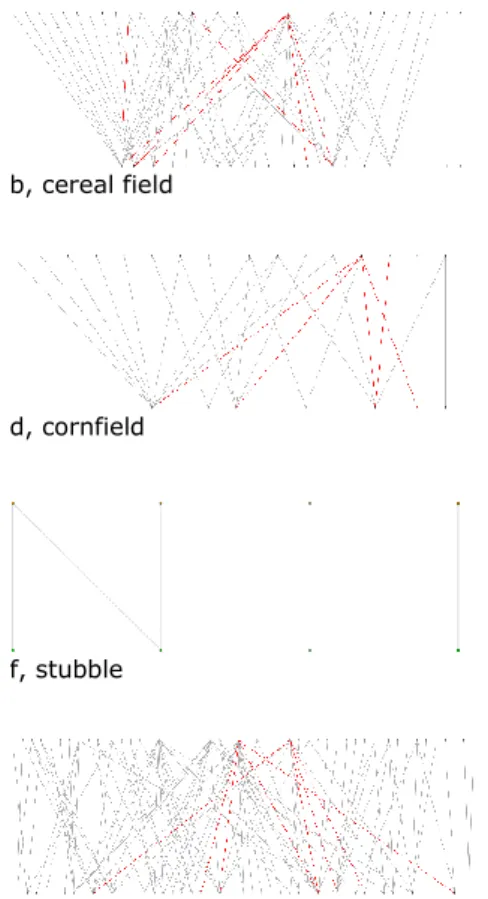
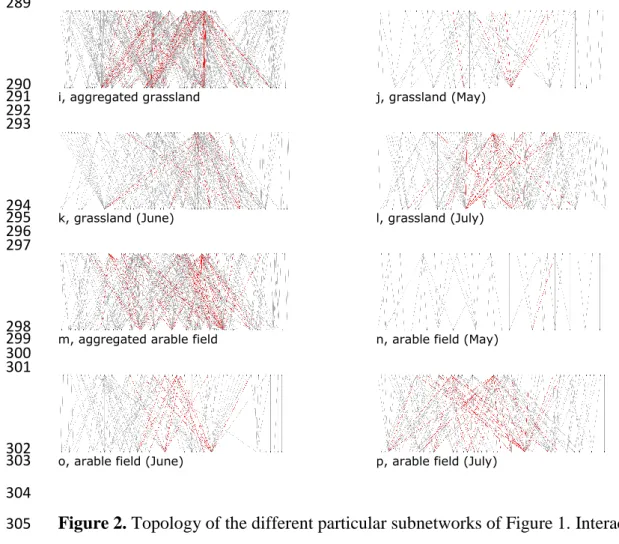
Figure 2 shows the topologies of the particular networks and Table 1 presents their 263
quantitative properties. The size of arable network was kind of similar to the grassland 264
network (NA = 159 and NG = 198, respectively) and in both networks most of the species 265
belonged to the giant component (G% = 96.23% and G% = 100%, respectively). The size of 266
the different subnetworks varied widely: the network of the stubble community was quite 267
simple with only NG = 4 species (2 plants and 2 pollinators) in the “giant” component (and 4 268
other species in two other components of size 2, see Appendix CD). Another small but 269
slightly more speciose community was found in the cornfields. The shrubby grassland, cereal 270
field, hay meadow, alfalfa and fallow communities were of medium size, while the pasture 271
communities were really speciose.
272 273
274 a, shrubby grassland b, cereal field
275 276 277
278 c, hay meadow d, cornfield
279 280 281
282 e, pasture f, stubble
283 284 285
286 g, alfalfa h, fallow
287
10 288 289
290 i, aggregated grassland j, grassland (May)
291 292 293
294 k, grassland (June) l, grassland (July)
295 296 297
298 m, aggregated arable field n, arable field (May)
299 300 301
302 o, arable field (June) p, arable field (July)
303 304
Figure 2. Topology of the different particular subnetworks of Figure 1. Interactions with a 305
frequency value greater than 4 are red. Only the giant components are shown (by removing 306
isolated nodes and dwarf components), except for the STU network that is so small that 307
defining a “giant” component does not really make sense (so we show the whole network).
308
The names of particular communities are indicated. Drawn by igraph (Csardi and Nepusz 309
2006).
310 311
Table 1 shows the size of the giant component and the dwarf component(s) for each 312
network. In most cases, a giant component dominated the network, containing an average of 313
87.95% of all species (the minimum was 50% and the maximum was 100%). Some 314
pollinators appeared only in a dwarf component in a particular interaction network. For 315
example, Halictus confusus (HALCON) pollinated only Solanum tuberosum in the cornfield 316
(COF) community (see dwarf components in each networks in Appendix CD). In general, 317
either plant or pollinator species in dwarf components (or in total isolation) can be more 318
vulnerable to environmental changes, since the replacement of their partner is more difficult.
319
In different habitats, very different species composed the dwarf components, so this kind of 320
interactions-based vulnerability is quite site-specific. But variability does not mean 321
11 randomness: species composition in dwarf components is perfectly nested: it never happens 322
that species [A B], [A C] and [B C] form dwarf components in 3 particular habitats.
323
The number of plant (NP) and pollinator (NA) species, as well as their ratio (NP/NA) 324
were also quite variable. The grassland in June (had the highest plant diversity compared to 325
animal diversity NP/NA = 1.08), while the alfalfa community had the lowest (NP/NA = 0.46).
326
The average NP/NA ratio was 0.79 for all the 16 networks.
327
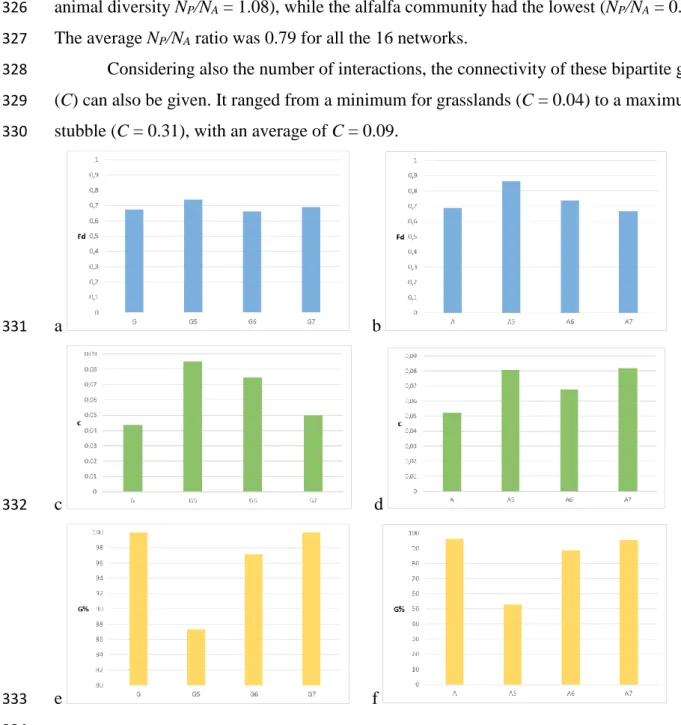
Considering also the number of interactions, the connectivity of these bipartite graphs 328
(C) can also be given. It ranged from a minimum for grasslands (C = 0.04) to a maximum for 329
stubble (C = 0.31), with an average of C = 0.09.
330
a b
331
c d
332
e f
333 334
Figure 3. Various properties of the aggregated networks (G = grassland, A = arable field) and 335
their monthly series from May to July (e.g. A5 = arable field in May, G7 = grassland in July):
336
fragmentation (Fd; a: grassland, b: arable field), connectivity (C; c: grassland, d: arable field) 337
and giant component ratio (G%; e: grassland, f: arable field).
338 339
12 The grassland and the arable field communities were described also in time: the
340
phenology of the three summer months was determined. The size of the network increased by 341
time in both grassland (Fig. 2i-l.) and arable (Fig. 2m-p) communities (Table 1). In both 342
communities, the proportion of species belonging to the giant component (G%) increased, 343
mostly from May to June (Fig. 3e, 3f). From May to July, distance-weighted fragmentation 344
(Fd) showed a decreasing tendency in the arable field community (Fig. 3b). In the same 345
period, connectivity (C) showed a decreasing tendency in the grassland community (Fig. 3c).
346
The change of fragmentation in the grassland (Figure 3a) and the change of connectivity in 347
the arable field (Figure 3d) were not monotonous. Based on distance-weighted fragmentation 348
(Fd), the arable field in May was the most vulnerable community in general (Fd = 0.86), while 349
the cornfield was the most stable (Fd = 0.64). The fragmentation value of the honeybee was 350
quite similar, the arable field in May being the most vulnerable to honeybee loss (FdAPIMEL = 351
0.92), while the grassland in June was the most stable against honeybee loss (FdAPIMEL = 0.68) 352
(Fig. 4).
353 354
355 356
Figure 4. The relationship between FdAPIMEL and NP/NA. The studied communities are more 357
sensitive to honeybee loss with an average plant/animal ratio: with a disproportionately low or 358
high plant/animal ratio, the loss of honeybee does not cause a large fragmentation effect on 359
ecological interactions.
360
13 361
5. Discussion 362
363
In multi-species ecological communities, direct and indirect inter-specific effects are crucial 364
for the coexistence and coevolution of species. Ecological interaction network models show 365
the possibilities and limitations on effects spreading through these interactions. In better 366
connected networks, there are several pathways supporting inter-specific effects and 367
coevolution, while in more fragmented networks species depend on and they are influenced 368
by fewer partners. Human disturbance can modify interaction networks and ultimately the 369
functioning of the whole multispecies system.
370
The structural variability of plant-pollinator networks influences the vulnerability of 371
pollinator communities against compositional changes (e.g. honeybee loss or decline) and 372
environmental disturbance (e.g. land use change or land management effects, Kovács- 373
Hostyánszki et al., 2017). Our quantitative, system approach to better understand mutualistic 374
communities revealed major differences among different plant-pollinator networks within the 375
same agricultural landscape that can help to support ecosystem management.
376
Based on most macroscopic network indicators, very different plant-pollinator 377
communities inhabited the different agricultural habitat types. These compositional and 378
structural network properties do have an effect on community dynamics and ecosystem 379
functioning. Bees are strongly connected with flower resources seeking for nectar and pollen, 380
therefore their presence mostly depends on these available foraging resources (Fründ et al., 381
2010; Rollin et al., 2015). A habitat with low number of flowers results in low bee abundance, 382
while low flowering plant diversity is usually associated with low bee diversity (Ebeling et 383
al., 2008; Fründ et al., 2010). High species diversity and community complexity of wild bees 384
in grasslands was clearly related to higher nectar quantity compared to arable fields (Baude et 385
al., 2017). The quite similar sized arable and grassland networks suggested a rather extensive 386
management in both land-use types and high amount of available wild flower resources (i.e.
387
weeds) also in arable fields. Although weeds are treated as serious competitors of crops 388
hampering crop production, they play major functional roles for agricultural biodiversity and 389
ecosystem services, especially pollination (Bretagnolle and Gaba, 2015; Rollin et al., 2016).
390
This is an important feature of the studied traditional low-intensity agriculture landscapes, 391
where partly due to topographical and historical issues the smallholder farming practices were 392
still preserved and inhabited by high weed and in general agro-biodiversity (Kovács- 393
Hostyánszki et al., 2016).
394
14 Among our studied subnetworks stubble fields were lately harvested or mown fields 395
just before the samplings, consequently only few remaining flowers were found there, visited 396
by a little number of bees. The second smallest network was found in the cornfields that were 397
ploughed and sown in spring. This recent soil disturbance prevented diverse plant and 398
pollinator communities (Nicholls and Altieri, 2013), but nevertheless a richly connected 399
network was found, where most of the species were part of the giant component. The autumn- 400
sown cereal fields, the left over fallows, and from the grassland habitat types the shrubby 401
grasslands and hay meadows hosted medium-sized plant-pollinator communities with a kind 402
of equal ratio of bees and visited plant species, while alfalfa fields showed twice as many bee 403
as plant species. Alfalfa (Medicago sativa) provides locally very abundant mono-floral 404
resources for pollinators that can attract both honeybees and wild bees, however its deep 405
flowers are more accessible for long-tongued bumblebees and specific genera of solitary wild 406
bees (e.g. Andrena, Halictus, Lasioglossum, Megachile, Melitta, Xylocopa) (Rollin et al., 407
2013). Besides alfalfa is a permanent crop that enhances the presence of several other wild 408
plant species within the field. Pasture communities were the most speciose both in plant and 409
wild bee species. These permanent grasslands are grazed mostly by sheep at low intensity and 410
are important refugees for flowering plant species all over the season (Loss et al., 2014;
411
Kovács-Hostyánszki et al., 2016). Furthermore grasslands and especially pastures were 412
surrounded in 1000 m radius scale by higher ratio of semi-natural habitats. Pastures are also 413
semi-natural fields having usually higher spatial expansion, and they are usually situated at 414
higher elevation and less accessible places that probably resulted in this higher semi-natural 415
habitat ratio in their 1000 m environment. Such a more natural environment could have also a 416
rather positive effect on wild bee diversity and abundance, and hence an effect on plant- 417
pollinator networks (Winfree et al. 2009, 2011, Kovács-Hostyánszki et al. 2017). In the 418
grassland network all species belonged to the giant component, and in most cases, a giant 419
component dominated the sub-networks too. The number of dwarf components or the number 420
of species within the dwarf components varied among the different sub-networks and we 421
found no clear relationship with any other network properties.
422
Looking at the temporal changes in grassland and arable field networks we found that 423
the size of the network and the proportion of species belonging to the giant component 424
increased by time in both arable and grassland communities, showing a bigger difference 425
between May and June and only a slightly increase from June to July. It is basically in line 426
with the increase of flowering plant species from May to June and the activity peak of most of 427
the wild bee species in early mid-summer (Michener, 2007; Rollin et al., 2015). Considering 428
15 also the number of interactions, connectivity (C) showed a decreasing tendency in the
429
grassland community over time, while distance-weighted fragmentation (Fd) showed a 430
decreasing tendency in the arable field community, suggesting increased compactness.
431
While honeybee has an outstanding role in many of the crops’ pollination, it had the 432
highest relative abundance in our studied total plant-pollinator network, being each third 433
individual of flower visitors of the mostly wild plant species. Western honeybee is a widely 434
managed species also in Romania, where honey market is 100% self-supply, beekeeping 435
sector is characterized by a fast dynamic during 2000-2010 and supply of honeybees is 436
relatively high compared to the pollination demand of insect-pollinated crops (Pocol et al., 437
2012; Breeze et al., 2014). Our result is in line with a recent study based on a global dataset of 438
80 published plant–pollinator interaction networks as well as pollinator effectiveness 439
measures from 34 plant species in natural habitats, which found that the western honeybee 440
was the most frequent floral visitor, averaging 13% of floral visits across all networks (range 441
0–85%; Hung et al. 2018). We found that the structural importance of honeybee was largest 442
with an average plant/animal ratio (NP/NA). The alfalfa community (with low plant/animal 443
ratio) and the grassland community in June (with high plant/animal ratio) were quite stable 444
against the loss of honeybee, while the communities with intermediate plant/animal ratios 445
(e.g. hay meadow, arable field in May) were the most structurally vulnerable ones. While 446
long-term changes characterize pollinator diversity (Baude et al., 2017), our findings about 447
the unimodal change of honeybee importance with the plant/animal ratio support the presently 448
outstanding importance of honeybee, especially in crop fields. Arable fields especially in 449
springtime are still relatively flower poor and often disturbed habitats, therefore they might 450
better rely on generalist species such as honeybee for crop and wild plant pollination (Carman 451
and Jenkins, 2016). There are certainly differences among crops based on their reliance on 452
honeybee pollination, and potential decline and disappearance of honeybee would have 453
certainly important economic consequences. Some relevant crop and fruit tree species in the 454
Central-European region, such as sunflower (Helianthus annuus), apple (Malus sylvestris), 455
cherry (Prunus subg. Cerasus) are suggested to be primary or most abundantly pollinated by 456
honeybees (Abrol et al., 2012), however as Garibaldi et al. (2014) pointed out, wild insect 457
visitation had stronger effects on fruit set than honey bee visitation in most of these crop 458
systems too. Other crops such as alfalfa for example is poorly pollinated by honeybees, since 459
its deep flowers are more accessible for wild bee species having longer tongue (e.g. Bombus 460
ssp., Megachile ssp.; Abrol et al., 2012). Species rich natural habitats (i.e. grasslands in June), 461
however, seem to be stable without honeybee, relying on flower-visitation by wild bees.
462
16 Moreover, according to Hung et al. (2018) for one third of plant-pollinator networks and half 463
of the plant species in natural habitats honeybee visitation was never observed, highlighting 464
the importance of wild pollinators for many flowering plant taxa.
465
One limitation of studying these bipartite networks is that data typically describe 466
visitation frequency, while the act of pollen transfer or getting reward would be more 467
functional, biologically more relevant observations (Alarcón, 2010). Another issue to consider 468
is that these mutualistic communities are subsets of larger ecological communities: both the 469
plants and the pollinators have a number of other partners (e.g. parasites, see Klein et al., 470
2017), so neither the structure nor the dynamics of these sub-networks can tell the whole 471
story. Yet, focusing on a bipartite network (Bascompte et al., 2006; Soares et al., 2017) is a 472
quantitative tool providing comparative knowledge on several systems, including spatial and 473
temporal series (cf. temporal changes in pollinator diversity, Baude et al., 2016; bee-flower 474
interaction networks along a disturbance gradient, Carman and Jenkins, 2016).
475
Future extensions of this study may better focus on the importance of weights (by 476
comparing weighted and binary networks) and they may compare visitation networks to 477
networks where interactions are determined by pollen analysis (Alarcón et al., 2010;
478
Ballantyne et al., 2015). Further, aggregating species into larger functional groups would be a 479
probably interesting research direction (aggregation based on either traits or network 480
topology; Garibaldi et al., 2015), while some patterns at the network level can be better 481
understood in the light of metrics analysed at the species level (Soares et al., 2017; Kovács- 482
Hostyánszki et al., in prep). It should be also important to merge plant-pollinator interactions 483
with others in unified models (see Losapio et al., 2015). As of particular interest, both from a 484
network dynamics point of view and also biologically, we have to better understand dwarf 485
components: why are these species not connected to the giant component and how could they 486
be connected (though which other species)? If we can understand the evolutionary ecology of 487
being out of the giant component, we may get a better framework for the conservation and 488
management of the whole system.
489
In summary, we found that honeybee clearly dominates the total, aggregated plant- 490
pollination network of the whole area. Its network position widely differs in various 491
subnetworks that are of different size and fragmentedness. The loss of honeybee seems to 492
cause the largest structural changes in subnetworks with an average plant/animal ratio. In 493
order to assess the possible consequences of future declines and invasions, a large-scale 494
comparative analysis of geographically distant networks can be informative. Different species 495
are the dominant crop pollinators in different ecoregions (Kleijn et al., 2015), and their 496
17 neighbourhood could be predictive for their ecological function in new environments. In order 497
to better understand and protect these communities, it is crucial to focus conservation on their 498
interaction structure and further improve the methodology here (Biella et al., 2017).
499 500
Acknowledgements 501
502
We are grateful to Anett Endrédi for technical help with network visualization. Two 503
anonymous Referees are acknowledged for highly valuable comments on the manuscript. Our 504
research was funded by the grant GINOP-2.3.2-15-2016-00057. AK-H was supported by the 505
NKFIH project (FK123813), was a Bolyai Fellow and a MTA Postdoctoral Fellow. The work 506
of FJ was supported by the National Research, Development and Innovation Office – NKFIH, 507
grant number K 116071.
508 509
References 510
Abrams, P.A., Menge, B.A., Mittelbach, G.G., Spiller, D.A., Yodzis, P., 1996. The role of 511
indirect effects in food webs. In: G.A. Polis and K.O. Winemiller (Editors), Food 512
webs: integration of patterns and dynamics. Chapman and Hall, London., pp. 371-395.
513
Abrol, D.P., 2012. Pollination Biology: Biodiversity Conservation and Agricultural 514
Production. Springer Science Business Media B.V.
515
Aizen, M.A., Harder, L.D., 2009. The Global Stock of Domesticated Honey Bees Is Growing 516
Slower Than Agricultural Demand for Pollination. Curr. Biol. 19, 915–918.
517
https://doi.org/10.1016/j.cub.2009.03.071 518
Alarcón, R., 2010. Congruence between visitation and pollen-transport networks in a 519
California plant/pollinator community. Oikos 119, 35–44.
520
https://doi.org/10.1111/j.1600-0706.2009.17694.x 521
Aslan, C.E., Liang, C.T., Galindo, B., Hill, K., Topete, W., 2016. The Role of Honey Bees as 522
Pollinators in Natural Areas. Nat. Areas J. 36, 478–488.
523
https://doi.org/10.3375/043.036.0413 524
Ballantyne, G., Baldock, K. C. R., Willmer P. G., 2015. Constructing more informative plant–
525
pollinator networks: visitation and pollen deposition networks in a heathland plant 526
community. Proc. R. Soc. B. 282, 20151130.
527
Baranyi, G., Saura, S., Podani, J. and Jordán, F., 2011. Contribution of habitat patches to 528
network connectivity: redundancy and uniqueness of topological indices. Ecol. Ind.
529
11, 1301-1310.
530
18 Bascompte, J., 2009. Disentangling the web of life. Science 325, 416-419.
531
Bascompte, J., Jordano, P., 2007. Plant-Animal Mutualistic Networks: The Architecture of 532
Biodiversity. Annu. Rev. Ecol. Evol. Syst. 38, 567–593.
533
https://doi.org/10.1146/annurev.ecolsys.38.091206.095818 534
Bascompte, J., P. Jordano, C.J. Melián and J. M. Olesen., 2003. The nested assembly of plant- 535
animal mutualistic networks. Proceedings of the National Academy of Sciences, USA 536
100, 9383-9387.
537
Bascompte, J., Jordano, P., Olesen, J. M., 2006. Asymmetric coevolutionary networks 538
facilitate biodiversity maintenance. Science 312, 431–433.
539
Baude, M., Kunin, W.E., Boatman, N.D., Conyers, S., Davies, N., Gillespie, M.A.K., Morton, 540
R.D., Smart, S.M. and Memmott, J. 2016. Historical nectar assessment reveals the fall 541
and rise of floral resources in Britain. Nature 530:85–88.
542
Benedek, Zs., Jordán, F. and Báldi, A., 2007. Topological keystone species complexes in 543
ecological interaction networks. Commun. Ecol. 8, 1-8.
544
Biella, P., Ollerton, J., Barcella, M. and Assini, S., 2017. Network analysis of phenological 545
units to detect important species in plant-pollinator assemblages: can it inform 546
conservation strategies? Commun. Ecol. 18, 1-10.
547
Blüthgen, N., Menzel, F. and Blüthgen, N., 2006. Measuring specialization in species 548
interaction networks. BMC Ecology 6:9. doi:10.1186/1472-6785-6-9 549
Bond, W.J., 1994. Keystone species. In: Schulze, E.D. and Mooney, H.A. (Eds.), Biodiversity 550
and Ecosystem Function, Springer Verlag, Heidelberg.
551
Breeze, T.D., Vaissière, B.E., Bommarco, R., Petanidou, T., Seraphides, N., Kozák, L., 552
Scheper, J., Biesmeijer, J.C., Kleijn, D., Gyldenkærne, S., Moretti, M., Holzschuh, A., 553
Steffan-Dewenter, I., Stout, J.C., Pärtel, M., Zobel, M., Potts, S.G., 2014. Agricultural 554
policies exacerbate honeybee pollination service supply-demand mismatches across 555
Europe. PLoS One 9. https://doi.org/10.1371/journal.pone.0082996 556
Bretagnolle, V., Gaba, S., 2015. Weeds for bees? A review. Agron. Sustain. Dev. 35, 891–
557
909. https://doi.org/10.1007/s13593-015-0302-5 558
Brittain, C., Kremen, C., Klein, A.-M., 2013. Biodiversity buffers pollination from changes in 559
environmental conditions. Glob. Chang. Biol. 19, 540–7.
560
https://doi.org/10.1111/gcb.12043 561
Bronstein, J.L., 2001. The exploitation of mutualisms. Ecol. Lett. 4, 277–287.
562
https://doi.org/10.1046/j.1461-0248.2001.00218.x 563
19 Brose, U., Berlow, E.L. and Martinez, N.D., 2005. Scaling up keystone effects from simple to 564
complex ecological networks. Ecol. Lett. 8, 1317-1325.
565
Carman, K., Jenkins, D.G., 2016. Comparing diversity to flower-bee interaction networks 566
reveals unsuccessful foraging of native bees in disturbed habitats. Biol. Conserv. 202, 567
110–118. https://doi.org/10.1016/j.biocon.2016.08.030 568
Carvell, C., Bourke, A.F.G., Dreier, S., Freeman, S.N., Hulmes, S., Jordan, W.C., Redhead, 569
J.W., Sumner, S., Wang, J., Heard, M.S., 2017. Bumblebee family lineage survival is 570
enhanced in high-quality landscapes. Nature 543, 547–549.
571
https://doi.org/10.1038/nature21709 572
Csardi, G. and Nepusz, T., 2006. The igraph software package for complex network research.
573
InterJournal, Complex Systems 1695.
574
Daily, G.C. (eds.) 1997. Nature’s services: social dependence on natural ecosystems. Island 575
Press, Washington, DC.
576
Ebeling, A., Klein, A.-M., Schumacher, J., Weisser, W.W., Tscharntke, T., 2008. How does 577
plant richness affect pollinator richness and temporal stability of flower visits? Oikos 578
117, 1808–1815. https://doi.org/10.1111/j.1600-0706.2008.16819.x 579
ESRI 2008 580
European Environment Agency (EEA). The European Topic Centre on Spatial Information 581
and Analysis. Date of delivery: December 2013 582
Fründ, J., Linsenmair, K.E., Blüthgen, N., 2010. Pollinator diversity and specialization in 583
relation to flower diversity. Oikos 119, 1581–1590. https://doi.org/10.1111/j.1600- 584
0706.2010.18450.x 585
Garibaldi, L.A., Bartomeus, I., Bommarco, R., Klein, A.M., Cunningham, S.A., Aizen, M.A., 586
Boreux, V., Garratt, M.P.D., Carvalheiro, L.G., Kremen, C., Morales, C.L., Schüepp, 587
C., Chacoff, N.P., Freitas, B.M., Gagic, V., Holzschuh, A., Klatt, B.K., Krewenka, 588
K.M., Krishnan, S., Mayfield, M.M., Motzke, I., Otieno, M., Petersen, J., Potts, S.G., 589
Ricketts, T.H., Rundlöf, M., Sciligo, A., Sinu, P.A., Steffan-Dewenter, I., Taki, H., 590
Tscharntke, T., Vergara, C.H., Viana, B.F., Woyciechowski, M., 2015. Trait matching 591
of flower visitors and crops predicts fruit set better than trait diversity. J. Appl. Ecol.
592
52, 1436–1444. https://doi.org/10.1111/1365-2664.12530 593
Garibaldi, L. a, Steffan-Dewenter, I., Winfree, R., Aizen, M. a, Bommarco, R., Cunningham, 594
S. a, Kremen, C., Carvalheiro, L.G., Harder, L.D., Afik, O., Bartomeus, I., Benjamin, 595
F., Boreux, V., Cariveau, D., Chacoff, N.P., Dudenhöffer, J.H., Freitas, B.M., 596
20 Ghazoul, J., Greenleaf, S., Hipólito, J., Holzschuh, A., Howlett, B., Isaacs, R.,
597
Javorek, S.K., Kennedy, C.M., Krewenka, K.M., Krishnan, S., Mandelik, Y., 598
Mayfield, M.M., Motzke, I., Munyuli, T., Nault, B. a, Otieno, M., Petersen, J., Pisanty, 599
G., Potts, S.G., Rader, R., Ricketts, T.H., Rundlöf, M., Seymour, C.L., Schüepp, C., 600
Szentgyörgyi, H., Taki, H., Tscharntke, T., Vergara, C.H., Viana, B.F., Wanger, T.C., 601
Westphal, C., Williams, N., Klein, A.M., 2013. Wild pollinators enhance fruit set of 602
crops regardless of honey bee abundance. Science 339, 1608–11.
603
https://doi.org/10.1126/science.1230200 604
Ghazoul, J., 2005. Buzziness as usual? Questioning the global pollination crisis. Trends Ecol.
605
Evol. 20, 367–373. https://doi.org/10.1016/j.tree.2005.04.026 606
Giannini, T.C., Garibaldi, L.A., Acosta, A.L., Silva, J.S., Maia, K.P., Saraiva, A.M., 607
Guimarães, P.R., Kleinert, A.M.P., 2015. Native and non-native supergeneralist bee 608
species have different effects on plant-bee networks. PLoS One 10, 1–13.
609
https://doi.org/10.1371/journal.pone.0137198 610
Goulson, D., Nicholls, E., Botías, C., Rotheray, E.L., 2015. Bee declines driven by combined 611
stress from parasites, pesticides, and lack of flowers. SciencExpress 2010, 1–16.
612
https://doi.org/10.1126/science.1255957 613
Guimarães Jr, P.R., Pires, M.M., Jordano, P., Bascompte, J. and Thompson, J.N., 2017.
614
Indirect effects drive coevolution in mutualistic networks. Nature 550:511–514.
615
Hung, K.-L.J., Kingston, J.M., Albrecht, M., Holway, D.A., Kohn, J.R., 2018. The worldwide 616
importance of honey bees as pollinators in natural habitats. Proc. R. Soc. B Biol. Sci.
617
285, 20172140. https://doi.org/10.1098/rspb.2017.2140 618
IPBES 2016. The assessment report of the Intergovernmental Science-Policy Platform on 619
Biodiversity and Ecosystem Services on pollinators, pollination and food production.
620
S.G. Potts, V. L. Imperatriz-Fonseca, and H. T. Ngo, (eds). Secretariat of the 621
Intergovernmental Science-Policy Platform on Biodiversity and Ecosystem Services, 622
Bonn, Germany, pp. 552.
623
Jordano, P., 1987. Patterns of mutualistic interactions in pollination and seed dispersal:
624
connectance, dependences, asymmetries and coevolution. American Naturalist 625
129:657-677.
626
Jordán, F., Liu, W.C. and van Veen, F.J.F., 2003. Quantifying the importance of species and 627
their interactions in a host-parasitoid community. Commun. Ecol. 4, 79-88.
628
Jordán, F., Liu, W.C. and Mike, Á., 2009. Trophic field overlap: a new approach to quantify 629
keystone species. Ecological Modelling, 220:2899-2907.
630
21 Kaiser-Bunbury, C.N., Mougal, J., Whittington, A.E., Valentin, T., Gabriel, R., Olesen, J.M.
631
and Blüthgen, N., 2017. Ecosystem restoration strengthens pollination network 632
resilience and function. Nature, 542:223–227. doi:10.1038/nature21071 633
Kearns, C.A., Inouye, D.W. and Waser, N.M., 1998. Endangered mutualisms: the 634
conservation of plant-pollinator interactions. Annual Review of Ecology and 635
Systematics 29:83-112.
636
Kishi, S., Sakura, N., Yoshikawa, T., Hiraiwa, M.K., Katoh, K., 2017. Interaction between 637
insects and insect-pollinated plants on Miyake Island after a recent volcanic eruption:
638
A comparison between vegetation types. Journal of Asia-Pacific Entomology 20:964- 639
970.
640
Klein, S., Cabirol, A., Devaud, J.-M., Barron, A.B. and Lihoreau, M., 2017. Why bees are so 641
vulnerable to environmental stressors? Trends Ecol. Evol. 32:268-278.
642
Kleijn, D. et al., 2015. Delivery of crop pollination services is an insufficient argument for 643
wild pollinator conservation. Nature Communications 6:7414.
644
Kovács-Hostyánszki, A., Földesi, R., Mózes, E., Szirák, Á., Fischer, J., Hanspach, J. et al., 645
2016. Conservation of pollinators in traditional agricultural landscapes – new 646
challenges in Transylvania (Romania) posed by EU accession and recommendations 647
for future research. PLoS ONE 11(6): e0151650.
648
https://doi.org/10.1371/journal.pone.0151650 649
Kovács-Hostyánszki, A., Espíndola, A., Vanbergen, A.J., Settele, J., Kremen, C., Dicks, L.
650
V., 2017. Ecological intensification to mitigate impacts of conventional intensive land 651
use on pollinators and pollination. Ecol. Lett. 20, 673–689.
652
https://doi.org/10.1111/ele.12762 653
Lai, S.M., Liu, W.C., and Jordán, F., 2012. On the centrality and uniqueness of species from 654
the network perspective. Biology Letters, 8:570-573.
655
Lai, S.M., Liu, W.C., and Jordán, F., 2015. A trophic overlap-based measure for species 656
uniqueness in ecological networks. Ecological Modelling, 299: 95-101.
657
Lawton, J.H., Brown, V.K., 1994. Redundancy in ecosystems. In: Schulze, E.D. and Mooney, 658
H.A. (Eds.), Biodiversity and Ecosystem Function, Springer Verlag, Heidelberg, pp.
659
255-270.
660
Lewis, O.T., Memmott, J., LaSalle, J., Lyal, C.H.C., Whitefoord, C. and Godfray, H.C.J., 661
2002. Structure of adiverse tropical forest insect-parasitoid community. Journal of 662
Animal Ecology, 71:855-873.
663