ANALYSIS OF DOUBLE-PEAK SEASONALITY IN THE AETIOLOGY OF PERINATAL MORTALITY AND CHILDHOOD ACUTE LYMPHOBLASTIC LEUKAEMIA USING THE WALTER–
ELWOOD METHOD
NYÁRI,T.A.1*–VIRÁG,K.1,2–MCNALLY,R.J.Q.3
1Department of Medical Physics and Informatics, University of Szeged Szeged, Korányi fasor 9, H-6720 Hungary
2Bolyai Institute, University of Szeged, Szeged, Aradi vértanúk tere 1, H-6720 Hungary (e-mail: viragk@math.u-szeged.hu; phone: +36-62-545-833; fax: +36-62-545-077)
3Institute of Health & Society, Newcastle University, NE1 4LP Newcastle upon Tyne, U. K.
(e-mail: richard.mcnally@ncl.ac.uk; phone: +44 191 282 1356; fax: +44 191 282 4724)
*Corresponding author
e-mail: nyari.tibor@med.u-szeged.hu; phone: +36-62-545-833; fax: +36-62-545-077
(Received 25th Oct 2018; accepted 7th Jan 2019)
Abstract. Our study demonstrates the use of the Walter–Elwood method in double-peak seasonal variation. The concept of the geometrical model for analysing cyclic variation is described. Monte Carlo simulation procedures are used to compare the performance of the Walter–Elwood and negative binomial regression methods with double-peak seasonality, in both a comparison between the two methods and a power analysis. The results of 10,000 independent Monte Carlo simulations showed that the Walter–
Elwood method and the negative binomial regression analysis identified the same peak in 9,956 samples, indicating that the power of both methods is similar in analysing double-peak cyclic trends. Additionally, two epidemiological applications of double-peak seasonality are presented, which were analysed using the Walter–Elwood method. Further, this is the first study to describe the power of the Walter-Elwood method for double peak seasonality. In conclusion, double-peak seasonality could be investigated with the Walter–Elwood method in ecological studies when only the population at risk is available and there is no other variable.
Keywords: environmental effect, geometrical model, cyclic variation, Monte-Carlo simulations, power analyses, population at risk, perinatal mortality, childhood leukaemia
Introduction
Seasonal variation is a feature of many diseases with a potential infectious component and contributes to a better understanding of aetiology. There are a number of methods for analysing cyclic trends, and this type of patterning can be studied in several different ways (Hewitt et al., 1971; Roger, 1977; Marrero, 1983; Jones et al., 1988). In 1961, Edwards introduced a geometrical model, which only used the number of observations (Edwards, 1961). Walter and Elwood (1975) extended Edwards’ idea by including the population at risk. Stolwijk et al. (1999) described an application of logistic regression. The methodology developed by Walter and Elwood is widely used in single-peak analyses but not in double-peak analyses. However, the method is entirely suited to analysing double-peak seasonal variation.
The most frequent numbers of deaths occur in infants aged under 1 year, and a relatively high proportion of children aged between 0 and 14 years die from cancer.
Acute lymphoid leukaemia (ALL) is the most common type of cancer found in children.
Environmental hazards including infections around the time of birth have long been suspected as a possible factor in the aetiology of childhood ALL and in perinatal mortality (McNally and Eden, 2004).
The aim of our study was to demonstrate the use of the Walter–Elwood method in double-peak seasonal variation when the investigated event repeats in six-monthly cycles. Two datasets are used to illustrate the use of the Walter–Elwood method for analysing seasonality in the aetiology of ALL in children under 5 years of age and in perinatal mortality, respectively.
Methods
We describe the concept of the geometrical model for analysing cyclic variation.
Seasonal fluctuations of an event (e.g. infant death) which occurs on a fixed date every year might be described using cyclic patterns over a period of time (e.g. two decades).
We suppose that within a certain time span (e.g. a year) there are k sectors (e.g. 12 months) and that in sector i there are ni events from a population at risk of size mi (e.g.
total births during that month). The total number of events is N=∑ni and the total size of the population at risk is M=∑mi.
H0: The expected number of events in a sector is proportional to the population at risk in that sector, i.e. E(ni)=Nmi/M.
The basic idea of the Walter–Elwood method is that the monthly number of observed events and the population at risk are grouped by month over the study period yielding data for all 12 months for both events and population at risk. Then the weighted monthly numbers in the aggregated data are placed on the circumference of a circle with unit radius using the polar co-ordinate system. In the case of single-peak seasonality, this circle represents the year, and the sectors correspond to 12 months.
The data by weights √ni are placed around a unit circle at points corresponding to the sector midpoints at angles θi to an arbitrary diameter (e.g. the diameter through 1 January: January is 0°).
Average observed frequencies are:
=
= = k i
i k
i
i i
n n x
1 1
cos
=
= = k i
i k
i
i i
n n y
1 1
sin
(Eq.1)
From (Eq. 1) we calculate the expected values of x and y:
=
=
=
= =
= k
i i k
i
i i k
i
i k
i
i i
x
m m M
Nm M Nm
1 1
1 1
cos /
cos
/
=
= = k i
i k
i
i i y
m m
1 1
sin
(Eq.2)
The variances of the coordinates of the sample centre of gravity are:
2 1
1 2 2
] / [
4cos 1
=
= k= i
i k i
i x
M Nm
2 1
1 2 2
] / [
4sin 1
=
= k = i
i k i
i y
M Nm
(Eq.3)
The test statistic (Eq. 4) is distributed on the null hypothesis as χ2 with 2 degrees of freedom:
2 2
+ −
−
y y x
x y
x
(Eq.4)
The distance d of the sample centre of gravity from its null expectation is provided by
2 2
2 (x x) (y y)
d = − + − (Eq.5)
If the null hypothesis is true (no seasonal trend or equal underlying rates in each month), then the centre of gravity has an expected value of zero on both the x and y axes.
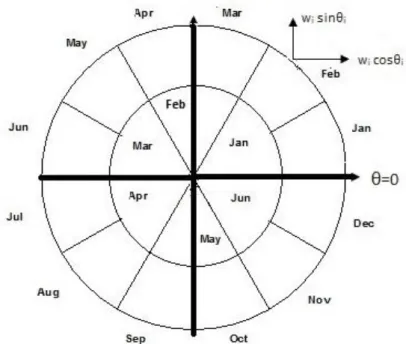
This hypothesis is tested using chi-square statistics with 2 degrees of freedom. If the test statistic is greater than 5.99, then a simple harmonic trend should be fit to the data (Fig.
1). We may suppose that the expected frequency in sector i is proportional to
1+ cos( − )
= i i
i m
c (Eq.6)
where amplitude α = 4d is a measure of the cyclic variation, which is calculated using the formula developed by Edwards (Eq. 6), and where θ* (Eq. 7) provides the discretion of the maximum rate, which may be estimated as
−
= − −
x y
x Tan y
1 (Eq.7)
The adequacy of the description of the data afforded by a simple harmonic curve may be evaluated by a goodness-of-fit test using a further χ2 statistic. The expected frequencies ni’ are calculated by
== k
i i i
i Nc c
n
1
' /
and the goodness-of-fit test statistic (Eq. 8) is:
( )
= k −i
i i
i n n
n
1
2 '
' / (Eq.8)
which has a χ2 distribution with (k-1) degrees of freedom.
Figure 1. Sectors for single-peak (outside circle) and double-peak (inside circle) analysis
The use of the Walter–Elwood method to analyse double-peak seasonality with six sectors is based on the assumption that the observed events occur six months apart.
Thus, the monthly data are aggregated using the months of the first half year and adding to them the corresponding data from six months later (e.g. January and July).
Additionally, the first angle of maximum variation is detected by this test and the second maximum is at θ*+π (Fig. 1). The test statistic remains unchanged, that is a chi- square statistic with 2 degrees of freedom. Similarly, the goodness-of-fit test remains the same for both single-peak and double-peak analyses. Nevertheless, Monte Carlo simulation procedures were used to compare the performance of the Walter–Elwood and negative binomial regression methods. 10,000 random samples from a Poisson distribution were generated with double-peak seasonality and used in both a comparison between the two methods and a power analysis. A p value of less than 0.05 was considered to indicate a significant effect.
Two datasets are used to illustrate the use of the Walter–Elwood method for analysing seasonality.
Acute lymphoblastic leukaemia study
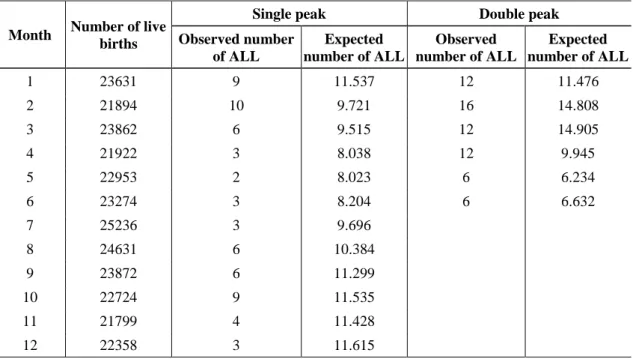
We have investigated seasonal trends in the incidence of ALL around the time of birth in children aged 0-4 years. Children born between 1981 and 1997 in south-eastern Hungary were considered. The monthly number of cases and births in the 1981-1997 period are displayed in Table 1.
Perinatal mortality study
In this study, cyclic changes in early perinatal mortality rates were investigated during the 34-year interval between 1 January 1980 and 31 December 2014 in Hungary.
The data on the cause of perinatal deaths were published annually by the Central Statistical Office (KSH, 1980-2014).
Results
Monte Carlo simulation
The results of the Monte Carlo simulations showed that out of 10,000 independent data sets, the Walter–Elwood method indicated significant double-peak seasonality in 8,416 cases, while the negative binomial regression analysis did so in 8,672 cases.
Moreover, the two methods identified the same peaks in 9,956 samples, indicating that the power of the Walter–Elwood method is similar to the negative binomial regression in analysing double-peak cyclic trends.
Acute lymphoblastic leukaemia study
Table 1. The monthly number of acute lymphoblastic leukaemia (ALL) cases and births in the period 1981-1997
Month Number of live births
Single peak Double peak
Observed number of ALL
Expected number of ALL
Observed number of ALL
Expected number of ALL
1 23631 9 11.537 12 11.476
2 21894 10 9.721 16 14.808
3 23862 6 9.515 12 14.905
4 21922 3 8.038 12 9.945
5 22953 2 8.023 6 6.234
6 23274 3 8.204 6 6.632
7 25236 3 9.696
8 24631 6 10.384
9 23872 6 11.299
10 22724 9 11.535
11 21799 4 11.428
12 22358 3 11.615
The calculated expected frequencies in the analysis using a single-peak seasonal pattern are also shown in Table 1. The 2 test statistic is 2.45, which indicates no significant (p = 0.293) cyclic pattern. However, with the Walter–Elwood method using a double-peak seasonal pattern, the 2 test statistic is 6.11, which indicates a significant (p = 0.047) cyclic pattern. The amplitude and the angle of maximum rate were 0.43 and 116.5, respectively. Thus, peak rates occurred in children born in February and August.
The goodness-of-fit test statistic was 1.18 (p = 0.946). These findings with the Walter–
Elwood method are similar to our published results from southern Hungary (Nyári et al., 2008).
Perinatal mortality study
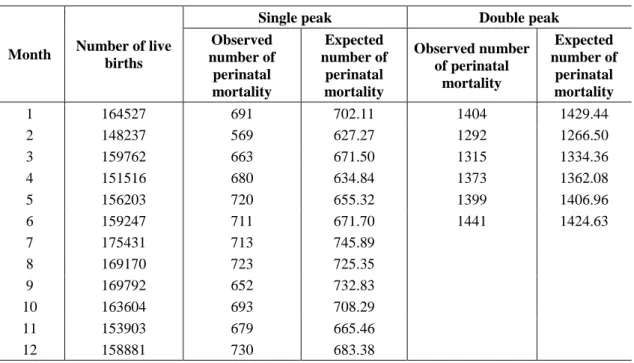
The monthly number of deaths and births in the study period are summarised in Table 2. The calculated expected frequencies in the analysis using a single-peak seasonal pattern are also shown in Table 2. The 2 test statistic is 1.114, which indicates no significant (p = 0.57) seasonality.
Table 2. The monthly number of perinatal mortality and births in the period 1980-2014
Month Number of live births
Single peak Double peak
Observed number of
perinatal mortality
Expected number of
perinatal mortality
Observed number of perinatal
mortality
Expected number of
perinatal mortality
1 164527 691 702.11 1404 1429.44
2 148237 569 627.27 1292 1266.50
3 159762 663 671.50 1315 1334.36
4 151516 680 634.84 1373 1362.08
5 156203 720 655.32 1399 1406.96
6 159247 711 671.70 1441 1424.63
7 175431 713 745.89
8 169170 723 725.35
9 169792 652 732.83
10 163604 693 708.29
11 153903 679 665.46
12 158881 730 683.38
If we employ the Walter–Elwood method using a double-peak seasonal pattern, the
2 test statistic is 18.74, which indicates a significant (p < 0.001) cyclic pattern. The amplitude and angle of maximum rate were 0.068 and -71.8, respectively. Maximum rates occurred in children born in May and November in the simple harmonic model for perinatal mortality. The goodness-of-fit test statistic was 1.567 (p = 0.905). These findings using the Walter–Elwood method confirm our published results that significant double-peak seasonality was found in children born in May and November for perinatal mortality (Nyári et al., 2015).
Discussion
We have presented detailed descriptions of the use of the Walter–Elwood method for double-peak seasonality and shown the power of this method using Monte Carlo simulations. These simulations have revealed that the power of the Walter–Elwood method is very close to the negative binomial regression method in analyses of double- peak seasonality.
Using the Walter–Elwood method seasonal variability for ALL related to date of birth of all children diagnosed under age five years was detected. We found evidence of seasonality related to month of birth with peaks in February and August. Both peaks correspond to previous findings and could reflect the seasonality of infectious diseases.
Significant double peak model was fitted to characterize the seasonal variation of perinatal mortality using the Walter-Elwood method. The peaks were observed in May and November and we might assume that perinatal mortality may have been related to respiratory infections (Borchers et al., 2013). Formerly, we have detected double peak of seasonality with generalized linear models. This study demonstrates that the application of the Walter -Elwood method for double peak of seasonality gives similar
results with high power. Further, this is the first study to describe the power of the Walter-Elwood method for double peak seasonality.
Many health conditions and exposures (or risk factors) involve some seasonal element (Marrero, 1983; Jones et al., 1988). The harmonic model is one of the simplest.
It may be adopted to represent oscillating rates. However, the main limitation of using a fitted sine curve is the inability to adjust for covariates. Furthermore, the fitted harmonic trend yields a poor goodness-of-fit test statistic when the variation of the observed data is high.
The choice among analytical approaches should ideally reflect the research question of interest, and simple methods are compelling in many cases. There is a free programmed spreadsheet known as Episheet to apply Edwards’ geometrical model (Rothman, 2008). However, this program only detects single-peak seasonality. Our study demonstrates that the Walter–Elwood method is easy to calculate using a spreadsheet program for double-peak seasonality.
Walter (1977) published a power calculator for the Edwards method for a single- peak cyclic pattern but not for a double peak. Stolwijk and his colleagues (1999) criticized the Walter–Elwood method for analysing double-peak seasonality. Similarly, Barnett and Dobson (2010) described a poor power for the use of the Walter–Elwood method in analysing double-peak seasonality. In contrast, our findings have revealed a similar power for the Walter–Elwood method, which characterizes the negative binomial regression method in analyses for double-peak seasonality.
Christiansen and his colleagues (2012) reviewed methods for analysing seasonal variation. They suggested using the peak-to-trough ratio. Cave and Freedman (1975) presented a method for double-peak seasonality analysis of Crohn’s disease using an extension of the Edwards test in methodology. Similarly, our study found that the Walter–Elwood method is a suitable method to analyse double-peak seasonal variation.
Furthermore, this method allows the inclusion of the population at risk, and it is simple to calculate both for the test statistics and the fitted expected frequencies.
In conclusion, double-peak seasonality could be investigated with the Walter–
Elwood method in ecological studies when only population at risk is available and there is no confounding variable. Since cyclic trends in the aetiology of a disease reveal some effect of environmental factors we might assume that both childhood acute lympoid leukaemia under age five years and perinatal mortality may have been related to respiratory infections. These findings could prove useful in preventive strategies, but further cohort studies need to investigate this hypothesis.
Acknowledgements. This research was supported by the European Union and the State of Hungary, co- financed by the European Social Fund under EFOP-3.6.1-16-2016-00008.
Ethical approval. No ethical approval was necessary based on the Hungarian Law on the use of statistical data (Act XLVI 1993, Sec. 10).
Conflict of interests. The authors declare that they have no conflict of interests.
REFERENCES
[1] Barnett, A. G., Dobson, A. J. (2010): Analysing Seasonal Health Data. – Springer, Berlin.
[2] Borchers, A. T., Chang, C., Gershwin, M. E., Gershwin, L. J. (2013): Respiratory syncytial virus—a comprehensive review. – Clin Rev Allergy Immunol 45: 331-379.
[3] Cave, D. R., Freedman, L. S. (1975): Seasonal variations in the clinical presentation of Crohn’s disease and ulcerative colitis. – Int J Epidemiol 4: 317-320.
[4] Christiansen, C. F., Pedersen, L., Sørensen, H. T., Rothman, K. J. (2012): Methods to assess seasonal effects in epidemiological studies of infectious diseases--exemplified by application to the occurrence of meningococcal disease. – Clin Microbiol Infect 18: 963- 969.
[5] Edwards, J. H. (1961): The recognition and estimation of cyclic trends. – Ann Hum Genet 25: 83-87.
[6] Hewitt, D., Milner, J., Cisma, A., Pakula, A. (1971): On Edwards’ criterion of seasonality and a non-parametric alternative. – Brit J PrevSoc Med 25: 174-176.
[7] Jones, R. H., Ford, P. M., Hamman, R. F. (1988): Seasonality comparisons among groups using incidence data. – Biometrics 44: 1131-1144.
[8] KSH (1980-2014): The Hungarian Central Statistical Office. Demographic Yearbook, 1963-2014. – KSH, Budapest.
[9] Marrero, O. (1983): The performance of several statistical test for seasonality in Monthly data. – J. Statist Comput Simul 17: 275-296.
[10] McNally, R. J., Eden, T. O. (2004): An infectious aetiology for childhood acute leukaemia: a review of the evidence. – Br J Haematol. 127: 243-263.
[11] Nyári, T. A., Kajtár, P., Bartyik, K., Thurzó, L., McNally, R., Parker, L. (2008): Seasonal variation of childhood acute lymphoblastic leukaemia is different between girls and boys.
– Pathol Oncol Res 14: 423-428.
[12] Nyári, C., Nyári, T. A., McNally, R. J. (2015): Trends in infant mortality rates in Hungary between 1963 and 2012. – Acta Paediatr 104: 473-478.
[13] Roger, J. H. (1977): Significance test for cyclic trends in incidence data. – Biometrika 64:
152-155.
[14] Rothman, K. J. (2008): Episheet. – http://krothman.hostbyet2.com/Episheet.xls (accessed:
25 October 2018).
[15] Stolwijk, A. M., Straatman, H., Zielhuis, G. A. (1999): Studying seasonality by using sine and cosine functions in regression analysis. – J Epidemiol Community Health 53: 235- 238.
[16] Walter, S. D. (1977): The power of a test for seasonality. – Br J PrevSoc Med 31: 137- 140.
[17] Walter, S. D., Elwood, J. M. (1975): A test for seasonality of events with a variable population at risk. – Br J PrevSoc Med 29: 18-21.