PRIMARY RESEARCH
Characterisation of bioenergetic
pathways and related regulators by multiple assays in human tumour cells
A. Jeney1†, Z. Hujber1†, N. Szoboszlai2, A. Fullár1, J. Oláh1, É. Pap3, Á. Márk1, Cs. Kriston1, J. Kralovánszky3, I. Kovalszky1, K. Vékey4 and A. Sebestyén1,5*
Abstract
Background: Alterations in cellular metabolism are considered as hallmarks of cancers, however, to recognize these alterations and understand their mechanisms appropriate techniques are required. Our hypothesis was to determine whether dominant bioenergetic mechanism may be estimated by comparing the substrate utilisation with different methods to detect the labelled carbon incorporation and their application in tumour cells.
Methods: To define the bioenergetic pathways different metabolic tests were applied: (a) measuring CO2 production from [1-14C]-glucose and [1-14C]-acetate; (b) studying the effect of glucose and acetate on adenylate energy charge;
(c) analysing glycolytic and TCA cycle metabolites and the number of incorporated 13C atoms after [U-13C]-glucose/
[2-13C]-acetate labelling. Based on [1-14C]-substrate oxidation two selected cell lines out of seven were analysed in details, in which the highest difference was detected at their substrate utilization. To elucidate the relevance of metabolic characterisation the expression of certain regulatory factors, bioenergetic enzymes, mammalian target of rapamycin (mTOR) complexes (C1/C2) and related targets as important elements at the crossroad of cellular signalling network were also investigated.
Results: Both [U-13C]-glucose and [1-14C]-substrate labelling indicated high glycolytic capacity of tumour cells. How- ever, the ratio of certain 13C-labelled metabolites showed detailed metabolic differences in the two selected cell lines in further characterisation. The detected differences of GAPDH, β-F1-ATP-ase expression and adenylate energy charge in HT-1080 and ZR-75.1 tumour cells also confirmed the altered metabolism. Moreover, the highly limited labelling of citrate by [2-13C]-acetate—representing a novel functional test in malignant cells—confirmed the defect of TCA cycle of HT-1080 in contrast to ZR-75.1 cells. Noteworthy, the impaired TCA cycle in HT-1080 cells were associated with high mTORC1 activity, negligible protein level and activity of mTORC2, high expression of interleukin-1β, interleukin-6 and heme oxygenase-1 which may contribute to the compensatory mechanism of TCA deficiency.
Conclusions: The applied methods of energy substrate utilisation and other measurements represent simple assay system using 13C-acetate and glucose to recognize dominant bioenergetic pathways in tumour cells. These may offer a possibility to characterise metabolic subtypes of human tumours and provide guidelines to find biomarkers for prediction and development of new metabolism related targets in personalized therapy.
Keywords: Bioenergetic signature, Metabolic characterisation, Energy metabolism, Glucose/acetate utilization, GAPDH/β-F1-ATPase expression, TCA impairment, mTOR
© 2016 Jeney et al. This article is distributed under the terms of the Creative Commons Attribution 4.0 International License (http://creativecommons.org/licenses/by/4.0/), which permits unrestricted use, distribution, and reproduction in any medium, provided you give appropriate credit to the original author(s) and the source, provide a link to the Creative Commons license, and indicate if changes were made. The Creative Commons Public Domain Dedication waiver (http://creativecommons.org/
publicdomain/zero/1.0/) applies to the data made available in this article, unless otherwise stated.
Open Access
*Correspondence: anna@korb1.sote.hu
†A. Jeney and Z. Hujber contributed equally to the manuscript
5 Tumour progression Research Group of Joint Research Organization of Hungarian Academy of Sciences, Semmelweis University, Budapest, Hungary
Full list of author information is available at the end of the article
Background
Following the discovery by Otto Warburg high glucose uptake and lactate production—even in the presence of oxygen—have been documented in nearly all tumours [1, 2]. The glycolytic phenotype was interpreted as a response to damaged cellular respiration to satisfy the ATP demand of the tumours [3, 4]. However, recently numerous studies have showed that ATP production in tumours could be related to both glycolysis and mito- chondrion despite of the defected oxidative phosphoryla- tion [4–6]. These intriguing findings received support by demonstrating multiple auxiliary processes for ATP syn- thesis [6–8].
However, the relative contribution of glycolysis and TCA cycle in ATP production is rather variable in dif- ferent tumours during progression [4, 5] because the metabolic profile of the tumours depends on both the changes in malignant cells and on the microenvironment [9]. The survival of tumour cells in unfavourable condi- tions may be attributed to the reprogramming of the metabolism, as a crucial hallmark of the malignant cells [8]. Thus changes of tumour metabolism require indi- vidual and regular monitoring. To define the dominant bioenergetic pathway as bioenergetic signature based on the ratio of metabolic markers of glycolysis and mito- chondrial respiration has been reported previously [10].
In the present study the bioenergetic signature was esti- mated by comparing the utilization of glucose and ace- tate in multiple assays. As acetate is mainly metabolized in TCA cycle contrary to glucose acetate labels only TCA cycle. [11, 12]. Therefore, the comparison of acetate and glucose utilization can be useful to decide the dominant bioenergetic process. Since metabolic reprogramming is directed through regulatory factors it has been suggested that the relevant regulatory mechanisms should also be taken into account [13]. Hence the used complex multi- ple assay system includes measurements and analysis on substrate utilization and certain related enzymes as the following: (a) measurements on CO2 production derived from [1-14C]-glucose and [1-14C]-acetate; (b) estimation of adenylate energy charge in the presence and absence of glucose and acetate [14]; (c) analyse the expression of metabolic enzymes (G6PDH, GAPDH, β-F1-ATPase); (d) use of stable isotope-mass spectrometric technique to compare glycolysis and TCA cycle activity after labelling tumour cells with [U-13C]-glucose or [2-13C]-acetate; (e) test the TCA cycle function by measuring the number of
13C-carbons in citrate, derived from [2-13C]-acetate;.
To gain an insight into the regulation of the aberrant bioenergetic phenotype the expression of mTOR com- plex 1 and 2 (mammalian target of rapamycin) and of their activity related proteins [15, 16], heme-oxigenase-1
(HO-1) [17] and the proinflammatory interleukins (IL- 1β), IL-6, IL-8)) [18, 19] were examined in tumour cell cultures. In contrast to the traditional 14C-substrate labelling method, applying the combination of complex assays and measurements help to map the correlations and allow to get more information about the highly dif- ferent metabolic and regulatory characteristics of cell lines—as it was observed in the two selected cell lines in which the highest difference was detected at their sub- strate utilization.
Methods
All materials were purchased from Sigma-Aldrich, except where indicated in the text. HT-1080 (human fibrosar- coma) and ZR-75.1 (human mammary adenocarcinoma) cell lines were selected for detailed characterisation from other human cells (MDA-MB231, BT747—breast and HepG2—hepatocellular carcinoma; Oscort—osteo- sarcoma, U937—histiocytic lymphoma, isolated fibro- blasts) based on their different energy substrate oxidizing capacities.
To obtain subconfluent cultures 5 × 10⁵ HT-1080 and 106 ZR-75.1 cells were seeded in 10 ml RPMI1640 medium with 10 % fetal bovine serum (FBS), 100 IU peni- cillin and 50 µg/ml streptomycin. In metabolic experi- ments the medium was replaced by energy substrate-free D5030 medium. All experiments were performed with previously established in vitro cell lines which are not requiring special ethical approvals, The Institutional Tis- sue- and Cell Culture Laboratory has official permission.
Measurement of energy‑substrate oxidation
Cultures were incubated at 37 °C placed in an air-flow chamber and perfused with CO2 free air. Cells were labelled with 0.2 µCi/ml [1-14C]-glucose (specific activ- ity 55 mCi/mmol) or [1-14C]-acetate (specific activity 57 mCi/mmol (Institute of Isotope-Zrt. Budapest) for 1 h. The CO2 released by the cells was trapped on solid alkaline adsorbent, attached to the air-flow chamber and its radioactivity measured with Geiger–Müller counter.
Expression of mRNA
Total RNAs were isolated with Trizol (Invitrogen).
Reverse transcription and real time PCR were performed following the instructions of the manufacturer (M-MLV Reverse Transcriptase kit—Invitrogen; ABI power SYBR® Green PCR Master mix and ABI Prism 7000 Sequence Detection System—Applied Biosystems). PCR primers are summarized in Supplementary Table (ST1). Results were obtained as threshold cycle (CT) values. Expression levels were calculated by using the 2−ΔCT method and β-actin for normalization as reported previously.
Expression analysis of mTOR complex related proteins, certain metabolic enzymes and inflammatory cytokines at protein level
Proteins extracted from cells were quantitated using Quant-iT protein assay (Invitrogen), separated by SDS- PAGE. Proteins transferred to PVDF membrane were incubated with the following reagents: anti-phospho- mTOR (Ser2448), anti-phospho-S6 (Ser 235/236), anti- Rictor (Cell Signaling Technologies) and anti-β-actin (Sigma-Aldrich), anti-GLUT1 (Abcam), anti-β-F1- ATPase (anti-ATPB Abcam), anti-GAPDH (Serotec), anti-pan-Akt (Cell Signaling Technologies), anti-phos- pho-(Ser473)-Akt 1 (Abcam) finally with biotinylated secondary antibodies, avidin-HRP complex (Vectastain Elite ABC Kit, Vector) and enhanced chemiluminescence technique (Pierce ECL Western Blotting Substrate).
The concentrations of extra- and intracellular cytokines were determined by cytokine bead assay (CBA immu- noassay) were measured by flow cytometry. The assay was carried out using the CBA Human Soluble Protein Master Buffer Kit (BD Biosciences, San Jose, CA, USA;
558264) and CBA Human IL-8 (558277), IL-6 (558276) and IL-1β (558279) Flex Sets (BD Biosciences) accord- ing to the manufacturer’s instructions. The samples were acquired on FACSCalibur (BD Biosciences) and analysed by FCAP Array software (BD Biosciences).
Stable isotope‑mass spectroscopic detection of metabolites
Cells incubated in D5030 medium for one hour were labelled with 10 mM [U- 13C]-glucose or [2-13C]-acetate (Cambridge Isotope Laboratories, Andover, MA, USA).
The key metabolites of the glycolytic and TCA cycle pathways were extracted and analysed by applying liquid chromatography–mass spectrometry (LC–MS) based on the protocol described previously [20, 21].
Determination of adenylate energy charge
To evaluate the distinct contributions of glucose and ace- tate on the level of adenylate energy charge (AEC) ATP, ADP and AMP were determined in starving cell cultures.
To this end the RPMI1640 medium was replaced by the energy substrate deprived medium (D5030) and the cul- tures were divided into three groups as follows: (a) sup- plemented with 10 mM glucose, (b) supplemented with 10 mM acetate, (c) kept in starving conditions. Adenylate nucleotides were extracted from the cells with methanol- acetic acid (9:1) were separated by isocratic elution using Aquasil C18 column principally as reported previously [22] and analysed by applying LKB PE NELSON 3000 interface (Perkin-Elmer Corporation).
Statistical analysis
The experiments were performed in triplicate with 3–5 parallel samples and the data evaluation was performed using Student’s t test (two-tailed); p < 0.05 was consid- ered statistically significant.
Results
Comparing glucose and acetate oxidation
Comparative measurements of released 14CO2 derived from [1-14C]-glucose and [1-14C]-acetate showed cer- tain noteworthy differences among the investigated tumour cells. The rate of [1-14C]-glucose oxidation was rather similar in the investigated tumour cells, except in HT-1080 cells. On the contrary the release of 14CO2 from [1-14C]-acetate showed great variance especially between the ZR-75.1 and HT-1080 tumour cells (Table 1). The bio- energetic signature calculated from these data indicated that HT-1080,—in contrary to ZR-75.1 cells—preferen- tially oxidize glucose and have modest capacity to oxidize acetate. Hence this opposite preference for energy sub- strate has offered promising model to study bioenergetic mechanism in these tumour cells.
Expression of enzymes related to bioenergetic pathways To clarify the background of this some key enzymes related to energy metabolism were studied in HT-1080 and ZR-75.1. The protein expression of GLUT-1 (glu- cose transporter) showed high level in both cell lines.
However, the differences between HT-1080 and ZR-75.1 in glucose/acetate utilization were supported when mRNA expression of enzymes such as glucose- 6-phosphate-dehydrogenase (G6PDH), glycolytic
Table 1 Oxidation of [1-14C]-glucose and [1-14C]-acetate in human tumour cells measured by the release of 14CO2
Tumour cells incubated nutrient-free medium were labelled for 1 h with 0.2 µCi/
ml [1-14 C]-glucose or [1-14C]-acetate and the released 14CO2 measured. Data from three independent measurements and 3 parallel samples
Cell culture 14CO2 in the cell culture count per 250 s/106 cells [1‑14C]‑glucose (A) [1‑14C]‑Na‑acetate (B) A/B
HT-1080 11334 ± 2202 377 ± 33 30.1
Fibroblast 3973 ± 684 924 ± 243 4.3
MDA-MB231 3360 ± 584 1344 ± 104 2.5
HepG2 3255 ± 1145 2305 ± 378 1.4
BT747 3081 ± 247 2924 ± 227 1.1
Oscort 5336 ± 171 5580 ± 1240 1.0
ZR-75.1 3450 ± 966 8947 ± 1915 0.4
U937 5948 ± 191 15149 ± 3221 0.4
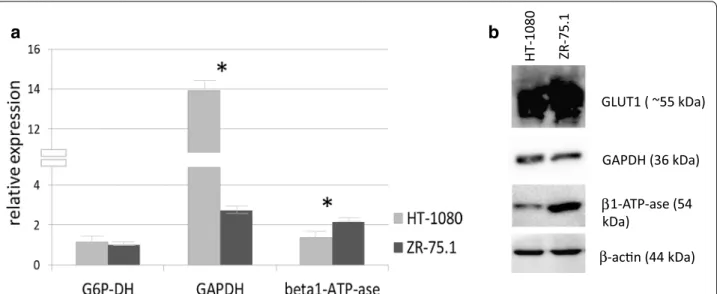
glyceraldehyde-3-phosphate dehydrogenase (GAPDH) and mitochondrial β-F1-ATPase were studied. Higher G6PDH (~20 % higher expression) and significantly higher mRNA expression of GAPDH in HT-1080 than ZR-75.1 cells were detected by real time PCR. At the same time mRNA expression of the β-F1 subunit of the ATP-synthase complex was significantly higher in ZR-75.1. The significant mRNA expression differences were confirmed at GAPDH and β-F1-ATPase protein levels by Western blot analysis, as well. In fact this bio- energetic signature, the GAPDH/β-F1-ATPase ratio, is in harmony with substrate oxidation results and confirms the more extensive glycolytic phenotype in the HT-1080 than in the ZR-75.1 cells (Fig. 1).
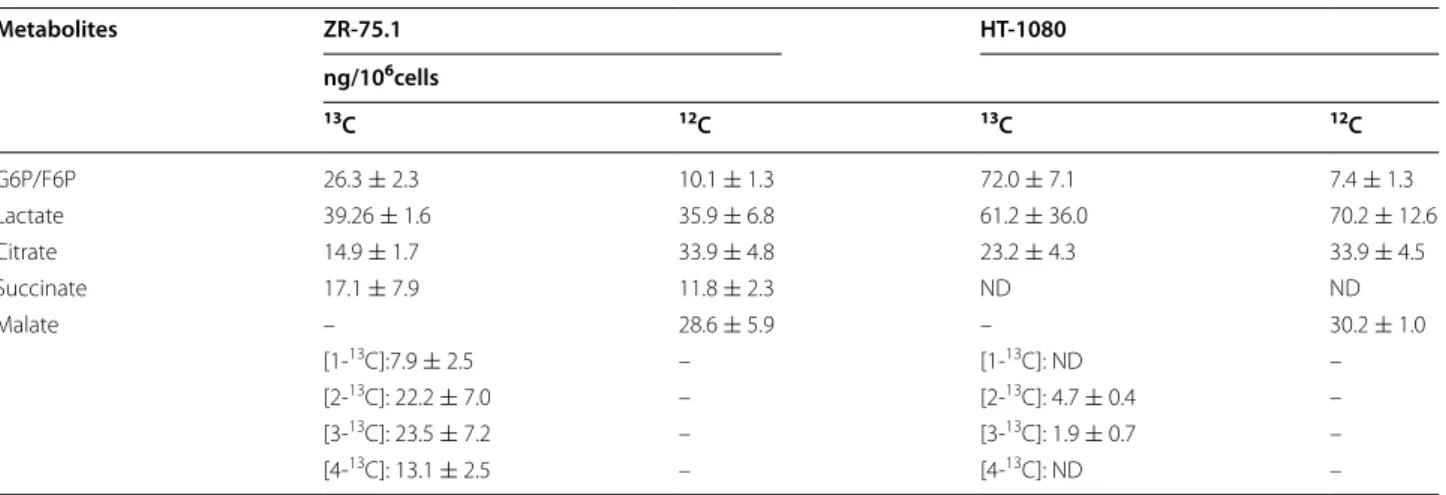
13C‑glucose labelled glycolytic and TCA cycle metabolites Applying [U-13C]-glucose labelling and LC–MS the high- est incorporation of 13C atom among the investigated metabolites was measured in lactate both in HT-1080 and in ZR-75.1, noteworthy, that higher level was found in the former cell line. At the same time there was sig- nificant difference in the labelling of TCA cycle inter- mediates between the two cell lines. In HT-1080 cells [U-13C]-glucose preferentially donated 13C atoms to lactate, G6P and R5P whereas in ZR-75.1 tumour cells malate surpassed the labelling of lactate (Table 2). Thus glucose more extensively fuels TCA cycle in ZR-75.1 than in HT-1080 tumour cells. To study and confirm the importance of the detected distinctions we analysed the metabolic profile of U937 tumour cells, which showed—
similarly to ZR-75.1—a relative low glucose oxidizing
ability (Table 1). 1-14C labelling in glucose/acetate 0.4).
The incorporation of 13C-carbon from U-13C-glucose showed similarity to ZR-75.1 cells. The ratio of labelled metabolites (13C-malate/lactate) in U937 was as low as in ZR-75.1 and significantly lower than in HT-1080 (13C-malate/lactate ratio- ZR-75.1: 0.87 and U937: 1.17, however, HT-1080: 13.74). Hence the difference in the activity of glycolysis and mitochondrial respiration may be expressed quantitatively by dividing labelled lactate and malate as bioenergetic signature.
Testing the function of TCA cycle
As it has been reported that in the mitochondria the second carbon of acetyl-CoA remains in the TCA cycle through several cycling therefore labelling with [2-13C]- acetate results increasing number of 13C-atoms in citrate.
Consequently the enrichment of 13C-atoms in citrate represents the intact function of TCA cycle. Applying [2-13C]-acetate labelling and analysing the ratio of the unlabelled and labelled, especially the multiple labelled citrate in our samples could indicate the activity of TCA cycle and allow to investigate the cellular TCA capacity deeply and showed the metabolic differences between the two cell lines. In the present study citrates with multiple
13C atoms (1–6 number of 13C atoms) suggest intact TCA cycle in ZR-75.1, whereas the low number (maximum two) of 13C atoms in citrate indicates impaired TCA cycle in HT-1080 tumour cells (Fig. 2). We measured the capacity of TCA cycle in U937 to find correlation in surpassed 13C labelling into citrate to ZR-75.1 based on their previously found similarities (Table 1; “13C-glucose
HT-1080 ZR-75.1
GLUT1 ( ~55 kDa)
1-ATP-ase (54 kDa)
GAPDH (36 kDa)
β β
-acn (44 kDa)
a b
Fig. 1 Different expression of certain enzymes related to bioenergetic mechanism at mRNA and protein levels. a G6P-DH, GAPDH, β-F1-ATP-ase (beta1-ATP-ase) mRNA expression differences in HT-1080 and ZR-75.1 cells measured by real time PCR (the results as relative expression to β-actin was calculated from threshold cycle values (ΔCT method) of two independent isolation with 3-3 parallels, *- significant). b GLUT1, GAPDH, β-F1-ATP- ase (beta1-ATP-ase), β-actin protein expression detected by Western blot in HT-1080 and ZR-75.1 cells
labelled glycolytic and TCA cycle metabolites” section).
The results - the intensively incorporated 13C into citrate (1-5 number of 13C atoms)—could also confirm the meta- bolic similarities between ZR-75.1 and U937 (unlabelled citrate 11 %; labelled 1C—19 %, 2C—24 %, 3C—24 %, 4C—19 %, 5C—3 %).
Effect of glucose and acetate on adenylate energy charge (AEC)
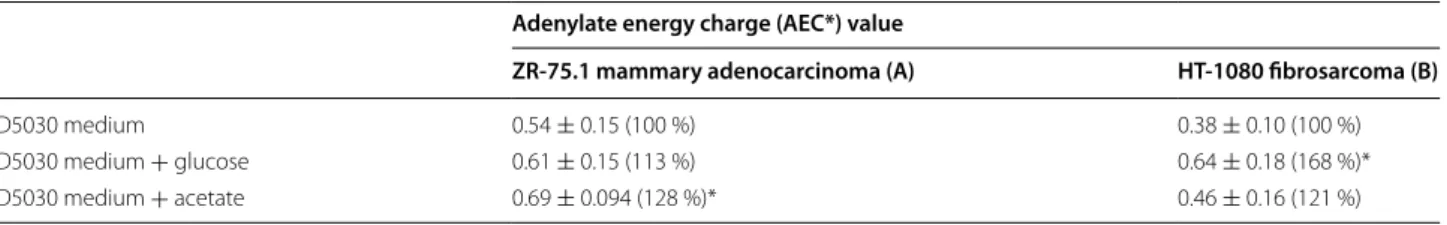
Demonstrating the intact and impaired TCA cycle in ZR-75.1 and HT-1080 tumour cells respectively we focused our interest on the energy level of these cells in the absence and presence of glucose or acetate. The AEC values of HT-1080 and ZR-75.1 cells were rather similar in nutrient rich medium (0.75–0.85) but decreased in the
absence of energy substrates (i.e. in D5030 medium), in fact more extensively in HT-1080 cells. However, supply- ing glucose but not acetate to the starving HT-1080 cells elevation of the AEC value could be achieved. On the contrary in ZR-75.1 cells both acetate and glucose were similarly effective in the restoration of the AEC value.
Thus this experimental setting provided further data for more efficient utilization of glucose over acetate by HT-1080 cells (Table 3).
Putative modulators of the aberrant bioenergetic pathways
As it has been presumed that reprogramming of bioener- getic mechanisms is controlled by cellular regulation we compared some points of this regulatory network—the expression and/or activity of Akt/mTOR signalling ele- ments, HO-1 and proinflammatory cytokines in HT-1080 and ZR-75.1 tumour cells with the above described dif- ferent metabolic profiles, TCA cycle activity.
HT-1080 cells showed higher mRNA expression of IL-1β and IL-6 by real time PCR. We could confirm these differences at protein level by cytokine bead assay using flow cytometry. IL-1β and IL-6 proteins were undetect- able in ZR-75.1 cells and in their supernatant, as well.
According to our PCR results, high intracellular level of IL-1β (159.2 ± 13.2 ng/106 cells) and lower intracel- lular (81.8 ± 9.5 pg/106 cells) but high extracellular (6.456 ± 0.78 ng/106 cells) level of IL-6 protein were measured in HT-1080. IL-8 —other proinflammatory cytokine—expression was also studied at both mRNA and protein level but such a difference was not detected (IL-8 protein level—7.5 ± 1.3 ng/106 HT-1080 cells;
9.48 ± 1.52 ng/106 ZR-75.1 cells). Moreover, we could detect other interesting differences between these two Table 2 Concentration of glycolytic and TCA cycle metabolites in tumour cells labelled with [U-13C]-glucose
Tumour cell line: ZR-75.1, HT-1080 Culture medium: D5030
Labelling: [U-13 C]-glucose 10 mM for 1 h. Data from three independent measurements and 3 parallel samples
Metabolites ZR‑75.1 HT‑1080
ng/106cells
13C 12C 13C 12C
G6P/F6P 26.3 ± 2.3 10.1 ± 1.3 72.0 ± 7.1 7.4 ± 1.3
Lactate 39.26 ± 1.6 35.9 ± 6.8 61.2 ± 36.0 70.2 ± 12.6
Citrate 14.9 ± 1.7 33.9 ± 4.8 23.2 ± 4.3 33.9 ± 4.5
Succinate 17.1 ± 7.9 11.8 ± 2.3 ND ND
Malate – 28.6 ± 5.9 – 30.2 ± 1.0
[1-13C]:7.9 ± 2.5 – [1-13C]: ND –
[2-13C]: 22.2 ± 7.0 – [2-13C]: 4.7 ± 0.4 –
[3-13C]: 23.5 ± 7.2 – [3-13C]: 1.9 ± 0.7 –
[4-13C]: 13.1 ± 2.5 – [4-13C]: ND –
18%
67%
16%
22%
17%
11%
23%
21%
1%4%
0%
10%
20%
30%
40%
50%
60%
70%
80%
90%
100%
ZR-75.1 HT-1080
Total citratepool 6 C labelled
5 C labelled 4 C labelled 3 C labelled 2 C labelled 1 C labelled unlabelled
Fig. 2 Differences in the number of 13C atoms of citrate in ZR-75.1 and HT-1080 tumour cells after 13C acetate labelling (% data were calculated from three independent measurements and 3 parallel samples)
cells in HO-1 expression level, HT-1080 cells showed higher (more than 15×) mRNA expression than ZR-75.1 cells.
The further interest focused on mTOR as an impor- tant central signalling integrator in regulation of protein synthesis and bioenergetic mechanism. The two mTOR complexes (C1 and C2) represent distinct regulatory signals. In this respect it is noteworthy that different metabolic profiles of the two investigated cells could be associated to distinct expression patterns of mTOR com- plexes. As Fig. 3 shows HT-1080 cells expressed prefer- entially mTORC1 activity (represented by high p-mTOR and p-S6—with relative no/low Rictor expression). At the same time in the ZR-75.1 cells showed high p-mTOR with lower p-S6 and higher Rictor level as a sign of potential high mTORC2 expression and activity. Related to mTOR complexes the amount of Akt protein detected by pan–Akt antibody was similar in both cell lines, but higher level of phosphorylated Ser473 form correlates to the higher mTORC2 complex activity and functioning TCA cycle of the ZR-75.1 cells (Fig. 3).
Discussion
The accumulated evidences on the glycolytic phenotype and repressed mitochondrial function as contributors of tumour progression have initiated attempts to intro- duce simple but relevant assays to characterise the bio- energetic profile of human tumour samples [23–25]. The majority of studies in this area involves measurements of labelled intermediates in the bioenergetic pathways using radioactive or stabile isotope substrates [21, 25, 26] and different detecting instruments, which represent a great challenge.
Glucose and glutamine are considered the basic and indispensable nutrients subsequently they are the most widely used energetic substrates in metabolic analysis of tumour cells. It has been assumed that using two sub- strates would provide more information about the rela- tive capacity of glycolysis and TCA cycle than either one alone. As the catabolic product of fatty acid oxidation acetate is channelled toward TCA cycle it appeared to
be an ideal complementary energetic substrate beside glucose [27, 28]. Thus acetate can fuel exclusively mito- chondrial respiration therefore it is a promising way to detect the bioenergetic mechanism. Some recently pub- lished new studies from clinical samples using NMR illustrated that especially acetate could be energy sub- strate of glioblastomas and brain metastases [29]. In our study we compared acetate and glucose labelling in the substrate oxidation and in the intracellular metabolite concentration analysis by LC–MS. Our results show Table 3 Elevation of adenylate energy charge (AEC) by glucose and acetate in starving tumour cell cultures
AEC= ATP+1/2ADP ATP+ADP+AMP
Data from three independent measurements and 3 parallel samples
* p < 0.05
Adenylate energy charge (AEC*) value
ZR‑75.1 mammary adenocarcinoma (A) HT‑1080 fibrosarcoma (B)
D5030 medium 0.54 ± 0.15 (100 %) 0.38 ± 0.10 (100 %)
D5030 medium + glucose 0.61 ± 0.15 (113 %) 0.64 ± 0.18 (168 %)*
D5030 medium + acetate 0.69 ± 0.094 (128 %)* 0.46 ± 0.16 (121 %)
p-S6 (32 kDa)
-acn (42 kDa) p-mTOR (289 kDa)
HT-108 0 ZR-75. 1
Akt ( ~56-60 kDa)
p-(ser-473)-Akt ( 56 kDa) Rictor (~200 kDa)
Fig. 3 Different expression of mTOR activity related proteins and Akt in HT-1080 and ZR-75.1 cells. phospho-mTOR (p-mTOR—the active mTOR kinase), phospho-S6 (p-S6—mTORC1 activity related phospho- protein), Rictor (mTORC2 specific protein), Akt and anti-phospho- (Ser473)-Akt expression in HT-1080 and ZR-75.1 cells detected by Western blot. The higher amount of p-S6 with low Rictor expression in HT-1080 suggest that mTORC1 activity is high in HT-1080 and lower in ZR-75.1 cells. mTOR activity could be released mainly in mTORC2 complex in ZR-75.1 cells (low level of p-S6 and high level of Rictor and phospho-(Ser473)-Akt)
that using two substrates such as glucose and acetate has more advantage to get detailed information about the relative capacity of glycolysis and TCA cycle. More- over, our novel evaluation from LC–MS analysis after
13C-acetate labelling is capable for highlighting the impairment of TCA cycle in tumour cells. To under- line the importance of this metabolic profile analysis we demonstrated some points of the potential regulatory background in the two studied cells, which correlate well to the alterations in bioenergetic phenotype of the cells.
The radioactive technology has still an important role in metabolic investigations including released 14CO2 measuring, detecting the oxidation of energy substrates offer a simple and cost-effective assay to estimate the dominant bioenergetic mechanism. Applying LC–MS technique with [U-13C]-glucose and [2-13C]-acetate to investigate tumour specific bioenergetic profile, we dem- onstrated that the highest level of the incorporated 13C atoms derived from [13C]-glucose into lactate both in HT-1080 and in ZR-75.1 tumour cells correlates to the other results related to high glucose oxidation and AEC measurement. The LC–MS technique allowed to raise the question whether an identical metabolic phenotype may also be recognized by measuring the unlabelled metabo- lites which could be interesting in future metabolic analy- sis of tumour samples. This may have special interest. We found that the unlabelled lactate also reflects to the dif- ferences in the glycolytic activity of the two investigated tumours in vitro. However, it should be considered that for example lactate production in tumour cells in vivo is not exclusively derived from actual glycolytic flux (e.g.
uptake from microenvironment). The low number of 13C atoms in malate and citrate after labelling with [U-13C]- glucose or [2-13C]-acetate respectively may suggest that TCA cycle is less effective (as we detected in HT-1080 in contrast to ZR-75.1 cells). This provides example for detectable relative dominance of the bioenergetic path- ways in tumour cells. The remarkably high unlabelled malate concentration may suggest the function of the anaplerotic route to replenish TCA cycle.
Elevated lactate and reduced concentration of TCA cycle metabolites were described in certain human tumour samples and in patients’ body fluids [30–32] by metabolomics mainly with GC or LC–MS, NMR, but other analytical methods have been developing further.
However, there is still no consensual advice in using the analytical techniques to measure metabolic profile of tumour samples (certainly these assays are expensive, time-consuming and need large sample size). In our assays we did not measured the complete metabolite- profile, we only measured and evaluated selected metab- olites (G6P, R5P, lactate, citrate, malate, succinate). In
that way we could rationalize our sources, we could save time, instrumental capacity and we optimised the sensi- tivity and apply this methods for smaller sample size. The latter was performed after not only glucose but acetate labelling, as well—the metabolism of malignant cells have not been investigated previously in that way in compari- son of acetate and glucose consumption. Upon studying the distribution of 13C-carbon, derived from [13C-U]- glucose, between glycolytic and TCA cycle intermediates high lactate and low malate labelling indicated glyco- lytic phenotype and impaired TCA cycle in the HT-1080 tumour cells, but not in the ZR-75.1 cells. Moreover, the highly limited labelling of citrate by [2-13C]-acetate—rep- resenting a novel functional test—confirmed the above detected defect in TCA cycle of HT-1080 tumour cells.
Consequently glucose and acetate differently elevate the reduced level of adenylate energy charge depending on the dominant bioenergetic mechanism.
An other suggestion comparing the expression of glyc- eraldehyde-3-phosphate dehydrogenase (GAPDH) and β-F1-ATPase an inverse relationship could be concluded between glycolysis and mitochondrial respiration in vari- ous human tumour tissues. In fact it was proposed that β-F1-ATPase could be used for monitoring progression of breast cancer [10, 31]. We could confirm this and we can also suggest GAPDH/β-F1-ATPase expression stud- ies in tumour tissue samples by immunohistochemistry based on our Western blot results and its harmony with the metabolic characterisation data.
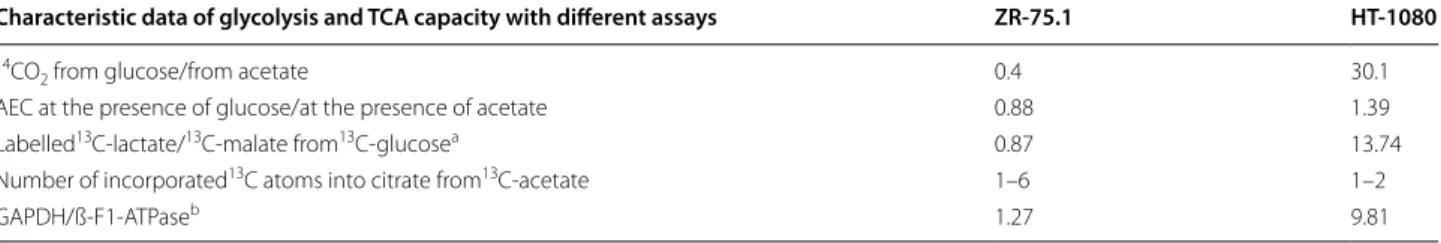
Evaluating our results from different measurements in HT-1080 and ZR-75.1 cells we could summarise that assays–measuring: (a) 14CO2 from glucose/14CO2 from acetate ratio; (b) AEC at the presence of glucose/AEC at the presence of acetate ratio; (c) lactate/malate from
13C-glucose labelling; d. the number of incorporated
13C into citrate from 13C-acetate and e. the GAPDH/β- F1-ATPase expression (summarized in Table 4)—could indicate the metabolic differences at distinct level. From these assays, especially from analysis of the selected metabolites (G6P, R5P, lactate, citrate, malate, succinate) by LC–MS after 13C-glucose and acetate labelling we could conclude the condition of mitochondrial function and TCA cycle capacity (impaired TCA or potentially functioning one in HT-1080 or ZR-75.1 respectively) beside the admitted high glycolytic activity.
Our experimental results allowed to find some correla- tions of certain regulatory factors and the effected bioen- ergetic pathways or invasive growth in HT-1080 contrary to ZR-75.1 (harbouring less metastatic potential) tumour cells [33]. This expectation was met when high expression of proinflammatory interleukins and HO-1 were detected in the TCA cycle impaired and metastatic HT-1080 cells compared with the non-metastatic ZR-75.1 cells. It was
reported that IL-1β and IL-6 stimulate glucose metabo- lism and promote tumour progression [16]. The high expression of HO-1 in HT-1080 cells deserves special attention as recent studies documented the stimulation of invasive growth and metastatic behaviour associated with high expression of HO-1 in lung cancers (NSCLCs) [17, 34].
At present we may speculate on the possibility that activated rescue mechanism related to HO-1 in TCA cycle impaired HT-1080 tumour cells may enable mito- chondrial ATP synthesis through a potential alternative HO-1 dependent way as previously reported in fuma- rate hydratase 1 deleted kidney cells especially in kidney tumour cells [6].
To study mTOR signalling—which has well docu- mented role in the regulation of metabolic and sur- vival functions—we compared the expression of related phospho-proteins and Rictor in HT-1080 and ZR-75.1 cells [35]. It is well known that malignant transforma- tion is often accompanied by deregulated mTOR activity (mainly higher mTOR activity status) which helps to syn- thesise and activate the elements/proteins of the cellular apparatus of altered phenotype [36]. The high mTOR activity is providing the enzymatic background for gly- colysis, pentose-phosphate pathway and glutaminoly- sis, moreover the HIF1α production [35, 36]. Present study contributed fascinating data to the distinct func- tion of two mTOR complexes in terms of bioenergetic regulation. The high glycolytic activity with impaired TCA cycle in HT-1080 cells was accompanied by domi- nant mTORC1 activity, which is in harmony with the reported mTORC1 activity related promotion of gly- colysis and the detected GLUT-1 and HIF1α expres- sion. These correlate to the previously described HIF1α expression in HT-1080 and ZR-75.1 at normal condi- tion which could be induced further in hypoxia [37, 38].
On the other hand mTORC2 is rather closely related to oxidative phosphorylation as it is localized in the endo- plasmic reticulum sub-compartment which is bound to mitochondria [39, 40]. In this respect it is noteworthy,
that expression of mTORC2 complex related Rictor pro- tein was dominant and the related high amount of p-Akt was also detected in ZR-75.1 tumour cells bearing intact TCA cycle. However, the glycolytic capacity and the related GLUT-1 expression, glucose consumption are also not negligible in ZR-75.1 cells.
Conclusion
In summary, the present study demonstrated the fea- sibility of novel and cost-effective assays to define the bioenergetic signature based on the comparison of the cellular utilisation of acetate and glucose and to study further specific elements in the regulation of the ener- getic homeostasis of the cells. The feasibility of this complex energetic profiling assay system (applying mini- mum two labelling substrates—13C glucose and acetate in the measurements of selected metabolites and their ratio and evaluating the number of incorporated 13C atoms into certain metabolites—for example into citrate) could define the bioenergetic signature of tumour cells.
Moreover, the applied experimental setting provided fur- ther evidence for the relationship between the altered phenotype and the impaired/functioning TCA cycle in HT-1080/ZR-75.1 cells. Furthermore the presented complex test system correlated well with the found regu- latory differences at protein level—such as mTOR com- plexes, G6PDH, GAPDH, GLUT-1, β-F1-ATP-ase, HO-1, IL-1ß, IL-6—, and with substrate oxidation/AEC results (Table 4). Based on our observations the presented assays may offer a possibility to characterise metabolic subtypes of human tumours and provide guidelines to find bio- markers for prediction and development of new metabo- lism related targets in personalized therapy.
Abbreviations
AEC: adenylate energy charge; CT: threshold cycle; ECL: enhanced chemilumi- nescence; G6PDH: glucose-6-phosphate dehydrogenase; GAPDH: glyceral- dehyde-3-phosphate dehydrogenase; LC–MS: liquid chormatography–mass spectrometry; HO: heme oxygenase; HRP: horseradish peroxydase; mTOR:
mammalian target of rapamycin; mTORC: mTOR complex; p-mTOR: phospho- mTOR; pS6: phospho-S6; TCA: trycarboxylic acid.
Table 4 Bioenergetic signature based on the utilization of glucose and acetate in various assays
Summarised data calculated from the results of different assays
a The ratio was calculated from molar values
b mRNA expression level normalized to β-actin
Characteristic data of glycolysis and TCA capacity with different assays ZR‑75.1 HT‑1080
14CO2 from glucose/from acetate 0.4 30.1
AEC at the presence of glucose/at the presence of acetate 0.88 1.39
Labelled13C-lactate/13C-malate from13C-glucosea 0.87 13.74
Number of incorporated13C atoms into citrate from13C-acetate 1–6 1–2
GAPDH/ß-F1-ATPaseb 1.27 9.81
Authors’ contributions
AJ designed, coordinated the study and measured the oxidation of the
14C-labelled acetate and glucose jointly with JO. Incorporation of 13C-labelled glucose and acetate into metabolites was measured by ZH applying LC-MS spectrometric technique supervised by NS and KV. AS examined the expres- sion of mTOR related and other proteins jointly with AM and ZH using Western-blot. The adenylate-nucleotide charge was investigated by JK and EP by using HPLC analysis to separate the adenylate nucleotides. AF supervised by IK measured mRNA expression by using real time PCR. CsK measured the extra- and intracellular cytokine expression by flow cytometry. The manuscript was prepared by AS with AJ and ZH for publication. A. Jeney and Z. Hujber as co-first authors contributed equally to the manuscript. All authors read and approved the final manuscript.
Author details
1 1st Department of Pathology and Experimental Cancer Research, Semmel- weis University, Üllői út 26, Budapest 1085, Hungary. 2 Laboratory of Envi- ronmental Chemistry and Bioanalytics, Department of Analytical Chemistry, Institute of Chemistry, Eötvös Loránd University, P.O. Box 32, Budapest 1518, Hungary. 3 Department of Clinical Research, National Institute of Oncology, P.O. Box 21, Budapest 1525, Hungary. 4 Research Centre for Natural Sciences of the Hungarian Academy of Sciences, Pusztaszeri u. 59-67, Budapest 1025, Hungary. 5 Tumour progression Research Group of Joint Research Organiza- tion of Hungarian Academy of Sciences, Semmelweis University, Budapest, Hungary.
Acknowledgements
This work was supported by the Institute of Isotope ZRT. (Budapest, Hun- gary) through the grant (GVOP 3.1.1., 2004-05-0175/3.0) from the National Innovation Authority (Hungary) and by OTKA projects (T84262) of Hungarian Academy of Sciences. Research work of A. Sebestyén is supported by Bolyai fellowship of Hungarian Academy of Sciences. We express our thanks to Dr. J.
Dudás for the supply of the primers for the real time PCR experiments.
Competing interests
The authors declare that they have no competing interests.
Received: 8 July 2015 Accepted: 3 February 2016
References
1. Warburg O, Posener K, Negelein E. Ueber den stoffwechsel der tumoren.
Biochem Z. 1924;152:319–44.
2. Koppenol WH, Bounds PL, Dang CV. Otto Warburg’s contributions to current concepts of cancer metabolism. Nat Rev Cancer. 2011;11:325–37.
doi:10.1038/nrc3038.
3. Vazquez A, Liu J, Zhou Y, Oltvai ZN. Catabolic efficiency of aerobic glycolysis: the Warburg effect revisited. BMC Syst Biol. 2010;4:58.
doi:10.1186/1752-0509-4-58.
4. Zheng J. Energy metabolism of cancer: glycolysis versus oxidative phos- phorylation (Review). Oncol Lett. 2012;4:1151–7.
5. Guppy M, Leedman P, Zu X, Russell V. Contribution by different fuels and metabolic pathways to the total ATP turnover of proliferating MCF-7 breast cancer cells. Biochem J. 2002;364:309–15.
6. Frezza C, Zheng L, Folger O, Rajagopalan KN, MacKenzie ED, Jerby L, Micaroni M, Chaneton B, Adam J, Hedley A, Kalna G, Tomlinson IP, Pollard PJ, Watson DG, Deberardinis RJ, Shlomi T, Ruppin E, Gottlieb E. Haem oxygenase is synthetically lethal with the tumour suppressor fumarate hydratase. Nature. 2011;477:225–8. doi:10.1038/nature10363.
7. Hirayama A, Kami K, Sugimoto M, Sugawara M, Toki N, Onozuka H, Kinoshita T, Saito N, Ochiai A, Tomita M, Esumi H, Soga T. Quantitative metabolome profiling of colon and stomach cancer microenvironment by capillary electrophoresis time-of-flight mass spectrometry. Cancer Res.
2009;69:4918–25. doi:10.1158/0008-5472.CAN-08-4806.
8. Ward PS, Thompson CB. Metabolic reprogramming: a cancer hall- mark even warburg did not anticipate. Cancer Cell. 2012;21:297–308.
doi:10.1016/j.ccr.2012.02.014.
9. Yuneva MO, Fan TW, Allen TD, Higashi RM, Ferraris DV, Tsukamoto T, Mates JM, Alonso FJ, Wang C, Seo Y, Chen X, Bishop JM. The metabolic profile of tumors depends on both the responsible genetic lesion and tissue type.
Cell Metab. 2012;15:157–70. doi:10.1016/j.cmet.2011.12.015.
10. Cuezva JM, Krajewska M, de Heredia ML, Krajewski S, Santamaria G, Kim H, Zapata JM, Marusawa H, Chamorro M, Reed JC. The bioener- getic signature of cancer: a marker of tumor progression. Cancer Res.
2002;62:6674–81.
11. Klein LJ, Visser FC, Knaapen P, Peters JH, Teule GJ, Visser CA, Lammertsma AA. Carbon-11 acetate as a tracer of myocardial oxygen consumption.
Eur J Nucl Med. 2001;28:651–68.
12. Scott DA, Richardson AD, Filipp FV, Knutzen CA, Chiang GG, Ronai ZA, Osterman AL, Smith JW. Comparative metabolic flux profiling of melanoma cell lines: beyond the Warburg effect. J Biol Chem.
2011;286:42626–34. doi:10.1074/jbc.M111.282046.
13. Moreno-Sanchez R, Marin-Hernandez A, Saavedra E, Pardo JP, Ralph SJ, Rodriguez-Enriquez S. Who controls the ATP supply in cancer cells?
biochemistry lessons to understand cancer energy metabolism. Int J Biochem Cell Biol. 2014;50:10–23.
14. Yang MS, Gupta RC. Determination of energy charge potential in the C6 Glioma and the HepG-2 cell culture. Toxicol Mech Methods. 2003;13:97–
101. doi:10.1080/15376510309843.
15. Morita M, Gravel SP, Chenard V, Sikstrom K, Zheng L, Alain T, Gandin V, Avizonis D, Arguello M, Zakaria C, McLaughlan S, Nouet Y, Pause A, Pollak M, Gottlieb E, Larsson O, St-Pierre J, Topisirovic I, Sonenberg N. mTORC1 controls mitochondrial activity and biogenesis through 4E-BP-dependent translational regulation. Cell Metab. 2013;18:698–711. doi:10.1016/j.
cmet.2013.10.001.
16. Masui K, Cavenee WK, Mischel PS. mTORC2 in the center of cancer metabolic reprogramming. Trends Endocrinol Metab. 2014;25:364–73.
doi:10.1016/j.tem.2014.04.002.
17. Li B, Takeda K, Ishikawa K, Yoshizawa M, Sato M, Shibahara S, Furuyama K. Coordinated expression of 6-phosphofructo-2-kinase/fructose- 2,6-bisphosphatase 4 and heme oxygenase 2: evidence for a regula- tory link between glycolysis and heme catabolism. Tohoku J Exp Med.
2012;228:27–41.
18. Belanger M, Allaman I, Magistretti PJ. Differential effects of pro- and anti-inflammatory cytokines alone or in combinations on the metabolic profile of astrocytes. J Neurochem. 2011;116:564–76.
doi:10.1111/j.1471-4159.2010.07135.x.
19. Singh JK, Simoes BM, Howell SJ, Farnie G, Clarke RB. Recent advances reveal IL-8 signaling as a potential key to targeting breast cancer stem cells. Breast Cancer Res. 2013;15:210.
20. Szoboszlai N, Guo X, Ozohanics O, Olah J, Gomory A, Mihucz VG, Jeney A, Vekey K. Determination of energy metabolites in cancer cells by porous graphitic carbon liquid chromatography electrospray ionization mass spectrometry for the assessment of energy metabolism. Anal Chim Acta.
2014;819:108–15. doi:10.1016/j.aca.2014.01.055.
21. Koubaa M, Cocuron JC, Thomasset B, Alonso AP. Highlighting the tricar- boxylic acid cycle: liquid and gas chromatography-mass spectrometry analyses of 13 C-labeled organic acids. Anal Biochem. 2013;436:151–9.
doi:10.1016/j.ab.2013.01.027.
22. Bhatt DP, Chen X, Geiger JD, Rosenberger TA. A sensitive HPLC-based method to quantify adenine nucleotides in primary astrocyte cell cul- tures. J Chromatogr B Analyt Technol Biomed Life Sci. 2012;889–890:110–
5. doi:10.1016/j.jchromb.2012.02.005.
23. Sanchez-Arago M, Chamorro M, Cuezva JM. Selection of cancer cells with repressed mitochondria triggers colon cancer progression. Carcinogen- esis. 2010;31:567–76. doi:10.1093/carcin/bgq012.
24. Gatenby RA. and Gawlinski ET. The glycolytic phenotype in carcinogen- esis and tumor invasion: insights through mathematical models. Cancer Res. 2003;63:3847-3854.
25. Gupta S, Chawla K. Oncometabolomics in cancer research. Expert Rev Proteomics. 2013;10:325–36. doi:10.1586/14789450.2013.828947.
26. Kubota M, Tsuda T, Minase T, Nakada K, Furudate M. Autoradiographic analysis of [14C]deoxy-d-glucose in thyroid cancer xenografts: a com- parative study with pathologic correlation. Ann Nucl Med. 1994;8:75–83.
27. Corbet C, Feron O. Metabolic and mind shifts: from glucose to glutamine and acetate addictions in cancer. Curr Opin Clin Nutr Metab Care.
2015;18:346–53. doi:10.1097/MCO.0000000000000178.
• We accept pre-submission inquiries
• Our selector tool helps you to find the most relevant journal
• We provide round the clock customer support
• Convenient online submission
• Thorough peer review
• Inclusion in PubMed and all major indexing services
• Maximum visibility for your research Submit your manuscript at
www.biomedcentral.com/submit
Submit your next manuscript to BioMed Central and we will help you at every step:
28. Schug ZT, Peck B, Jones DT, Zhang Q, Grosskurth S, Alam IS, Goodwin LM, Smethurst E, Mason S, Blyth K, McGarry L, James D, Shanks E, Kalna G, Saunders RE, Jiang M, Howell M, Lassailly F, Thin MZ, Spencer-Dene B, Stamp G, van den Broek NJ, Mackay G, Bulusu V, Kamphorst JJ, Tardito S, Strachan D, Harris AL, Aboagye EO, Critchlow SE, Wakelam MJ, Schulze A, Gottlieb E. Acetyl-CoA synthetase 2 promotes acetate utilization and maintains cancer cell growth under metabolic stress. Cancer Cell.
2015;27:57–71. doi:10.1016/j.ccell.2014.12.002.
29. Mashimo T, Pichumani K, Vemireddy V, Hatanpaa KJ, Singh DK, Sirasana- gandla S, Nannepaga S, Piccirillo SG, Kovacs Z, Foong C, Huang Z, Barnett S, Mickey BE, DeBerardinis RJ, Tu BP, Maher EA, Bachoo RM. Acetate is a bioenergetic substrate for human glioblastoma and brain metastases.
Cell. 2014;159:1603–14. doi:10.1016/j.cell.2014.11.025.
30. Spratlin JL, Serkova NJ, Eckhardt SG. Clinical applications of metabolomics in oncology: a review. Clin Cancer Res. 2009;15:431–40. doi:10.1158/1078- 0432.CCR-08-1059.
31. Isidoro A, Casado E, Redondo A, Acebo P, Espinosa E, Alonso AM, Cejas P, Hardisson D, Fresno Vara JA, Belda-Iniesta C, Gonzalez-Baron M, Cuezva JM. Breast carcinomas fulfill the Warburg hypothesis and provide meta- bolic markers of cancer prognosis. Carcinogenesis. 2005;26:2095–104.
32. Abbassi-Ghadi N, Kumar S, Huang J, Goldin R, Takats Z, Hanna GB.
Metabolomic profiling of oesophago-gastric cancer: a systematic review.
Eur J Cancer. 2013;49:3625–37. doi:10.1016/j.ejca.2013.07.004.
33. Peterfia B, Fule T, Baghy K, Szabadkai K, Fullar A, Dobos K, Zong F, Dobra K, Hollosi P, Jeney A, Paku S, Kovalszky I. Syndecan-1 enhances proliferation, migration and metastasis of HT-1080 cells in cooperation with synde- can-2. PLoS ONE. 2012;7:e39474. doi:10.1371/journal.pone.0039474.
34. Tsai JR, Wang HM, Liu PL, Chen YH, Yang MC, Chou SH, Cheng YJ, Yin WH, Hwang JJ, Chong IW. High expression of heme oxygenase-1 is associated with tumor invasiveness and poor clinical outcome in non-small cell lung cancer patients. Cell Oncol (Dordr). 2012;35:461–71. doi:10.1007/
s13402-012-0105-5.
35. Cornu M, Albert V, Hall MN. mTOR in aging, metabolism, and cancer. Curr Opin Genet Dev. 2013;23:53–62. doi:10.1016/j.gde.2012.12.005.
36. Morita M, Gravel SP, Hulea L, Larsson O, Pollak M, St-Pierre J, Topisirovic I.
mTOR coordinates protein synthesis, mitochondrial activity and prolifera- tion. Cell Cycle. 2015;14:473–80. doi:10.4161/15384101.2014.991572.
37. Khan S, Liu S, Stoner M, Safe S. Cobaltous chloride and hypoxia inhibit aryl hydrocarbon receptor-mediated responses in breast cancer cells. Toxicol Appl Pharmacol. 2007;223:28–38.
38. Misra RM, Bajaj MS, Kale VP. Vasculogenic mimicry of HT-1080 tumour cells in vivo: critical role of HIF-1α-neuropilin-1 axis. PLoS ONE.
2012;7:e50153. doi:10.1371/journal.pone.0050153.
39. Laplante M, Sabatini DM. Regulation of mTORC1 and its impact on gene expression at a glance. J Cell Sci. 2013;126:1713–9. doi:10.1242/
jcs.125773.
40. Betz C, Stracka D, Prescianotto-Baschong C, Frieden M, Demaurex N, Hall MN. Feature Article: mTOR complex 2-Akt signaling at mitochondria-asso- ciated endoplasmic reticulum membranes (MAM) regulates mitochon- drial physiology. Proc Natl Acad Sci. 2013;110:12526–34. doi:10.1073/
pnas.1302455110.
![Table 1 Oxidation of [1- 14 C]-glucose and [1- 14 C]-acetate in human tumour cells measured by the release of 14 CO 2](https://thumb-eu.123doks.com/thumbv2/9dokorg/1360531.110770/3.892.456.808.797.995/table-oxidation-glucose-acetate-human-tumour-measured-release.webp)