14
Experimental Techniques
Hans-Ulrich Bergmeyer
1. Handling Biochemical Reagents
a) Storage of biochemical substances and their solutions (3) Control of reagents
y) Laboratory vapours 8) Glassware
z) Interference due to deproteinizing agents 2. Methods of Measurement and Instruments U s e d a) Methods based o n photometric measurements
a) Principle of the photometric determination of concentration (3) Types of instrument and their range of application
y) Measurement of light absorption
8) Special requirements of biochemistry and practical hints z) Measurement o f fluorescence
b) Manometric methods a) Principle p) Practical hints
Y) Manufacturers of apparatus c) Other methods
a) Micromethods P) Thunberg technique
Y) Polarography and polarometry 3. Evaluation of the Experimental Results a) General information
a) Enzyme units and their conversion p) Evaluation of reaction curves Y) Standard curves and standards b) Photometric methods
a) Extinction coefficients and optical density as the basis of calculations p) Evaluation with a non-constant end-point
Y) Sensitivity and accuracy c) Manometric methods
a) Calculation of the results (3) Sensitivity and accuracy
1. Handling Biochemical Reagents
In enzymatic analysis the enzymes are used as analytical reagents. The commonly held view that enzymes are "unstable" only applies to a limited number. Numerous enzymes of high purity are at present available commercially (see p. 967). Their stability is indicated by the fact that it is possible to send these preparations overseas without loss of activity. Enzymes are proteins of high molecular weight which catalyse specific reactions and are therefore more sensitive than other analytical reagents, but with correct handling they are absolutely reliable.
II. Experimental Techniques 15
a) Storage of biochemical substances and their solutions
Elevated temperatures and traces of heavy metals lead to a loss of enzyme activity especially with dilute enzyme solutions. Crystalline enzyme preparations suspended in ammonium sulphate solution should be stored at 2 to 4°C and under these conditions the loss of activity is usually minimal. Freezing of crystalline suspensions of enzymes frequently results in diffi
culty in resuspension of the material, fracture of the crystals and a 20—30% loss of activity.
On the other hand, a few really unstable preparations can only be kept in a deep-freeze.
The information on enzyme stability given in each chapter under " Stability of the Solutions"
should be noted. An indication is also given there about the stability of the other solutions.
The coenzymes DPNH, TPNH and CoA must be protected from light and stored in a desic
cator in the cold. The sulphydryl group of CoA is easily oxidized by atmospheric oxygen.
DPNH stored in the dark is about 10 times more stable (as measured by the change in its optical density at 340 ma) than when stored in indirect sunlight. Storage at room temperature has hardly any effect on DPNH (as measured by the change in optical density at 340 mu), but a considerable reduction in enzyme activity (e.g. with lactic dehydrogenase) is observed when DPNH preparations are used which have not been stored in the cold.
Dry substances which have been stored in a desiccator in the cold will absorb moisture from the air if they are immediately removed from the desiccator at room temperature. If water uptake of hygroscopic substances is to be avoided, the desiccator must be allowed to warm to room temperature before opening. This precaution is especially important in warm weather.
The dilute solutions of coenzymes and substrates are more stable than the more highly dilute enzyme solutions. In any case no solutions should be kept longer than about 10 days (stored in a refrigerator). It is convenient to freeze coenzyme solutions in small portions so as to avoid repeated freezing and thawing. Solutions of DPNH and TPNH are acid labile; even the CO2 content of old distilled water causes breakdown of the coenzymes. These substances should therefore be dissolved in ca. 1 % bicarbonate solution or in a dilute buffer (up to ca. pH 9). DPN and TPN are alkali labile. CoA is most stable around pH 4; ATP around pH 9.
Fig. 1.
Ice bath for biochemical
reagents
16 Section A: General
Buffer and substrate solutions, especially phosphate, amino acid and sugar solutions, are ideal growth media for micro-organisms. They should therefore be stored in thoroughly clean and sterile dark bottles with ground-glass stoppers. To avoid contamination each day's supply of reagent should be obtained by pouring it from the container and not by the use of a pipette.
Because of the high activity of highly purified enzymes only a fraction of a milligram is required to provide excess of enzyme for substrate and coenzyme determinations. Hence the volumes of enzyme suspensions are small. Small containers should always be stored stoppered to avoid losses due to crystallization on the walls of the containers.
For the busy laboratory it is recommended that the solutions should be stored on the bench in an ice bath during working hours so that they are readily available (Fig. 1). Insulated plastic containers holding racks to take about 20 tubes of various sizes are available commer
cially *).
(3) Control of reagents
Before starting a large series of measurements it is recommended that the activity of the enzymes used and the concentration of the coenzyme and substrate solutions be checked.
A test of a complete assay system in which a constant end-point is obtained can best be made on completion of the reaction by the addition of a trace of the pure substance which is being assayed to the cuvette. A renewed reaction should occur immediately.
y) Laboratory vapours
All reagents required for assays, including stock buffer solutions and doubly distilled water, should be kept covered. Enzymatic methods are very sensitive. For example, in the deter
mination of alcohol, traces of alcohol absorbed by the reagents from the laboratory at
mosphere lead to greatly increased blank values.
8) Glassware
All pipettes, flasks and tubes used for enzymatic analysis should be thoroughly clean.
After cleaning with chromic acid it is important to remove traces of chromate by carefully rinsing with tap water, distilled water and finally doubly distilled water.
Before using modern surface-active detergents a check should be made to see whether they are inhibitory to the enzymes being used.
Pipettes should be lightly wrapped in filter paper and dried in a drying oven at a moderate temperature.
Pipettes (0.1, 0.2 and 2ml.) in which the graduations do not extend to the tip**) are re
commended for the measurement of enzyme, coenzyme and substrate solutions and also for the preparation of the sample. All pipettes should be calibrated: a separate 0.5 and 1.0 ml. sample of ca. 0.1 M KMnC>4 solution (acidified with H2SO4) is pipetted from an officially calibrated pipette into a 10 ml. volumetric flask, diluted to the mark and the optical density of this solution is measured at 546 mfx. The process is repeated with the pipette to
*> e.g. from Fritz Kniese & Co., Marburg-Marbach, Germany.
**) e.g. from Ludwig Hormuth, Inh. E. W. Vetter, Heidelberg, BluntschlistraBe 4, Germany.
II. Experimental Techniques 17 be calibrated. Any difference in the optical densities corresponds to the difference in the calibration of the two pipettes.
Fig. 2. Pipette tray
Fig. 3 Fig. 4
Fig. 3. A glass or plastic rod flattened at one end for mixing small amounts of solution into assay mixtures.
Fig. 4. Addition of 20 al. of reagent solution to a cuvette.
A pipette tray can be easily made in the laboratory (Fig. 2). The top of a commercial test tube racl^ is cut longitudinally and the two halves are glued or nailed along a board ca.
18 Section A : General
200x300 mm 2
. The place for each pipette can be marked; a strip of adhesive tape suitable for writing on is stuck to the base board.
In general small volumes of enzyme and coenzyme solutions are employed, especially with spectrophotometric assays carried out in cuvettes. To introduce these small volumes into the cuvette and at the same time to obtain rapid mixing a small glass rod is used that has been flattened and bent at one end (Figs. 3 and 4). This is made by flattening the heated end of a glass rod with pliers and then bending slightly. Owing to the ribbing on the jaws of the pliers an imprint is obtained on the surface of the glass which prevents large drops of fluid from flowing off. Volumes of up to about 0.05 ml. (50 (xl.) can be easily pipetted onto the flat end of such a glass rod and mixed into the reaction solution.
To avoid scratching the walls of the cuvette it is better to make the rods from plastic (poly- vinylchloride, Plexiglas or Perspex).
e) Interference due to deproteinizing agents
As all deproteinizing agents are enzyme inhibitors they must be removed as completely as possible after deproteinization. The most suitable deproteinizing agent (with a few excep
tions) is perchloric acid; perchlorate ions can be precipitated as the potassium salt. The precipitation is carried out at room temperature and then the solution is allowed to stand in an ice bath (for at least 10 minutes) to obtain quantitative precipitation. With lengthy centrifuging in the warmth a part of the KCIO4 redissolves, therefore it is preferable to decant off from the precipitate. If heavy metal salts are used for deproteinization then these must be subsequently removed with, for example, hydrogen sulphide and the solution must then be aerated. The most appropriate methods are described in the individual chapters.
2. Methods of Measurement and Instruments Used
The various possibilities for the measurement of reactions catalysed by enzymes have already been mentioned on pages 3 to 13. For practical work it is important to know the ad
vantages and disadvantages, and special details of the apparatus used*>.
a) M e t h o d s b a s e d o n p h o t o m e t r i c m e a s u r e m e n t s
There are three different types of method: 1. Measurement of the light absorption of solutions.
2. Measurement of the light scattering of suspensions (turbidity measurements, nephelo- metry, refer to
1
)). 3. Measurement of the fluorescent light emitted by dissolved substances after excitation of their fluorescence by irradiation with light of a suitable wavelength.
Whereas nephelometry is little used in the field of enzymatic analysis, photometry is the most widely used method of measurement. For its theory, see, for example,
2 K
*) The Bundesanstalt fiir Materialpriifung, Berlin-Dahlem (Germany), has collected and compiled the data for the performance o f the German, and s o m e of the foreign, colorimeters and photo
meters at present available commercially: H. Pohl, Chemiker-Ztg. 79, 401, 471, 551, 629 [1955];
80, 819, 855 [1956]; 81, 785 [1957]; 83, 513 [1959]; 85, 12 [1961].
1) G. Kortiim and M. Kortiim-Seiler in Hoppe-Seyler-Thierfelder: Handbuch der physiologisch- und pathologisch-chemischen Analyse. Springer-Verlag, Heidelberg 1953, Vol. I, p. 435.
2) G. Kortiim: Kolorimetrie, Photometrie und Spektrometrie. 3rd ed., Springer-Verlag, Berlin 1955.
II. Experimental Techniques 19
a) Principle of the photometric determination of concentration
The photometric determination of concentration depends on the fact that the absorption of the light passing through a solution has a definite relationship to the concentration of the solution. The ratio of the intensity of emergent light to incident light I/In (called the trans- mittance) decreases with increasing concentration. The absorption measured as extinction is directly proportional to the concentration. Extinction refers to the fraction of light absorbed and its magnitude depends on the light with which the measurements are made. Often instead of extinction the term optical density is used with respect to the measured compound *>.
The extinction (optical density) is related to the transmittance by the following formula:
Extinction = log = log Io/I 1
transmittance
If the light absorption is measured with a photocell and an ammeter, then the transmittance of the solution is read on the linear graduated scale of the instrument. In addition photo
meters usually have an optical density scale which is graduated logarithmically as is required by the above formula. In the range of low optical densities therefore the graduations are further apart than those for higher optical densities (Fig. 5). This also usually applies to the graduated drum of a compensator.
% Durchlassigkeit —•
0 10 20 30 W 50 £0 70 80 SO WO
^ ' .
!
, ' • ' ^
:
:
~
2
W ' 0.8 0.7 0.6 0.5 0.H- 0.3 0.2 0.1 0
ExtinKtion
Durchlassigkeit = Transmittance Extinktion = Optical density Fig. 5. Spectrophotometer scale
In the first phase of development of optical measurements the intensity of light from two light paths was simply compared by eye. The light path of the solution being measured was altered until it showed the same transmittance as a known standard solution or a standard light-attenuating device was adjusted in a second light path, so that it gave the same light absorption as the unknown solution (principle of compensation).
This technique of measurement lost most of its importance when the photocell was perfected as a photoelectric transformer. Next the photocell was used instead of the eye as the null indicator and the optical compensation principle with mechanical light-attenuating devices (e.g. grey wedge or adjustable diaphragm) was retained.
It then became evident that with good photocells a strict linearity existed over a wide range between the light absorbed and the electric current generated. The compensation of the output of the photocell could therefore be carried out electrically or direct reading instru
ments of high performance could be built. In the first method the precision obtained depends
*) Instead of molar extinction the term absorbancy is widely used.
Table 1. Survey of some well-known spectrophotometers and spectrum line photometers. (The list is not exhaustive.)
In^mnTent Manufacturer Model Range o f m e a s u r e m e n t
8) Method o f
reading Radiation Other remarks
ZeissD
o o si P, o
Beckman
2
>
Optica3)
U n i c a m
4
)
P M Q II
R P Q 20
D U
D K - 1
D K - 2
C F 4 C F 4 with a double beam attachment
SP 500 SP 700
2 0 0 - 1 0 0 0 mu, to 2.5 a with photoresistance
2 0 0 - 2 5 0 0 m^.
2 2 0 - 1 0 0 0 ma (Scale: 190 to 2 0 0 0 ma) 2 0 0 - 3 000 ma (scale: 185 to 3 500 m(ji) 2 0 0 - 3 500 ma (Scale: 185 to 3 500 ma)
Special equipment:
1 7 0 - 4 0 0 0 ma 1 8 6 - 1 0 0 0 ma 1 8 6 - 1 0 0 0 m[JL with monochromator C F 4 N I : 1 - 4 a
1 8 6 - 1 0 0 0 ma 1 8 6 - 3 600 ma
direct reading, projected scale
recording
null point
recording
recording
null point recording
null point recording
Continuous spectrum, small variable wavebands: m o n o chromatic 9) [hydrogen and tungsten lamps]
Attachments for fluores
cence measurements, for evaluating paper chro- matograms and paper electrophoretograms, for flame photometry; remis
sion attachment.
Recording equipment available
D o u b l e beam instrument
Diffraction grating monochromator — attachments for flame photometry, turbidity and fluorescence measurements
Attachments for turbidity and fluorescence mea
surements, for reflection measurements, etc.
20 Section A: General
CaryS)
Beckman
2)
U n i c a m
4
)
11
14
B SP 600
1 8 5 - 8 0 0 mu
1 8 6 - 2 6 5 0 mu.
3 2 0 - 1 0 0 0 mu.
360—1000 mu.
recording
recording
direct reading null point
Continuous spectrum, small variable wavebands: m o n o chromatic
9
) (hydrogen and tungsten lamps)
Attachments for fluores
cence and reflection measurements.
Various other attach
ments or types o f equipment available.
Netheler
& Hinz6)
Zeiss D
Leitz?)
Eppendorf 313 —1014 mu
Elko II 3 6 5 - 7 5 0 ma Elko III 3 6 5 - 7 5 0 mu Leifo E 366 —750 mu,
direct reading
null point direct reading null point
m o n o c h r o m a t i c
9
) (mercury and cadmium lamps)
monochromatic
9)
(mercury and tungsten lamps) monochromatic
9)
(mercury and tungsten lamps)
Recording equipment and attachments for evaluation of paper electrophoretograms a n d fluorescence measure
ments available Recording equipment available
Monochromator attach
ment in preparation
1
> Carl Zeiss, Oberkochen/Wiirtt., Germany
2)
Beckman Instruments Inc., Fullerton/Calif., U.S.A.; Subsidiary, Munich 4 5 , Germany
3)
Optica SpA, Milano, Via Calatafini 7—9; Optica United Kingdom Ltd., A 7 Factory, Gateshead-on-Tyne, England.
4)
Unicam Instruments Ltd., Arbury Works, Cambridge, England.
5)
Cary Instruments, Applied Physics Corporation, Monrovia/Calif., U.S.A.
6)
Netheler & Hinz GmbH, Hamburg-Wellingsbiittel, Germany
7)
Ernst Leitz, Wetzlar, Germany
8)
The actual range of measurement does not always coincide with the graduations on the scale.
^> In practice a radiation is termed "monochromatic" if the spectral band-width is sufficiently small (few mpi) to guarantee strict proportionality between the optical density and the light path. Isolated lines from metallic vapour lamps can be termed monochromatic, but frequntly groups of lines are isolated; e.g. the Hg light at 366 mix consists of three closely-adjacent lines and at 528 mpi of two lines. However, the secondary lines are considerably less intense.
on) (qi) (z) II. Experimental Techniques 21
22 Section A : General
on the accuracy of the compensator, while in the second method (direct reading method) it depends on the accuracy of the indicator system. Certain types of instrument have a combi
nation of the direct reading and compensation methods.
P) Types of instrument and their range of application
There are three different groups of instrument:
Spectrophotometers
In spectrophotometers the light is a continuous spectrum produced by a tungsten lamp and the desired wavelength is isolated with a prism or a diffraction grating (monochromatic light).
Spectrophotometers are most versatile in their range of application. They can be used in qualitative analysis for the measurement of absorption spectra, which can be recorded directly by some instruments. For quantitative studies they allow any desired wavelength to be obtained and therefore measurements can always be made at the absorption maximum.
Distinction can be made between instruments which are equipped with a tungsten lamp and a glass optical system, so that their range is limited to the visible part of the spectrum, and instruments which have a quartz optical system and can therefore be used in the UV-region.
S p e c t r u m line p h o t o m e t e r s
Spectrum line photometers have a gas-discharge lamp (Hg, Cd) as the light source. From the discontinuous (line) spectrum of this lamp it is possible with optical filters to isolate the wavelengths which are emitted because of the nature of the gas (monochromatic light).
Spectrum line photometers were developed because of the need which arose when the tech
nique of photometric measurements was applied more and more to routine work. As they emit monochromatic light, although only at specific, fixed wavelengths, they can be employed for nearly all the methods developed for spectrophotometers. They are easier to handle, their accuracy is comparable, and they are cheaper and better value than spectrophotometers.
With some instruments the optical density can also be recorded as a function of time.
A survey of some of the best known spectrophotometers and spectrum line photometers is given in Table 1. Data on the wavelengths of some spectrum line photometers is given in Table 2.
P h o t o m e t e r s with t u n g s t e n l a m p and filters
These instruments use a tungsten lamp as the source of a continuous spectrum and the radiation is limited to a region of the spectrum by means of a filter (polychromatic light).
Such instruments are used for routine work which does not require a high accuracy of measurement. As these need fewer components they are cheaper than spectrum line photo
meters. They sometimes can also be fitted with recorders.
The spectrophotometer, which operates at any wavelength, is best suited to the determination of absorption spectra for qualitative analysis and to the development of new photometric methods of analysis. In quantitative analysis, especially in routine work, the accuracy with which a given concentration can be determined and the time required, are the criteria for the suitability and efficiency of a instrument.
When a method is routinely carried out at a fixed wavelength, there is no need for a conti
nuous change of wavelength, Rather the need is for a simple reproduction of the chosen wavelength. Metallic vapour lamps have proved especially successful in fulfilling this con-
II. Experimental Techniques 23
dition. The energy radiated by them is limited to certain fixed wavelengths because of the properties of the particular metal atoms. With a filter it is possible to separate a line of the spectrum. If it is established that adjacent lines are suppressed, then the wavelength of the
Table 2. Wavelengths of some spectrum line photometers.
H g (mercury) and Cd (cadmium) lamps produce monochromatic light, tungsten lamps polychromatic light. The filters for the Elko II and III instruments have a band-width at half m a x i m u m intensity
of ca. 20 mu and those for the Leifo E instrument of 20 — 30 mu.
Photometer Elko II Leifo
Instrument Eppendorf Elko III Leifo
H g Cd H g tungsten H g tungsten
313 334
366 365
S 38 E
366
380
405 405
S 42 E
405
420
436 436 436
c o 440
"S S 45 E
so c 460
468 S 47 E
480
492 S 49 E 490
O 509 S 51 E 510
rL
B S 53 E 530
c 546 546 546
S 55 E 550
"So
c S 57 E 570
578 578 578
> S 59 E
>
623
644
691
1014
I 62 *) I 66*) S 72 E S 75 E
600 620 660 720 750
*) Interference filter
light is not changed when the range of maximal transmittance of the filter differs from the
Xm ax of the line. This is in contrast to the use of filters with spectrophotometers which emit continuous spectra. Photometers with metallic vapour lamps as the light source are therefore most frequently used in routine measurement requiring high standards of accuracy. The use of a mercury vapour lamp has the additional advantage that it produces a series of intense lines in the UV-range.
24 Section A : General
To make the best use of the monochromatic light given by a metallic vapour lamp and filter, a correspondingly efficient device for measuring the light absorption is required. To obtain a similar efficiency with a tungsten lamp requires that only a narrow band be transmitted by the filters. It is possible to reduce this band-width to about 10 mu. without the light intensity becoming too low. The narrower the wave band of light transmitted by the filter, the more efficient must be the device for measuring the light, because the energy decreases with the narrowing of the band-width.
Due to the greater proportion of light absorbed at the absorption maxima, non-mono
chromatic light results in non-linear standard curves at high concentrations of the absorbing substance and therefore to a decrease in the accuracy of the measurements (Fig. 6).
•S 2.0
o P.
500
Wavelength [mu]
a)
£00
O
A /
Concentration b)
Fig. 6. The influence of monochromatic and polychromatic light on the shape of the standard curve (diagrammatic)
a) Absorption curve of a red solution 1. Monochromatic light (492 mu)
2. Polychromatic light (centre 520 mfx, band-width of the filter at half maximum intensity: 20 mu) 3. Monochromatic light (546 mu)
b) Standard curves obtained by use of the light indicated under a).
Here the reproducibility of the results depends on the absorption curve of the substance being investigated. If the absorption of the compound is similar for all wavelengths of the poly
chromatic beam, i.e. if the width of the absorption maximum of the compound is considerably wider than the transmission range of the filter, then essentially no change in the measured values will be brought about by a change in the spectral distribution of the energy of the lamp due to ageing or to an alteration of the working voltage. On the other hand, if the absorption band is narrow in comparison to the transmission range of the filter, then it is
II. Experimental Techniques 25
to be expected that the standard curve will depend considerably on the factors mentioned above. It therefore depends on the type of problem and on the accuracy required, whether an instrument employing a tungsten lamp and filter is suitable or not.
y) Measurement of light absorption
Although the nature of the light source and the type of light produced are probably most important for classifying photometers, the method of measurement of the absorption also has a considerable importance in determining the efficiency of an instrument.
The measurement of absorption is either by a compensation method resulting in a null point or by a direct reading method. In the true optical compensation method the absorption of the solution is balanced by a calibrated light-attenuating device. The value for the absorp
tion is read directly from the light-attenuating device (example: Elko II).
Thus the measured extinctions are no more accurate than the calibration of the light-atten
uating device. Since the chemist is normally concerned with the accuracy of measurements of concentration, this accuracy must be determined relative to the optical density measured.
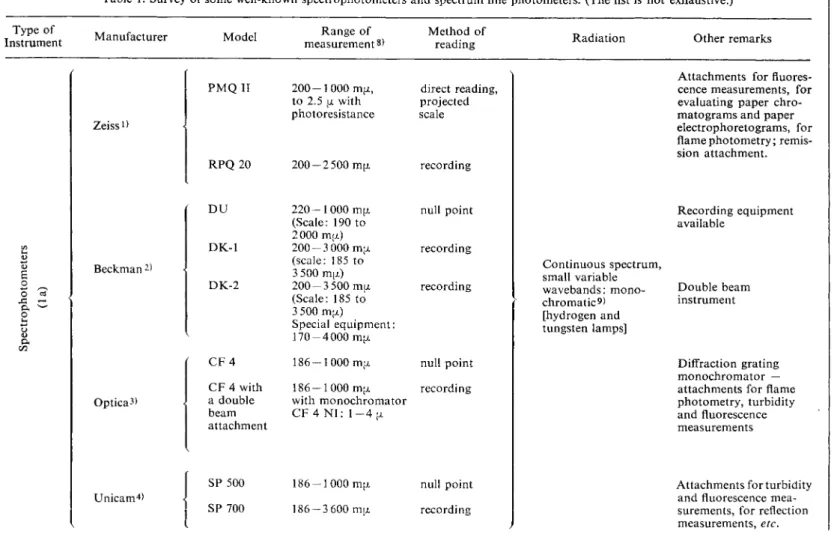
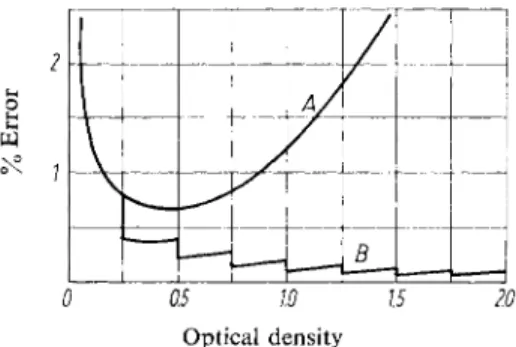
Generally it can be assumed that if the light-attenuating device is a graduated diaphragm, it has a constant uncertainty over the whole range of measurements of about 0.1 %, relative to 100% transmittance. If this uncertainty is plotted against the measured optical density a curve is obtained, in which the smallest error is 0.29% when the diaphragm is half closed (optical density 0.3) and this error slowly rises with larger and smaller optical densities. In such a case the concentration range is so chosen that the measurements are made on the range of the smallest error.
With development the photoelectric transformer (photocell) became sufficiently reliable to give a constant and linear relationship between the light intensity and the current generated.
The output of the photocell in most instruments was then balanced by an electrical system.
This can cause errors of measurement due to variations in the photocell characteristics, but on the other hand it permits the construction of an electric compensator and the possibility of switching to several ranges of measurement. For example, with such an arrangement, optical densities from 0 — 1.0 can be measured with range 1 and from 1.0—2.0 with range 2.
The range of measurement of the instrument depends on the spectral purity of the light beam and the degree of amplification of the output that can be achieved.
In the electrical compensation method the current generated by the photocell is balanced and the measured value is read off on the scale of the compensator (examples: Beckman DU, Unicam SP 500, SP 600). Considered optically, the transfer of the compensator to the electrical system is equivalent to using a direct reading instrument. For consistent results the current of the light source must be stabilized.
In the true direct reading method the electrical balance circuit is replaced by an instrument for measuring the current output of the photocell. The output is in nearly all cases amplified before measurement. The extent to which the direct measurement of the photoelectric current compares in accuracy with the compensation method depends on the quality of the indicator system. Good instruments therefore have an indicator system incorporating a light index scale to avoid errors due to parallax, and because this type of scale is easier to read than one employing a pointer (example: Zeiss PMQ II).
26 Section A : General
A measure of the capability of an instrument is given by the reproducibility of its measure
ments. In a well designed instrument the accuracy of reading the instrument is commensurate with its internal accuracy.
The scales of direct reading instruments and of equivalent null point instruments are seldom longer than 20 cm. because of lack of space. With these types of scale the accuracy of the readings relative to the optical density is greatest in the middle of the scale, i.e. at optical densities of about 0.3. This accuracy can be increased by optical magnification of the scale (example: Zeiss PMQ II).
Another way of reducing errors of reading is to combine the direct reading and null point methods. A series of equal electrical resistances is placed between the photocell and the indicator system. These can be shunted out when measuring high optical densities. In this way the readings with high optical densities are displaced from the condensed part of the scale to its initial part, where the readings are more accurate. The additional optical density due to the resistance shunted out of circuit is simply added. By this method the accuracy in measuring an optical density of 1.0 is increased 10-fold (e.g. "Eppendorf" photometer) and therefore the optimal accuracy is no longer around optical densities of 0.3. Since the accuracy of the compensating resistors is greater than the accuracy of the indicator system, and as the absolute accuracy of the latter remains the same, the accuracy relative to the optical density increases with increase in optical density (Fig. 7).
2
M O
u u m
/
A /
/
[•—•
—
B0 0.5 1.0 1.5 2.0 Optical density
Fig. 7. Influence of partial compensation on the accuracy of the readings.
Curve A : without partial compensation Curve B : with partial compensation
The upper limit is fixed by the properties of the photocell and the capacity of the amplifier.
The indicator system has been improved to such a degree that the accuracy of the instrument is virtually dependent on the photocell. Important factors determining the efficiency of the apparatus are the performance of the photocell and the ease of controlling and replacing it.
&) Special requirements of biochemistry and practical hints
G e n e r a l i n f o r m a t i o n
The direct reading system is especially suited to the measurement of reactions catalysed by enzymes, because the optical density changes per unit time can be read directly on the scale.
Recording the optical density (with a linear optical density scale) against the wavelength and
II. Experimental Techniques 27
more especially against reaction time simplifies the measurements and increases the per
formance of the apparatus.
An important factor in deciding the suitability of a photometer for the assay of enzyme activity is whether it can be used in the UV-region.
Because of the sensitivity of enzymatic reactions to temperature it is important that a constant temperature cuvette chamber is available for the instrument and that the cuvettes are easily accessible.
M e a s u r e m e n t of o p t i c a l d e n s i t i e s
In the application of photometry to analytical chemistry only the optical densities or optical density changes are of interest, because these are related to amounts of the substance (Lambert- Beer Law, see p. 5).
Measurement of the optical transmittance is unsuitable for chemical analysis. Its use in the initial stages of photometry arose from the fact that it could be read off from the linear scale of a normal indicator system, since transmittance is proportional to the galvanometer deflec
tion. With optical-attenuating devices the transmittance is proportional to the angle of rotation and thus an exact graduation of the scale, with resultant greater accuracy of the readings, is made easier. Use of a transmittance scale always leads to additional work and sources of error.
In enzymatic analysis optical density differences are measured and therefore the absolute values are not important. With determinations in which the reaction proceeds to completion AE values between 0.020 and 0.200 are suitable, as long as no other directions are given in the procedure. To obtain sufficiently accurate readings, the measurements should be made on a part of the scale on which the graduations are far apart, by choosing the concentration of the absorbing compound or by partial compensation of the photoelectric current (refer to Fig. 5).
Two wavelengths, 334 mu (weaker) and 366 mu (stronger), are available when using spectrum line photometers for the measurement of DPN and TPN-dependent reactions. Usually 366m[ji is chosen. The extinction coefficients for DPNH and TPNH are
3.30 x 10⁶ Cm.2/mole at 366 mu.3) 6.0 x 106 cm.2/mole at 334 m u A
These values are for 25° C. It should be noted that both extinction coefficients, especially that at 366 mu, are dependent on temperature (in contrast to the extinction coefficient at 340 mu); the values decrease with increasing temperature.
C o n t r o l c u v e t t e s a n d types of c u v e t t e
If the construction of the instrument allows it *) the measurements can be made against a cuvette containing all the reactants of an assay mixture except one (reagent blank), or against a cuvette containing water or even with the omission of a cuvette altogether ("against air").
*) For example, with the Elko II photometer the blank is measured against the experimental cuvette and therefore a control cuvette is absolutely essential.
3) H. J. Nohorst, Biochem. Z. 328, 509 [1956].
4
> G. Beisenherz, Th. Biicher and K. H. Garbade in S. P. Colowick and N. O. Kaplan: Methods in Enzymology. Academic Press, N e w York 1955, Vol. I, p. 391.
28 Section A : General
Control cuvettes are indispensable if the optical density of the solution to be measured is relatively high before the start of the reaction. If the intensity of the light is sufficient it is possible to partially or completely eliminate this initial optical density by reading against a control cuvette in which no reaction occurs.
For example, in the assay of serum transaminase from patients with hepatitis (see p. 848) the strongly coloured serum has a considerable optical density. The initial optical density of the reaction mixture containing DPNH is so high at 340 or 366 mu that the relatively small optical density changes can no longer be read accurately on the condensed part of the logarith
mically graduated optical density scale. A control cuvette is prepared from the strongly coloured serum or a little DPNH and the instrument is so adjusted that when the control cuvette is in the light path, full transmittance or zero optical density is given (the instrument is "zeroed" with the control cuvette or "measurements are made against the control or blank cuvette").
In some instruments high optical densities are compensated for electrically in steps (for example of 0.25) instead of by means of a blank, thus enabling measurements of the optical density changes to be made in the range 0—0.25. In this way readings of high accuracy are attained even with high optical densities.
All spectrophotometers and the "Eppendorf" photometer (see p. 21) use cuvettes with a base of 1 x 1 c m .
2
, 1 x 2 cm.
2
or 1 x 4 cm.
2
(internal measurements). The Elko II, Elko III and Leifo E (p. 21) instruments have special cuvettes, which can only be used for these instruments.
Care must be taken that the cuvettes are sufficiently full; only light that has passed through the solution should be allowed to reach the photocell. If the volume of the assay mixture is insufficient to fill the cuvettes, they can be raised up with pieces of wood or cardboard (e.g. in the Elko II by 3 mm.; in the Elko III by 7 mm.).
The amount of reagent required can be reduced if the area of the optical surface of the cuvette through which the light passes is made smaller. With efficient instruments this need only be a few mm
2
., so that if necessary the assay volume can be reduced by one or two orders of magnitudes. Some manufacturers supply so-called micro-cuvettes for this purpose.
e) Measurement of fluorescence
Measurement of fluorescence (fluorimetry) is being employed more and more. The native fluorescence of a compound (e.g. of FAD or DPNH) or that produced by chemical action (e.g. by making a DPN solution strongly alkaline) can be measured. In principle all TPN and DPN-dependent reactions involved in enzymatic analysis can be measured fluorimetri- cally. In this way the sensitivity of measurement is increased by two to three orders of magnitudes (refer to p. 551).
Suitable instruments for routine fluorimetric measurements are the fluorescence attachments of the well-known spectrophotometers and the "Eppendorf" photometer, and especially the Farrand fluorimeter (Farrand Optical Co., New York, USA). For the development of fluorimetric methods with the aim of obtaining the optimum conditions with regard to the excitation and fluorescent light a spectrophotofluorimeter (e.g. Aminco-Bowman *>) is
*) American Instrument C o . , Inc., Silver Spring, Md., U S A .
II. Experimental Techniques 29
necessary. For the practical details of fluorescence measurements and the theoretical prin
ciples see 5)
and 6
).
b) M a n o m e t ri c m e t h o d s
a) Principle
In manometry, which was founded by Barer oft 1
^ and further developed by O. Warburg®, a volume of gas is measured by means of a constant volume manometer. An efficient thermo- regulator is essential for manometric measurements. The following types of reaction can be measured:
1. Gas producing reactions (e.g. CO2 formed by the action of carboxylase) 2. Gas consuming reactions (e.g. O2 used in the cytochrome oxidase reaction) 3. Acid forming reactions, (e.g. all DPN-dependent dehydrogenase reactions yield
production of CO2 from a proton in the reduction of DPN) bicarbonate buffer
4. Acid binding reactions (is practically never used. Negative pressures occur, if in the in bicarbonate/CC>2 buffer reaction of phosphate esters, an ester with a larger pK*>
is formed)
The last two groups of reactions have the disadvantage that they are not specific. Interference due to the presence of two gases, for example, O2 and CO2 in aerobic glycolysis can be eliminated by the adsorption of the CO2 in KOH or by use of two flasks.
For details of the various methods and instruments, see, for e x a m p l e 9 , 1 0)
and Fig. 8.
P) Practical hints
The Warburg bath should not stand in a room which has large fluctuations in temperature (draughts).
The size of the flasks is governed by the requirements of the analysis. Large differences in the flask volumes should be avoided and the flask constants (see p. 40) should be as similar as possible; ± 1 0 % is reasonable. The smaller the flasks the more sensitive are the changes registered by the manometer, but on the other hand the measurements are more inaccurate (see p. 42). The best method for calibration of the flask and manometer is with mercury.
Each series of measurements requires a flask for recording the temperature and barometer changes ("thermobarometer"). Apart from this a flask should be prepared omitting one of the essential reactants ("blank") so that possible gas changes due to side reactions are mea-
*) For a compilation of some p K values see F. Lipmann in F. F. Nord and C. H. Werkman: Advan
ces in Enzymology. Interscience Publishers, N e w York 1941, Vol. I, p. 113.
5)
D. J. R. Laurence in S. P. Colowick and N. O. Kaplan: Methods in Enzymology. Academic Press, N e w York 1957, Vol. IV, p. 174.
6)
G. Kortiim in Hoppe-Seyler-Thierfelder: Handbuch der physiologisch- und pathologisch-chemi- schen Analyse. Springer-Verlag, Heidelberg 1953, Vol. I, p. 417.
7) J. Barcroft, J. Physiol. 37, 12 [1908].
8) O. Warburg, Biochem. Z. 152, 51 [1924].
9)
R. H. Burris, W. W. Umbreit and / . F. Stauffer: Manometric Techniques. Burgess Publishing Co., Minneapolis 1957.
10
> F. Dickens in E. Bamann and K. Myrback: Methoden der Fermentforschung. Georg-Thieme- Verlag, Leipzig 1941, Vol. I, p. 955.
30 Section A: General
sured. Reaction mixtures containing more than about 10 mg. protein/ml. retain CO2 ("CO2 retention"). This retention must be subsequently determined by tipping in acid.
Fig. 8. A simple (open) manometer after Haldane-Barcroft-Warburg A. Manometer tap. — B. Reaction flask with side-arm and centre well (manometer vessel, flask or cup). — C. Graduated capillary tube (manometer). — D . Brodie solution. — E. Rubber tubing. — F. A d
justing screw.
The flasks must first be equilibrated for 5 to 15 minutes; then the reaction is started by tipping in the enzyme, coenzyme or substrate solution from the side-arm. If the total gas change is to be measured, the tap must be closed before tipping and remain closed until the reaction is complete. In case magnetically fastened cups*) are not used, the manometer must be removed from the Warburg bath for a short period while tipping and as a result, in spite of further equilibration, displacement of the zero point of the manometer cannot be complet
ely avoided.
y) Manufacturers of apparatus (" Warburg baths" and accessories)
The apparatus of the following firms are well-known:
B. Braun, Melsungen, Germany
Ludwig Hormuth, Inh. E. W. Vetter, Heidelberg, Germany GME, Gilson Medical Electronics, Middleton/Wisc, USA Aminco, American Instrument Co., Inc., Silver Spring/Md., USA Townson & Mercer Ltd., Croydon, England
c) O t h e r m e t h o d s oc) Micromethods
Micromethods have been developed for both optical 1 1
) and manometric 1 2
) procedures.
However, because of the smaller volumes special equipment is necessary (micro-pipettes, micro-beakers, micro-centrifuge and test tubes, micro-cuvettes, etc).
*) from B. Braun, Melsungen, Germany.
n
) e.g. O. H. Lowry in S. P. Colowick and N. O. Kaplan: Methods in Enzymology. Academic Press, N e w York 1957, Vol. IV, p. 366.
12
> F. Duspiva in Hoppe-Seyler-Thierfelder: Handbuch der physiologisch- und pathoiogisch-chemi- schen Analyse. Springer-Verlag, Heidelberg 1955, Vol. II, p . 345.
II. Experimental Techniques 3i A special branch of micro-technique which allows the study of individual cells or cell com
ponents is enzymatic histochemistry or cytochemistry (refer t o
1 2 - 1 4
) ) . In so far as the details of enzymatic histochemistry are important for the analytical procedures described in this book, they will be found in Section C , p. 920.
P) Thunberg technique
The Thunberg technique 1 5
- 1 6
> has been virtually superseded by manometry. Thunberg tubes (Fig. 9) are still occasionally used when anaerobic conditions (by evacuation) are required for a reaction (see p. 917).
A
Fig. 9. Thunberg tubes
A. Ground-glass stopper, suitable for additions. — B. Ground-glass stopper. — C. To vacuum,
y ) Polarography and polarometry
This branch of electrochemical technique is becoming increasingly important for several biochemical problems. Polarographic measurements n-19) with the dropping mercury elec
trode, which require a relatively large expenditure on apparatus, is used much less than the simpler polarometric determination of soluble compounds with the polarized, rotating or vibrating platinum electrode
2 0 _ 2 3 )
. The oxygen consumption in enzymatic reactions can be determined rapidly, simply and accurately by the latter method. In contrast to manometry
!3) K. Linderstrom-Lang and H. Holler in E. Bamann and K. Myrback: Die Methoden der Ferment- forschung. Verlag Georg Thieme, Leipzig 1941, Vol. I, p. 1132.
l4
> F. Duspiva in H. M. Rauen: Biochemisches Taschenbuch. Springer-Verlag, Heidelberg 1956, p. 891.
15
) W. Franke in Hoppe-Seyler-Thierfelder: Handbuch der physiologisch- und pathologisch-chemi- schen Analyse. Springer-Verlag, Heidelberg 1955, Vol. II, 2, p. 311.
16
> R. H. Burris in W. W. Umbreit, R. H. Burris, and J. F. Stauffer: Manometric Techniques and Tissue Metabolism. Burgess Publishing Co., Minneapolis 1957, p. 130.
1?
) /. Heyrovsky: Polarographie. Springer-Verlag, Vienna 1941.
lg
) I. M. Kolthoff and J. /. Lingane: Polarography. Interscience Publishers, N e w York 1941.
1 9
) M. v. Stackelberg: Polarographische Arbeitsmethoden. Verlag D e Gruyter, Berlin 1950.
20) B. Chance, J. biol. Chemistry 797, 557 [1952].
2D E. D. Harris and A. J. Lindsey, Nature [London] 162, 413 [1948].
22) B. Chance, Science [Washington] 120, 161 [1954].
23) B. Chance and G. R. Williams, J. biol. Chemistry 217, 383 [1955].
32 Section A: General
reactions involving the very rapid consumption of oxygen can be measured. The main applications are for the measurement of the O2 consumption of mitochondria, yeast and other cell suspensions, enzymes such as cytochrome oxidase, etc. (for example, refer to
2 4
~ 2 6
>).
Routine polarometric methods for the enzymatic determination of metabolites or for the measurement of enzyme activity have not yet been developed.
3. Evaluation of the Experimental Results
a) General information
To carry out an analysis correctly it is necessary first to check whether, within the range of the method, there is a straight line relationship between the quantities of substance used and the amount measured. With very accurate and well-tried methods duplicate or triplicate determinations are unnecessary. On the other hand, if a number of determinations are made on the same substance, the results should lie within the range of error of the method.
a) Enzyme units and their conversion
The measure of the activity of enzymes is the enzyme unit. The definitions of many units have their origin in the technique of measurement and are accordingly varied. In order to be able to compare different enzyme preparations or the same preparation from different sources it is necessary to define a generally accepted "International Unit". The efforts of the US National Resarch Council (NRC), Committee on Biological Chemistry, Washington, D. C , in this direction are very welcome. In the summer of 1959 the Enzyme Commission of the International Union of Biochemistry (IUB) and the Clinical Chemistry Commission of the International Union of Pure and Applied Chemistry (IUPAC) adopted
2 8 -
2 9 -
2 9 a
> the proposal of E. Racker et a l .
2 7 )
. According to this the International Unit is defined as the amount of en
zyme which converts 1 pimoleof substrate per minute. The other conditions are 25° C, optimal substrate concentration, optimum ionic strength of the buffer and optimum pH. The "speci
fic activity" of an enzyme is the activity of a milligram of the enzyme. In biological material such as blood or serum it should be related to 1 ml. or 1000 ml. 29). This is a great step forward towards the possibility of achieving agreement in the field of enzymology. Unfortunately, however, this definition cannot be used universally. The inclusion of the substrate concen
tration in the definition is essential with all enzymes which experimentally cannot be saturated with substrate (e.g. catalase).
Reciprocal conversion of units: Before the adoption of the International Unit it was often necessary to convert from one unit to another. The most appropriate method is by means of the number of pimoles reacting/unit time.
Definitions which result from optical measuring techniques are easily interconverted (refer to transaminase units p. 841, 849).
24) /. S.Longmuir, Biochem. J. 57, 81 [1954].
25) /. S. Longmuir, Biochem. J. 65, 378 [1957].
26) B. Chance and B. Hess, J. biol. Chemistry 234, 2416 [1959].
27) / . Cooper, P. A. Srere, M. Tabachnick and E. Racker, Arch. Biochem. Biophysics 74, 306 [1958].
28) Cf. E. C. Webb, Lecture Symposium d'Enzymologie, Gent (Belgium), April 2nd. 1960.
29) E. J. King and D. A. Campbell, Clin. chim. Acta 6, 301 [1961].
29a) Report of the Commission on Enzymes; I.V.B. Symposium Series, Vol. 20. Pergamon Press London 1961.
I I . Experimental Techniques 33 Example: The unit according to Biicher et al.
3 0
* is to be converted to the unit according to Racker et a l .
2 7 )
. For DPN and TPN-dependent dehydrogenases and enzymes which react in coupled reactions with these dehydrogenases, a unit according to Biicher is the amount of enzyme dissolved in 1 ml. which at 25° C and with a light path of 1 cm. changes the optical density at 366 mu by 0.100 in 100 sec. As the extinction coefficient for DPNH and TPNH at 366 mu is 3.30 cm
2
./fjimole, a change in optical density AE = 0.100 corresponds to a change
0.100
in DPNH (TPNH) concentration of y ^ - = 0.0303 pimoles/ml.
Table 3. Definitions and conversion factors for some enzyme units T o convert a unit
according to
to a unit
according to multiply by Racker et a l .
a
) 25° C ;
1 [jimole/min.
Biicher et a l .
b
) Wroblewski et al.
c
^ Amelung and Horn®
55 2073.5
60 Biicher et al.
b
) 2 5 ° C ; 1 ml.; 100 sec.
A E3 66 = 0.100
Racker et a l .
a
) Wroblewski et al.
c
) Amelung and Horn®
0.0182 37.7
1.09 Wroblewski et al.
c
^ 23°C*>; 3 ml.; 1 min.
A E3 4o = 0 . 0 0 1
Racker et a l .
a
) Biicher et a l .
b
) Amelung and Horn®
4 . 8 2 x 1 0 - 4 0.0265 0.0289 Amelung and Horn®
25° C ; 1 [xmole/hr.
Racker et a l .
a
) Biicher et a l .
b
) Wroblewski et a l .
c
)
0.0167 0.92 34.6 a) Arch. Biochem. Biophysics 74, 306 [1958J.
b) Z. Naturforsch. 8 b, 555 [1953].
c) Science (Washington) 120, 3117 [1954].
d) Dtsch. med. Wschr. 81, 1701 [1956].
*) Deviation o f the temperature of the measurements from 25° C was not taken into account in the calculation of the conversion factors.
For the definition of a unit according to Racker et al., see p. 32. It follows that:
1 Unit according to Biicher AE3 6 6/At = 0.100/100 sec. = 0.060/min., that is 0.0182 [xmoles/
min.
1 International Unit — Ac/At = 1 pimole/min.
Therefore
1 International Unit = 55 units according to Biicher 0.0182 International Units = 1 unit according to Biicher.
DPNH or TPNH optical densities for the wavelengths 340 or 366 mo, are interconverted with the factor 1.89 (e3 4o: £366 = 6.22: 3.30 = 1.89).
Table 3 gives the conversion factors for some of the common enzyme units which have been calculated on the basis of the example given above.
30) G. Beisenherz, H. J. Boltze, Th. Biicher, R. Czok, K. H. Garbade, E. Meyer-Arendt and G. Pflei- derer, Z. Naturforsch. 8b, 555 [1953].
34 Section A : General
The notation Q value, which is derived from manometry, is converted to International Units as follows:
1 umoles gas change/60 min.
yA. gas change/hr. = 22.4
(1) Q0 or Qc o, or Qa c id = = mg. enzyme mg. enzyme
1 (j-moles gas change/min./mg. — 7.45 X 10~
4
(Jimoles gas change/min./mg.
1344
Example: An enzyme preparation has a Qq2 of 2 0 0 0 0 . That is to say: 2 0 0 0 0 x 7.45 x 10~
4 = 14.9 amoles substrate/min./mg. are converted. The specific activity in units according to Racker et al. is 14.9 units/mg.
In principle, it is impossible to interconvert two enzyme units which have been defined for different buffers and different temperatures, but it is possible if the buffer has no effect on the rate of the reaction and if the temperature coefficient of the reaction has been determined accurately. Refer to the conversion of aldolase units defined at 37° C according to Brims
to other units measured at 25° C.
The turnover number of an enzyme is defined as:
moles substrate converted/min.
(2) T N =
moles enzyme
(in the early literature 1 mole is usually defined as 100000 g. of enzyme, owing to the uncer
tainty about the molecular weight of many enzymes). The calculation of the turnover number from the specific activity of an enzyme (?)
pimoles substrate converted/min.
(3) units/mg. enzyme =
mg. enzyme
follows from equations (2) and (3): the specific activity is defined as moles substrate converted per minute per mole of enzyme. Since [jimoles/mg. = 10~
3
moles/g. and moles = g./molecular weight, the specific activity must be multiplied by (10~
3
xmolecular weight) of the enzyme:
(4) T N = specific activity X 10~
3
X molecular weight of the enzyme
Example: Crystalline pyruvic kinase from rabbit muscle has a specific activity of ca.
120 units/mg.; the molecular weight is 2 3 0 0 0 0 (assay conditions and other details, see p. 997).
The turnover number calculated according to equation (4) is TN ^ 120 x 10~
3
x 2 3 0 0 0 0 = 2 7 6 0 0 (moles substrate converted per minute per mole enzyme).
1) Evaluation of reaction curves
All definitions of enzyme units are based on the rate of the reaction catalysed by the enzyme.
This is defined as the decrease in the substrate concentration or the increase in the concen
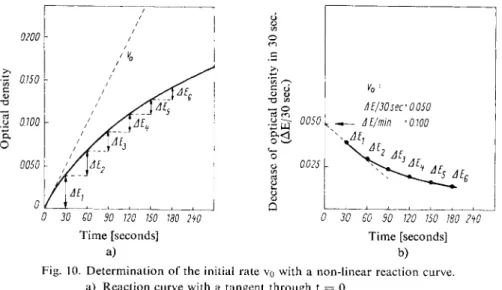
tration of the reaction products per unit time, which is given by the slope of the reaction curve, Ac/At, AE/At, Ah/At, etc., when for example, the unit of measurement is optical density or mm. Brodie fluid. In enzymatic reaction kinetics the rate of the reaction is normally understood to mean the initial rate of the reaction unless otherwise stated. If the rate changes during the reaction the course of the curve is non-linear (refer to p. 8); usually it decreases
II. Experimental Techniques 35
with time. The more non-linear the curve, the more difficult it is to obtain the initial rate exactly. Approximate values for the initial rate can be obtained if several measurements are made just after the start of the reaction. These values are then plotted and extrapolated to t = 0 (refer to Fig. 10b).
To obtain the exact value for the initial rate a tangent is drawn to the curve through t = 0 (Fig. 10a). To do this a mirror ruler is used. This is a mirror placed vertical to the plane of the graph; it is placed across the reaction curve and is turned until the curve appears in the mirror without a break. The line drawn along the mirror edge is the vet ical to the tangent on the curve at the point of intersection with the mirror edge. Small errors of measurement can be eliminated if the tangent values are plotted against the corresponding times (Ac/At or AE/At against t) or against the concentration (Ac/At or AE/At against c) and then extra
polated to zero time (in approximate form, see Fig. 10b).
* " ' ' . 1 . . I Q l 1 -1 1 . . i L_
0 30 £0 90 120 ISO 180 2W 0 30 60 90 120 150 180 2fQ
Time [seconds] Time [seconds] a) b)
Fig. 10. Determination of the initial rate vo with a non-linear reaction curve.
a) Reaction curve with a tangent through t = 0
b) Determination of vo by extrapolation of the values for AE/30 sec. from curve a) to t = 0.
y) Standard curves and standards
In a stoichiometric reaction the experimental results can be calculated on the basis of the molar extinction coefficient, molar volume or other unit of matter. If the reaction does not proceed to completion then standard curves must be used. Naturally, it is necessary to employ defined conditions of temperature, pH and buffer concentration. Standard curves for deter
minations on biological material are best prepared by the addition of the compound to be estimated to the biological material, so that any effects due to other compounds contained in the sample can be allowed for.
Standard curves should pass through the origin when the unit of measurement is plotted against the concentration. If they cut the ordinate (on which the unit of measurement is usually plotted) the system already contains traces of the substance to be determined (or with coupled reactions, one of the intermediates), or the reagent blank has been prepared incor
rectly and has given too low a value. If the standard curve cuts the abscissa (on which the