Report
Tissue-Specific Mitochondrial Decoding of Cytoplasmic Ca 2+ Signals Is Controlled by the Stoichiometry of MICU1/2 and MCU
Graphical Abstract
Highlights
d
Abundance of MICU1 relative to MCU directly reflects their association
d
Proportion of MICU1-bound MCU is limited by tissue-specific MICU1 availability
d
MICU1:MCU ratio affects mitochondrial Ca
2+uptake in liver and muscle
d
Liver-like MICU1:MCU ratio in heart leads to contractile dysfunction
Authors
Melanie Paillard, Gyo¨rgy Csorda´s, Gergo¨ Szanda, ..., Erin L. Seifert, Andra´s Spa¨t, Gyo¨rgy Hajno´czky
Correspondence
gyorgy.hajnoczky@jefferson.edu
In Brief
Paillard et al. report that the relative abundance of the pore-forming protein of the mitochondrial Ca
2+uniporter (MCU) and its Ca
2+-sensing regulator (MICU1) define the proportion of MCU complexes with or without MICU1. This ratio is central to programming tissue-specific mitochondrial Ca
2+uptake phenotypes in the heart and liver.
Paillard et al., 2017, Cell Reports18, 2291–2300 March 7, 2017ª2017
http://dx.doi.org/10.1016/j.celrep.2017.02.032
Cell Reports
Report
Tissue-Specific Mitochondrial Decoding of Cytoplasmic Ca 2+ Signals Is Controlled by the Stoichiometry of MICU1/2 and MCU
Melanie Paillard,1Gyo¨rgy Csorda´s,1Gergo¨ Szanda,2T€unde Golena´r,1Valentina Debattisti,1Adam Bartok,1Nadan Wang,3 Cynthia Moffat,1Erin L. Seifert,1Andra´s Spa¨t,2and Gyo¨rgy Hajno´czky1,4,*
1MitoCare Center, Department of Pathology, Anatomy, and Cell Biology, Thomas Jefferson University, Philadelphia, PA 19107, USA
2Department of Physiology, Semmelweis University, Budapest 1085, Hungary
3Center for Translational Medicine, Department of Medicine, Thomas Jefferson University, Philadelphia, PA 19107, USA
4Lead Contact
*Correspondence:gyorgy.hajnoczky@jefferson.edu http://dx.doi.org/10.1016/j.celrep.2017.02.032
SUMMARY
Mitochondrial Ca
2+uptake through the Ca
2+uni- porter supports cell functions, including oxidative metabolism, while meeting tissue-specific calcium signaling patterns and energy needs. The molecular mechanisms underlying tissue-specific control of the uniporter are unknown. Here, we investigated a possible role for tissue-specific stoichiometry be- tween the Ca
2+-sensing regulators (MICUs) and pore unit (MCU) of the uniporter. Low MICU1:MCU protein ratio lowered the [Ca
2+] threshold for Ca
2+uptake and activation of oxidative metabolism but decreased the cooperativity of uniporter activation in heart and skeletal muscle compared to liver. In MICU1-overexpressing cells, MICU1 was pulled down by MCU proportionally to MICU1 overexpres- sion, suggesting that MICU1:MCU protein ratio directly reflected their association. Overexpressing MICU1 in the heart increased MICU1:MCU ratio, leading to liver-like mitochondrial Ca
2+uptake phenotype and cardiac contractile dysfunction.
Thus, the proportion of MICU1-free and MICU1- associated MCU controls these tissue-specific uniporter phenotypes and downstream Ca
2+tuning of oxidative metabolism.
INTRODUCTION
Mitochondrial Ca2+uptake provides a fundamental input to the control of oxidative metabolism and contributes to cell-sur- vival-regulating mechanisms. It is primarily driven by the membrane potential (DJm) and is mediated by an electrogenic uniport, referred to as ‘‘Ca2+uniporter’’ (mtCU). Tissue-specific differences in the Ca2+ uptake kinetics have been noted for some time and attributed to tissue-specific alternative Ca2+up- take mechanisms. These mechanisms either had a phenomeno- logical definition, such as rapid uptake mode, or were linked to
ryanodine receptors or uncoupling proteins (Buntinas et al., 2001; De Stefani et al., 2016). Recently, comparison ofIMiCain different tissues revealed great differences in the current density (Fieni et al., 2012). Among tissues with high amounts of mito- chondria that strongly depend on oxidative metabolism, liver, muscle, and heart showed both qualitative and quantitative dif- ferences in Ca2+uptake and currents (Buntinas et al., 2001; Fieni et al., 2012). These differences are particularly interesting in the context of the distinct frequencies of calcium signals that hepatic and cardiac mitochondria cope with. Specifically, in resting he- patocytes, cytoplasmic Ca2+([Ca2+]c) is steadily low, and upon stimulation, [Ca2+]coscillations are induced with a cycle time of 20 s or more (Hajno´czky et al., 1995; Robb-Gaspers et al., 1998). By contrast, in murine cardiomyocytes, [Ca2+]cconstantly oscillate with resting and stimulated cycle times between 0.15 and 0.08 s. In hepatocytes, each [Ca2+]cspike propagates to mitochondria individually, whereas in mouse cardiomyocytes, mitochondria likely take up little Ca2+from a single [Ca2+]cspike and integrate spikes of varying frequencies to control the Ca2+response (Griffiths and Rutter, 2009).
The major mtCU-forming proteins have been identified, including the pore, MCU (Baughman et al., 2011; Chaudhuri et al., 2013; De Stefani et al., 2011); its dominant-negative form, MCUb (Raffaello et al., 2013); a scaffold, EMRE (Sancak et al., 2013); and helix-loop-helix structural domain (EF-hand) containing Ca2+-sensitive regulators, MICU1 (Csorda´s et al., 2013; Mallilankaraman et al., 2012a; Perocchi et al., 2010;
Wang et al., 2014) and MICU2 (Kamer and Mootha, 2014; Patron et al., 2014; Plovanich et al., 2013). To date, a MICU complex (a hetero/homo-dimer of MICU1 and MICU2) appears to deter- mine both the threshold and cooperative activation of the mtCU by Ca2+(Csorda´s et al., 2013; Hung et al., 2014; Patron et al., 2014; Perocchi et al., 2010; Plovanich et al., 2013).
MCU and MICU1 both show tissue-specific mRNA expres- sion, which is particularly low for MICU1 in cardiac muscle (De Stefani et al., 2011; Mallilankaraman et al., 2012b; Plovanich et al., 2013). Whole-body MCU knockout is either embryonic le- thal or unexpectedly irrelevant for normal development, depend- ing upon the mouse strain (Pan et al., 2013). We have shown that MICU1 knockout mice die perinatally, and deletion of MICU1 in the liver interferes with survival and tissue regeneration after
Cell Reports18, 2291–2300, March 7, 2017ª2017 2291 This is an open access article under the CC BY-NC-ND license (http://creativecommons.org/licenses/by-nc-nd/4.0/).
partial hepatectomy (Antony et al., 2016). Loss-of-function hu- man MICU1 mutations have also been linked to neurological and skeletal muscle disease (Logan et al., 2014). MICU1/2 have been shown to account for the non-linear Ca2+dependence of mtCU-mediated Ca2+ uptake, but their involvement in the in vivo tissue-specific differences in the mtCU Ca2+sensitivity is still unclear. Here, we tested whether protein levels of MICUs and MCU and their stoichiometry could control mitochondrial Ca2+ uptake in accordance with tissue-specific physiological needs. In terms of integration of mitochondrial Ca2+ uptake with tissue-specific functions, the control ofIMiCaby [Ca2+]cis highly relevant but is difficult to study at low [Ca2+]. The lowest [Ca2+] tested byFieni et al. (2012) was 50mM, which is orders of magnitude higher than the resting [Ca2+]c. A recent modeling study emphasized that cardiac and liver mitochondria display a common relationship for the [Ca2+]cdependence of mitochon- drial Ca2+uptake (Williams et al., 2013), but the submicromolar range of the curve fit does not seem to be reliable. Therefore, we decided to systematically quantify the [Ca2+]cdependence of mitochondrial Ca2+fluxes and the uniporter protein constitu- ents in different tissues derived from the same donor mouse.
RESULTS
Distinct Ca2+Dependence of Ca2+Uptake and Oxidative Metabolism in Heart and Liver
We first focused on cardiac and liver mitochondria and evaluated mtCU-mediated mitochondrial Ca2+ uptake fluorometrically in suspensions of isolated mitochondria by measuring the ruthe- nium red (RuRed)-sensitive clearance of Ca2+added to the cyto- plasmic medium. To better isolate the mitochondrial Ca2+influx, these experiments were done in the presence of sarco/endo- plasmic reticulum Ca2+-ATPase (SERCA) inhibitor thapsigargin (Tg) and the mitochondrial Na+-Ca2+ exchanger blocker CGP37157. Interestingly, in response to submicromolar [Ca2+]c increases, liver mitochondria displayed almost no Ca2+clear- ance, whereas heart mitochondria showed a strong decrease in [Ca2+]c(Figure 1A). This suggests that the [Ca2+] threshold of the mtCU can be very low for certain tissues, such as heart.
To assess a potential effect on oxidative metabolism, we evalu- ated the NAD(P)H autofluorescence as a measure of the activation of the Ca2+-sensitive matrix dehydrogenases. The Ca2+uptake observed at low [Ca2+]c in heart mitochondria was associated with a significant increase in NAD(P)H, whereas no changes in NAD(P)H were observed in liver mitochondria under the same con- ditions (Figure 1B). When exposed to higher free [Ca2+]cup to 15mM, a rapid mitochondrial Ca2+clearance was measured for both tissues, with liver mitochondria taking up Ca2+faster than heart mitochondria (Figure 1C). Simultaneous recordings of [Ca2+]candDJmshowed only small depolarization during Ca2+
uptake in cardiac mitochondria, indicating that the uptake was not limited by the driving force (Figure 1D). At this higher [Ca2+]c
exposure, NAD(P)H response was higher in liver mitochondria than heart mitochondria (Figure 1B; 8.03%±1.06% in liver versus 3.27%±0.90% in heart; p < 0.05). Both the mitochondrial depo- larization and the NAD(P)H response to Ca2+were prevented by RuRed (n = 3; data not shown), confirming that these changes were downstream of mitochondrial Ca2+uptake.
To better characterize the [Ca2+]cdependence of the hepatic and cardiac mitochondrial Ca2+ uptake, we constructed a [Ca2+]cdose response for the initial Ca2+uptake rates (Figure S1) and for the fractional uptake (Figure 1E). In both presentations, the low end reached lower and the high end higher values for liver mitochondria, suggesting a higher mtCU [Ca2+]cthreshold and higher maximal activity. Double logarithmic plots of the initial Ca2+uptake rates against [Ca2+]cconfirmed a higher slope in liver than in heart (Figure 1F; 2.67±0.09 versus 1.48±0.12;
p < 0.05). Thus, mitochondrial Ca2+ uptake displays distinct Ca2+dependence between heart and liver and occurs already at submicromolar [Ca2+]cin heart mitochondria.
Liver, Heart, and Muscle Mitochondria Show Differential Activation of Mitochondrial Ca2+Uptake by Ca2+, Linked to Their Distinct MICUs and MCU Expression Profiles To further address the regulation of the mtCU in different tissues, we quantified the RuRed-sensitive45Ca2+(45Ca) sequestration by mitochondria isolated from heart, liver, and skeletal muscle.
In response to a submicromolar Ca2+bolus (660 nM), liver mito- chondria displayed linear uptake kinetic for at least 30 s with a hardly detectable rate, whereas cardiac and even more the skel- etal muscle mitochondria showed faster45Ca accumulation (Fig- ures 2A and 2C), demonstrating a very low threshold of activation for the mtCU in the latter tissues. Differently, in response to 12 mM [Ca2+], 45Ca uptake by liver mitochondria was faster than that by heart mitochondria, whereas uptake by skeletal muscle mitochondria was the fastest (Figures 2B and 2C).
RuRed effectively abolished45Ca accumulation by mitochondria isolated from each tissue, validating the specificity of the uptake through the mtCU. Double logarithmic plots of the initial Ca2+
accumulation (15 s; RuRed sensitive uptake) against [Ca2+]cindi- cated a higher threshold for liver than heart or skeletal muscle mitochondria (Figure 2D). The plot for liver mitochondria also showed a higher slope, confirming different levels of positive cooperativity for [Ca2+]-dependent activation of mtCU in the different tissues (liver: 1.68 versus heart: 1.02 and muscle:
0.87; p < 0.05), as shown by fluorescence (Figure 1F).
We speculated that the relative abundance of MICUs and MCU proteins might account for the tissue-specific mitochon- drial Ca2+uptake phenotypes in these three tissues. Analysis of the protein level of the components of the mtCU in the mito- chondria used for the Ca2+ transport measurements showed higher MICU1 abundance in mouse liver and skeletal muscle versus heart mitochondria, whereas MICU2 appeared relatively high in heart mitochondria. MCU was slightly but significantly lower in heart than liver and much higher in skeletal muscle mito- chondria (Figures 3A and 3B). Altogether, these results support a distinct profile for both MICUs and MCU protein expression in liver, heart, and skeletal muscle.
The high amount of MCU correlates directly with the fast
45Ca uptake in skeletal muscle. However, the lower amount of MCU in heart versus liver could not account for the faster
45Ca uptake at the submicromolar range in heart. Also, the [Ca2+]c dependency was similar in heart and skeletal muscle (see slopes inFigure 2D). To test whether the stoichiometry, i.e., the quantitative abundance of MICUs and MCU might deter- mine the different mitochondrial Ca2+uptake profiles in these
Figure 1. Cardiac Mitochondria Display Low-Threshold and Less Cooperative Activation of Ca2+ Uptake and Oxidative Metabolism Compared to Liver Mitochondria
(A) Time courses of the mitochondrial clearance of the [Ca2+]crise upon addition of a 3mM CaCl2bolus (3Ca) in suspensions of liver (black) and heart (red) mitochondria, with and without RuRed (3mM).
(B) NAD(P)H autofluorescence level (expressed as a % by calibration; seeExperimental Procedures) measured after a CaCl2bolus of 3 or 30mM (3Ca or 30Ca) in heart and liver mitochondria.
(C) Mitochondrial clearance of [Ca2+]celevations induced by 50mM CaCl2addition.
(D)DJmmeasured with tetramethylrhodamine, methyl ester (TMRM). TMRM is used in de-quench mode; thus, the direction of polarization is downward. Note that heart mitochondria are the more polarized.
(E) [Ca2+]cdose response for the initial mitochondrial uptake of different Ca2+boluses in mouse liver (black) and heart (red) mitochondria. The CaCl2doses added were (inmM) 3, 5, 7, 10, 20, and 50 (n = 6 mice). A sigmoidal fit is displayed for each. x axis displays the measured peak [Ca2+]c.
(F) Double logarithmic plot of the initial rates of Ca2+uptake against the measured peak [Ca2+]c. Slope of each linear fit is indicated. Slopes calculated for both [Ca2+]cclearance and45Ca uptake (Figure 2D) show similar tissue-specific pattern, but for unclear reasons, the absolute values are consistently higher for the [Ca2+]cclearance.
Data are presented as mean±SEM; n = 3–4. See alsoFigure S1.
Cell Reports18, 2291–2300, March 7, 2017 2293
tissues, we calculated for the three tissues in each mouse the protein ratios among MICU1, MICU2, and MCU (Figures 3C–3E) and then the ratio of the45Ca uptake at low and high [Ca2+]c, which is higher when both threshold and cooperativity are low (Figure 3F). Only the MICU1:MCU ratio showed a com- plementing pattern with the mitochondrial Ca2+uptake pheno- type (Figures 3E and 3F). Indeed, both heart and muscle mito- chondria, which displayed lesser threshold and cooperativity of mtCU activation than liver mitochondria (Figure 3F), had a low MICU1:MCU ratio (Figure 3E), whereas their MICU1:MICU2 (Fig- ure 3C) and MICU2:MCU ratios (Figure 3D) were clearly oppo- site. Thus, the mitochondrial Ca2+uptake behavior for a popula- tion of mitochondria within a tissue seems to be dictated by the relative abundance of MICU1 and MCU.
To test the relevance of other components of the mtCU in its [Ca2+]-dependent regulation, the protein abundance of another mtCU regulator, MICU3, as well as EMRE was evaluated in liver, heart, and muscle mitochondria (Figure S2A). MICU3 was detectable only in skeletal muscle mitochondria, and EMRE level followed the MCU expression profile, i.e., significantly higher levels in skeletal muscle than heart and liver mitochondria (Fig-
ure S2B). Thus, neither MICU3 nor EMRE correlated with the tissue-specific [Ca2+] dependence of the mtCU. The lack of a reliable antibody precluded quantification of MCUb, but this protein is devoid of a known Ca2+-binding motif. Recently, a MICU1 splice variant, MICU1.1, was identified specifically in skeletal muscle as a positive regulator of the mtCU in the entire physiological range of [Ca2+]c(Vecellio Reane et al., 2016) and so could have contributed to the high mtCU Ca2+transport activity in skeletal muscle. Notably, both MICU1.1 and MICU1 are recog- nized by the MICU1 antibody used byVecellio Reane et al. (2016) and us, and the two isoforms are undistinguishable in western blot due to their close molecular weight. Collectively, these data seem to indicate a role for the MICU1:MCU ratio in vivo in the physiological tissue-specific control of mitochondrial Ca2+uptake.
MICU1:MCU Protein Expression Ratio Correlates Directly with MICU1 to MCU Association
An outstanding point remains whether the changes in MICU1 and MCU expression affect their association. Unfortunately, the lack of a reliable antibody for immunoprecipitation (IP) of Figure 2. Liver, Heart, and Skeletal Muscle Mitochondria Show Distinct Regulation of Mitochondrial45Ca2+Uptake
(A and B) Representative time courses of 45Ca2+accumulation in isolated liver, heart, and skeletal mitochondria in presence or absence of RuRed (3mM) after elevating [Ca2+]cmoderately (to 660 nM; A) or strongly (to 12mM; B) by the addition of a pre-titrated Ca2+bolus. Data are representative of n = 4 independent experiments with triplicates (mean±SEM).
(C) Mean values of the calculated45Ca accumulated from traces similar to (A) and (B), against three ranges of free [Ca2+]c.
(D) Double logarithmic plot of the RuRed-sensitive45Ca accumulated against the free [Ca2+]c15 s after the addition. n = 4 independent experiments with trip- licates.
endogenous MICU1 and MCU precluded co-IP experiments in mouse tissues. Therefore, co-IP of MCU-FLAG and varying amounts of MICU1-hemagglutin (HA) co-transfected to MICU1-knockout (KO) HEK cells was performed to establish different MICU1:MCU ratios. Based on the MCU-FLAG IP, increasing the MICU1 protein level (and so the MICU1:MCU ra-
tio) led to an essentially linear increase in the MICU1:MCU ratio in the IP, indicating a direct correlation between the MICU1 to MCU expression and association (Figures 3G and 3H). Further- more, the MICU1-HA IP showed that the MCU bound per MICU1 is unchanged by different levels of MICU1 expression (Figures 3G–3I), suggesting that, in a broad range of MICU1 Figure 3. MICU1 to MCU Protein Expression Ratio Correlates Directly with MICU1 to MCU Association to Control the Threshold and Cooperative Activation of Mitochondrial Ca2+Uptake in Tissues
(A) Representative immunoblotting in reducing conditions of MICU1, MICU2, MCU, and Hsp70 (mitochondrial loading control) in mice liver, heart, and skeletal muscle mitochondrial lysates.
(B) Relative protein level of MICU1, MICU2, and MCU is displayed in the bar graph for each protein relative to Hsp70 and normalized to liver mitochondria.
(C–E) Protein ratios of MICU1 to MICU2 (C), MICU2 to MCU (D), and MICU1 to MCU (E) calculated individually for each mouse.
(F) Ratio between the Ca2+accumulated at low [Ca2+]cand at high [Ca2+]c(fromFigure 2C) for each experiment.
Mean±SEM; n = 4; *p < 0.05.
(G) HEK cells were co-transfected with MCU-FLAG and different levels of MICU1-HA to generate different MICU1 to MCU ratios. MCU-FLAG and MICU1 HA were co-immunoprecipitated either with specific FLAG-agarose beads or HA-agarose beads.
(H) MICU1 to MCU ratio was calculated for the input and after the MCU-FLAG IP and normalized so that the values at the highest MICU1 to MCU ratio in the input were set to 1 for each experiment, indicated by the different shaped dot plots (n = 5). The linear fit indicates that the higher the MICU1 expression, the higher the MICU1 pulled down by MCU.
(I) Similar calculations were performed as in (H) for the MICU1-HA IP (n = 3). The linear fit shows that the amount of MCU units bound to MICU1 is not changed by increasing the MICU1 expression.
See alsoFigures S2andS3.
Cell Reports18, 2291–2300, March 7, 2017 2295
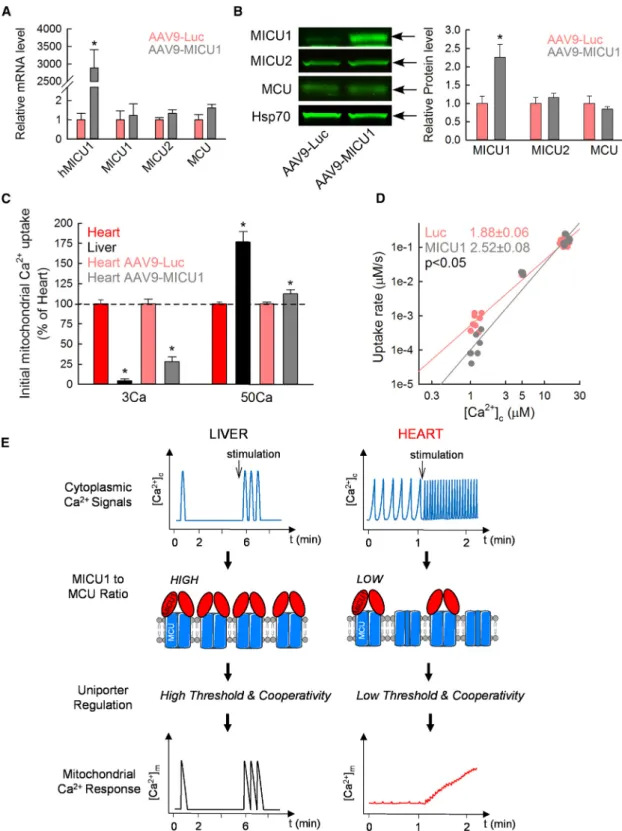
Figure 4. Increasing the MICU1 to MCU Ratio in the Heart Leads to a Liver-like mtCU Phenotype
(A) mRNA level of human MICU1 (hMICU1) and mouse MICU1, MICU2, and MCU in AAV9-Luc (red) and AAV9-MICU1 (black) heart 3 weeks after the virus injection. The relative mRNA is reported usingb-actin as a reference and normalized to the AAV9-Luc heart (mean±SEM; n = 4; *p < 0.05 versus AAV9-Luc).
(B) Protein expression of MICU1, MICU2, MCU, and Hsp70 in heart mitochondrial lysates from AAV9-Luc and AAV9-MICU1 3 weeks after injection. Level for each protein is shown relative to the loading control Hsp70 and normalized to AAV9-Luc heart mitochondria (mean±SEM; n = 4; *p < 0.05).
(legend continued on next page)
expression, MICU1 quantitatively binds MCU and some uni- porter complexes do not have MICU1. To summarize, MCU pulled down MICU1 proportionally to its relative abundance whereas MICU1 at various expression levels pulled down steady amounts of MCU, suggesting that MICU1:MCU ratio controls a binary balance between uniporter complexes with or without MICU.
Because the quantitative association of MICU1 and MCU was testable only in vitro, we decided to also test the control of mito- chondrial Ca2+uptake by changes in expression of MICU1 and MCU in cell culture. To this end, we either overexpressed MCU or silenced MICU1 in HeLa cells, with both resulting in reduced MICU1/2:MCU ratio (Figure S3A). To test whether the increased abundance of mtCUs without MICU1 would decrease the mtCU’s [Ca2+]cthreshold, we evaluated in intact cells [Ca2+]c
and [Ca2+]mduring store-operated Ca2+entry when most mito- chondria respond to the bulk [Ca2+]cincrease. Both MCU over- expression and MICU1 silencing accelerated the [Ca2+]m rise as displayed by the shorter lag between the [Ca2+]c and [Ca2+]mincreases (Figure S3B) and shorter coupling time (ctrl:
28.9±1.7 s versus MCU: 21.5±1.0 s; p < 0.05). In addition, as revealed by [Ca2+]mversus [Ca2+]cplots, lower [Ca2+]cwas sufficient to trigger a [Ca2+]mrise upon both MCU overexpres- sion and MICU1 silencing (Figure S3B, lower). Thus, both MCU overexpression and MICU1 silencing cause lesser thresholding of the mtCU phenotype in intact HeLa cells.
To confirm the effect of the MICUs to MCU ratio more directly on mitochondrial Ca2+uptake, we next measured the [Ca2+]min permeabilized cells using a ratiometric Ca2+probe, furaFF. Com- partmentalized furaFF displayed mitochondrial localization in permeabilized HeLa cells as shown by colocalization with TMRE or mitochondria-targeted GFP (Figure S3C). When Ca2+
was added, the increase in the furaFF ratio was abolished by RuRed (Figure S3D), validating that the compartmentalized furaFF signal reported [Ca2+]m. Cells overexpressing MCU dis- played a significant elevation of their resting [Ca2+]mcompared to Ctrl, which was prevented by RuRed (Figures S3D and S3F).
After a Ca2+pulse (1.5mM), a higher initial rate of RuRed-sensi- tive [Ca2+]mrise was observed in MCU-overexpressing cells than in Ctrl cells (Figure S3D). Similar findings, i.e., an increased resting [Ca2+]m and an accelerated [Ca2+]m rise, were also observed in MICU1-silenced HeLa cells (Figures S3E and S3F). Together, these results suggest that decreasing the MICU1/2:MCU ratio lowers the apparent [Ca2+]c threshold of the mtCU-mediated mitochondrial Ca2+ uptake in HeLa cells and thus support the idea that the threshold can be tuned also in vitro via shifting the balance between MCU complexes with and without MICU1. Among the three MICU isoforms, MICU3
is practically absent in HeLa cells, whereas both MICU1 and MICU2 showed similar changes in the above experiments, leav- ing the individual contribution of the two proteins unseparated.
Reprogramming Mitochondrial Ca2+Uptake by Perturbing MICU1 in Heart and Liver
Could mitochondrial Ca2+uptake be reprogrammed in liver and heart by perturbing the MICU:MCU ratio? To determine the ef- fect of MICU1 overexpression in the heart, mice were infected by tail-vein injection with an adeno-associated virus of serotype 9 (AAV9), including either the luciferase gene or the human MICU1 gene (AAV9-Luc and AAV9-MICU1). Three weeks after injection, the human MICU1 mRNA level was increased in the heart of AAV9-MICU1 mice without a significant change in MCU, MICU2, and MCUb (Figure 4A;Table S1). The increased MICU1 (but not MICU2 or MCU) protein expression was confirmed by immunoblotting (Figure 4B). As to the quantitative relationship between MICU and MCU, the AAV9-MICU1 mouse heart displayed a 2.6-fold increase of the MICU1:MCU and a 1.3-fold augmentation of the MICU2:MCU ratio (Figure S4A).
We then assessed the effect of MICU1 overexpression on the cardiac mitochondrial Ca2+ uptake. AAV9-MICU1 heart mito- chondria took up less Ca2+at submicromolar [Ca2+]cbut dis- played faster Ca2+clearance atR10mM [Ca2+]ccompared to AAV9-Luc Ctrl mitochondria (Figures 4C,S4B, and S4C). More- over, no limitation in theDJmwas observed between AAV9-Luc and AAV9-MICU1 heart mitochondria to explain the Ca2+uptake rate difference at high [Ca2+]c(Figure S4D). Comparison of the initial mitochondrial Ca2+ uptake between heart versus liver and AAV9-Luc versus AAV9-MICU1 heart mitochondria showed a significantly higher threshold at low [Ca2+]cand a significantly higher uptake at high [Ca2+]cin AAV9-MICU1 heart mitochondria and liver mitochondria compared to normal heart mitochondria (Figure 4C). It is worth noting that liver mitochondria displayed a greater uptake than MICU1-overexpressing heart mitochon- dria at high [Ca2+]c, which might be explained by the lower MCUb in liver (see mRNA in Table S1). Double logarithmic plot also revealed an increased cooperative activation in the AAV9-MICU1 heart mitochondria, as evidenced by the higher slope (Figure 4D; 2.52 ±0.08 in AAV9-MICU1 versus 1.88 ± 0.06 in AAV9-Luc; p < 0.05). Thus, the in vivo strategy to perturb MICU1 shows that increasing the MICU1:MCU ratio in the heart led to transition to a liver-like mitochondrial Ca2+uptake pheno- type, meaning an increased threshold and cooperativity of the mtCU activation. This point is further supported by a comple- mentary experiment, using in vivo silencing of MICU1 in liver, which demonstrated a lower [Ca2+]cthreshold and lesser posi- tive cooperativity of mitochondrial Ca2+uptake in association
(C) Comparison of the initial mitochondrial Ca2+uptake at low and high [Ca2+]cin non-infected mouse heart and liver mitochondria and in AAV9-Luc and AAV9-MICU1 heart mitochondria. Data are expressed as a percentage of heart for liver mitochondria and of AAV9-Luc for AAV9-MICU1 mouse heart mitochondria (n = 4–6; *p < 0.05 versus respective heart).
(D) Double logarithmic plot of the initial rates of Ca2+uptake against the measured peak [Ca2+]c. Slope of each linear fit is indicated (n = 5).
(E) Adaptation of mitochondrial decoding to the different temporal patterns of [Ca2+]csignals through the balance between MICU1-associated and MICU1-free MCU in mouse liver and heart. In hepatocytes, the high MICU1 to MCU ratio and so more abundant MICU1-associated MCU complexes, which lead to both high threshold and cooperativity of their uniporters, allow rapid and highly effective propagation of each [Ca2+]cspike to the mitochondria. In cardiomyocytes, which display a low MICU1 to MCU ratio and thus a higher abundance of MICU1-free MCU with low threshold and cooperativity, the [Ca2+]ctransients are integrated into a more continuous [Ca2+]mincrease, the magnitude of which depends on the frequency of [Ca2+]coscillations.
See alsoFigure S4andTable S1.
Cell Reports18, 2291–2300, March 7, 2017 2297
with the decrease in the MICU1:MCU ratio (Antony et al., 2016;
Csorda´s et al., 2013). Collectively, these results strongly support a specific and major role for the MICU1:MCU ratio and thus the relative abundance of MICU1-associated and MICU1-free uniporters in the tissue-specific regulation of mitochondrial Ca2+uptake in mice.
Recently, MCU has been shown to be dispensable for base- line cardiac function but required for the fight-or-flight response (Kwong et al., 2015; Luongo et al., 2015). We wondered whether reprogramming of the mitochondrial Ca2+ uptake by MICU1 would affect cardiac physiology. AAV9-MICU1 and AAV9-Luc mice were subjected to echocardiography: we observed a significant decrease in both ejection fraction and fractional shortening (respectively 66% ± 3% versus 57% ± 2% and 36%±2% versus 29%±1%; AAV9-Luc versus AAV9-MICU1;
p < 0.05; n = 9–10), indicating a contractile impairment in the AAV9-MICU1 mice. These results suggest that the low MICU1 level in the heart is required to properly decode the cytoplasmic Ca2+signals by the mitochondria (Figure 4E) and to optimize contractile function.
DISCUSSION
Here, we report that the expression of MICU1 relative to MCU and, in turn, their association into the mtCU complex with or without MICU1 is central to the tissue-specific differences in mitochondrial Ca2+uptake and Ca2+-stimulated oxidative meta- bolism phenotypes. Specifically, MICU1 to MCU stoichiometry encodes the differential [Ca2+] dependence between hepatic and cardiac mitochondria, contributing to the fundamental mechanism that allows rapid and highly effective propagation of each [Ca2+]cspike to mitochondria in hepatocytes and a lesser mitochondrial response to individual [Ca2+]c oscillations in mouse cardiomyocytes that beat continually at 400–600/min rate. Thus, our data unravel a mechanism that might be central to determining spike-to-spike versus slow spike integration modes of mitochondrial Ca2+signaling (Figure 4E).
Previous studies have documented differences between Ca2+uptake by liver and heart mitochondria (Buntinas et al., 2001; Williams et al., 2013), which we systematically analyzed by recording [Ca2+] dependence under identical conditions for the two tissues. These studies demonstrated that heart mito- chondria have lesser maximal Ca2+uptake capacity and less steep non-linear [Ca2+] dependence than liver mitochondria.
The difference in Ca2+uptake capacity, which is also supported by electrophysiology (Fieni et al., 2012), might result from the relatively high cardiac MCUb expression. As to the differential [Ca2+] dependence, we speculated that it is likely related to MICUs because only these mtCU components display EF hand extramitochondrial Ca2+-sensing modules. Indeed, we demon- strated that MICU1 protein is scarcely present in the heart.
MICU2, which seems to contribute to the regulation of mtCU by forming dimers with MICU1 (Kamer and Mootha, 2014; Patron et al., 2014), showed less striking expression level differences between heart and liver. Strikingly, we could reproduce both car- diac- and liver-like [Ca2+] dependency patterns in model cells by altering the MICU1 to MCU stoichiometry. Also, by increasing MICU1, we could reprogram heart mitochondria to show a liver
phenotype of [Ca2+] dependency, which led to a contractile dysfunction. Because the heart still expresses a very low level of MICU1 protein, it means that there are a few MCU complexes interacting with MICU1 in the heart, but the balance is strongly shifted toward the MICU1-free uniporters, resulting in a low- threshold mitochondrial Ca2+ phenotype. One could wonder whether different Ca2+transporters and buffering systems in liver and heart could also explain the tissue specificity. However, our Ca2+ uptake experiments were specific for the mtCU (RuRed validation; inhibition of Ca2+efflux). Thus, our results support that the relative abundance of MICU1 and MCU determines the proportion of mtCU with and without MICU1, which results in physiological differences in mitochondrial Ca2+sensing.
The potential physiological and pathophysiological signifi- cance of the distinct [Ca2+] dependence in heart and liver is broad. In H9c2 cardiac myotubes that have little spontaneous activity, we have shown that even a single [Ca2+]cspark can be propagated to an adjacent mitochondrion to evoke a [Ca2+]m
mark (Pacher et al., 2002), and in rabbit, rat, and guinea pig my- ocytes that display 400 Hz [Ca2+]c oscillations, beat-to-beat [Ca2+]m responses have been documented (Andrienko et al., 2009; Maack et al., 2006; Robert et al., 2001; Trollinger et al., 2000). However, at the even higher beating frequency of mouse heart, suppressing the response to individual Ca2+transients and integration of frequency fluctuations is practical to avoid mitochondrial Ca2+overload. In mouse cardiomyocytes, which display a low MICU1 to MCU ratio and thus a low threshold and cooperativity of most of their uniporters, the very short [Ca2+]ctransients are associated with very small mitochondrial Ca2+ uptake that is integrated into frequency-modulated [Ca2+]msteady-state shifts rather than [Ca2+]moscillations. By contrast, the high MICU1 and cooperative activation of mtCU in the liver favors delivery of each individual [Ca2+]cspike to the mitochondria in hepatocytes (Csorda´s et al., 2013). These differ- ences are depicted in the schematic ofFigure 4E. Interestingly, heart mitochondria also display a higher NCLX level than liver mitochondria (data not shown), suggesting that higher mito- chondrial Ca2+efflux in heart may be required for preventing mitochondrial Ca2+overload.
In summary, our work identifies the MICU1 to MCU ratio as a physiological regulator of the mitochondrial Ca2+uptake pheno- type in tissues, contributing to the tissue-specific decoding of [Ca2+]c oscillations toward differentially regulating oxidative metabolism in liver and heart. In light of the recent description of mitochondrial disease linked to loss-of-function MICU1 muta- tions (Logan et al., 2014), the delicate balance of MICU1 and MCU likely is important in humans and in a variety of tissues, including nervous tissue and skeletal muscle.
EXPERIMENTAL PROCEDURES
Detailed protocols are available in the Supplemental Experimental Procedures.
Animals
Mice were bred by homozygous intercross. Studies were done in accordance with the Thomas Jefferson University institutional review board guidelines. Fe- male mice were used for the isolation of liver and heart mitochondria. For MICU1 overexpression, tail-vein injection was performed on male mice at
10 weeks old with 631011genome copies (GCs)/mouse of AAV9-luciferase or AAV9-MICU1.
Heart, Skeletal Muscle, and Liver Mitochondria Isolation
Mice were euthanized by cervical dislocation. Heart, muscle, and liver mito- chondria were isolated by differential centrifugations from the same mice.
Live-Cell Imaging and Fluorometric Measurements of Mitochondrial Ca2+Uptake, Membrane Potential, and NADH
[Ca2+]m, [Ca2+]c, andDJmwere measured as described (Csorda´s et al., 2013).
NAD(P)H autofluorescence was monitored with excitation at 360 nm and emis- sion at 450 nm, whereas [Ca2+]cwas recorded simultaneously with rhod2 using 545 nm excitation and 580 nm emission. The mitochondrial NAD(P)H oxidation state was calibrated by applying 5mM rotenone and 2mM carbonyl cyanide- 4-(trifluoromethoxy)phenylhydrazone (FCCP) at the end of each recording.
Tg and CGP-37157 were present in all measurements.
Measurements of45Ca Uptake by Isolated Mitochondria
Mitochondria (250mg/mL) were resuspended in intracellular medium (ICM) containing 2mM Tg, 20mM CGP-37157, and 10mM EGTA. Mitochondria were energized by 1 mM malate/pyruvate at 37C. Subsequently, suspensions were mixed with different amounts of45Ca in the absence or presence of RuRed (3mM). At 15-s and 30-s time points, 100-mL aliquots were stopped and45Ca in the mitochondria was quantified as described (Csorda´s et al., 2013). Free [Ca2+]cwas measured separately by fluorometric measurements using fura2 or furaFF.
Statistical Analysis
Data are expressed as mean±SEM. Experiments were performed at least three times in duplicates or more. Statistical analysis was performed using the Student’s t test, paired t test, or Mann-Whitney rank sum test when comparing two groups and ANOVA-1 followed by a Student-Newman-Keuls post hoc test for comparisons between multiple groups.
SUPPLEMENTAL INFORMATION
Supplemental Information includes Supplemental Experimental Procedures, four figures, and one table and can be found with this article online athttp://
dx.doi.org/10.1016/j.celrep.2017.02.032.
AUTHOR CONTRIBUTIONS
Conceptualization, G.H., G.C., E.L.S., and M.P.; Investigation, G.H., G.C., E.L.S., M.P., C.M., T.G., V.D., A.B., and N.W.; Writing, G.H., G.C., E.L.S., M.P., and A.S.; Funding Acquisition, G.H.; Supervision, A.S. and G.S.
ACKNOWLEDGMENTS
M.P. was a recipient of postdoctoral fellowships from La Fondation pour la Recherche Me´dicale (FRM; SPE 20130326561) and American Heart Associa- tion (14POST19830021) and a grant ‘‘Aide a` la mobilite´’’ from the Institut Serv- ier (France). A.B. was awarded a Hungarian State Eotvos Fellowship from the Tempus Public Foundation. The study was funded by an NIH grant (RO1 GM102724) to G.H.
Received: October 1, 2015 Revised: December 29, 2016 Accepted: February 9, 2017 Published: March 7, 2017 REFERENCES
Andrienko, T.N., Picht, E., and Bers, D.M. (2009). Mitochondrial free calcium regulation during sarcoplasmic reticulum calcium release in rat cardiac myo- cytes. J. Mol. Cell. Cardiol.46, 1027–1036.
Antony, A.N., Paillard, M., Moffat, C., Juskeviciute, E., Correnti, J., Bolon, B., Rubin, E., Csorda´s, G., Seifert, E.L., Hoek, J.B., and Hajno´czky, G. (2016).
MICU1 regulation of mitochondrial Ca(2+) uptake dictates survival and tissue regeneration. Nat. Commun.7, 10955.
Baughman, J.M., Perocchi, F., Girgis, H.S., Plovanich, M., Belcher-Timme, C.A., Sancak, Y., Bao, X.R., Strittmatter, L., Goldberger, O., Bogorad, R.L., et al. (2011). Integrative genomics identifies MCU as an essential component of the mitochondrial calcium uniporter. Nature476, 341–345.
Buntinas, L., Gunter, K.K., Sparagna, G.C., and Gunter, T.E. (2001). The rapid mode of calcium uptake into heart mitochondria (RaM): comparison to RaM in liver mitochondria. Biochim. Biophys. Acta1504, 248–261.
Chaudhuri, D., Sancak, Y., Mootha, V.K., and Clapham, D.E. (2013). MCU en- codes the pore conducting mitochondrial calcium currents. eLife2, e00704.
Csorda´s, G., Golena´r, T., Seifert, E.L., Kamer, K.J., Sancak, Y., Perocchi, F., Moffat, C., Weaver, D., de la Fuente Perez, S., Bogorad, R., et al. (2013).
MICU1 controls both the threshold and cooperative activation of the mito- chondrial Ca2+uniporter. Cell Metab.17, 976–987.
De Stefani, D., Raffaello, A., Teardo, E., Szabo`, I., and Rizzuto, R. (2011). A forty-kilodalton protein of the inner membrane is the mitochondrial calcium uniporter. Nature476, 336–340.
De Stefani, D., Rizzuto, R., and Pozzan, T. (2016). Enjoy the trip: calcium in mitochondria back and forth. Annu. Rev. Biochem.85, 161–192.
Fieni, F., Lee, S.B., Jan, Y.N., and Kirichok, Y. (2012). Activity of the mitochon- drial calcium uniporter varies greatly between tissues. Nat. Commun.3, 1317.
Griffiths, E.J., and Rutter, G.A. (2009). Mitochondrial calcium as a key regulator of mitochondrial ATP production in mammalian cells. Biochim. Biophys. Acta 1787, 1324–1333.
Hajno´czky, G., Robb-Gaspers, L.D., Seitz, M.B., and Thomas, A.P. (1995). De- coding of cytosolic calcium oscillations in the mitochondria. Cell82, 415–424.
Hung, V., Zou, P., Rhee, H.W., Udeshi, N.D., Cracan, V., Svinkina, T., Carr, S.A., Mootha, V.K., and Ting, A.Y. (2014). Proteomic mapping of the human mitochondrial intermembrane space in live cells via ratiometric APEX tagging.
Mol. Cell55, 332–341.
Kamer, K.J., and Mootha, V.K. (2014). MICU1 and MICU2 play nonredundant roles in the regulation of the mitochondrial calcium uniporter. EMBO Rep.15, 299–307.
Kwong, J.Q., Lu, X., Correll, R.N., Schwanekamp, J.A., Vagnozzi, R.J., Sar- gent, M.A., York, A.J., Zhang, J., Bers, D.M., and Molkentin, J.D. (2015). The mitochondrial calcium uniporter selectively matches metabolic output to acute contractile stress in the heart. Cell Rep.12, 15–22.
Logan, C.V., Szabadkai, G., Sharpe, J.A., Parry, D.A., Torelli, S., Childs, A.M., Kriek, M., Phadke, R., Johnson, C.A., Roberts, N.Y., et al.; UK10K Consortium (2014). Loss-of-function mutations in MICU1 cause a brain and muscle disor- der linked to primary alterations in mitochondrial calcium signaling. Nat. Genet.
46, 188–193.
Luongo, T.S., Lambert, J.P., Yuan, A., Zhang, X., Gross, P., Song, J., Shan- mughapriya, S., Gao, E., Jain, M., Houser, S.R., et al. (2015). The mitochondrial calcium uniporter matches energetic supply with cardiac workload during stress and modulates permeability transition. Cell Rep.12, 23–34.
Maack, C., Cortassa, S., Aon, M.A., Ganesan, A.N., Liu, T., and O’Rourke, B.
(2006). Elevated cytosolic Na+ decreases mitochondrial Ca2+ uptake during excitation-contraction coupling and impairs energetic adaptation in cardiac myocytes. Circ. Res.99, 172–182.
Mallilankaraman, K., Doonan, P., Ca´rdenas, C., Chandramoorthy, H.C., M€uller, M., Miller, R., Hoffman, N.E., Gandhirajan, R.K., Molgo´, J., Birnbaum, M.J., et al. (2012a). MICU1 is an essential gatekeeper for MCU-mediated mitochon- drial Ca(2+) uptake that regulates cell survival. Cell151, 630–644.
Mallilankaraman, K., Ca´rdenas, C., Doonan, P.J., Chandramoorthy, H.C., Irrinki, K.M., Golena´r, T., Csorda´s, G., Madireddi, P., Yang, J., M€uller, M., et al. (2012b). MCUR1 is an essential component of mitochondrial Ca2+ up- take that regulates cellular metabolism. Nat. Cell Biol.14, 1336–1343.
Cell Reports18, 2291–2300, March 7, 2017 2299
Pacher, P., Thomas, A.P., and Hajno´czky, G. (2002). Ca2+ marks: miniature calcium signals in single mitochondria driven by ryanodine receptors. Proc.
Natl. Acad. Sci. USA99, 2380–2385.
Pan, X., Liu, J., Nguyen, T., Liu, C., Sun, J., Teng, Y., Fergusson, M.M., Rovira, I.I., Allen, M., Springer, D.A., et al. (2013). The physiological role of mitochon- drial calcium revealed by mice lacking the mitochondrial calcium uniporter.
Nat. Cell Biol.15, 1464–1472.
Patron, M., Checchetto, V., Raffaello, A., Teardo, E., Vecellio Reane, D., Man- toan, M., Granatiero, V., Szabo`, I., De Stefani, D., and Rizzuto, R. (2014).
MICU1 and MICU2 finely tune the mitochondrial Ca2+ uniporter by exerting opposite effects on MCU activity. Mol. Cell53, 726–737.
Perocchi, F., Gohil, V.M., Girgis, H.S., Bao, X.R., McCombs, J.E., Palmer, A.E., and Mootha, V.K. (2010). MICU1 encodes a mitochondrial EF hand protein required for Ca(2+) uptake. Nature467, 291–296.
Plovanich, M., Bogorad, R.L., Sancak, Y., Kamer, K.J., Strittmatter, L., Li, A.A., Girgis, H.S., Kuchimanchi, S., De Groot, J., Speciner, L., et al. (2013). MICU2, a paralog of MICU1, resides within the mitochondrial uniporter complex to regu- late calcium handling. PLoS ONE8, e55785.
Raffaello, A., De Stefani, D., Sabbadin, D., Teardo, E., Merli, G., Picard, A., Checchetto, V., Moro, S., Szabo`, I., and Rizzuto, R. (2013). The mitochondrial calcium uniporter is a multimer that can include a dominant-negative pore- forming subunit. EMBO J.32, 2362–2376.
Robb-Gaspers, L.D., Burnett, P., Rutter, G.A., Denton, R.M., Rizzuto, R., and Thomas, A.P. (1998). Integrating cytosolic calcium signals into mitochondrial metabolic responses. EMBO J.17, 4987–5000.
Robert, V., Gurlini, P., Tosello, V., Nagai, T., Miyawaki, A., Di Lisa, F., and Poz- zan, T. (2001). Beat-to-beat oscillations of mitochondrial [Ca2+] in cardiac cells. EMBO J.20, 4998–5007.
Sancak, Y., Markhard, A.L., Kitami, T., Kova´cs-Bogda´n, E., Kamer, K.J., Ude- shi, N.D., Carr, S.A., Chaudhuri, D., Clapham, D.E., Li, A.A., et al. (2013). EMRE is an essential component of the mitochondrial calcium uniporter complex.
Science342, 1379–1382.
Trollinger, D.R., Cascio, W.E., and Lemasters, J.J. (2000). Mitochondrial cal- cium transients in adult rabbit cardiac myocytes: inhibition by ruthenium red and artifacts caused by lysosomal loading of Ca(2+)-indicating fluorophores.
Biophys. J.79, 39–50.
Vecellio Reane, D., Vallese, F., Checchetto, V., Acquasaliente, L., Butera, G., De Filippis, V., Szabo`, I., Zanotti, G., Rizzuto, R., and Raffaello, A. (2016). A MICU1 splice variant confers high sensitivity to the mitochondrial Ca(2+) up- take machinery of skeletal muscle. Mol. Cell64, 760–773.
Wang, L., Yang, X., Li, S., Wang, Z., Liu, Y., Feng, J., Zhu, Y., and Shen, Y.
(2014). Structural and mechanistic insights into MICU1 regulation of mitochon- drial calcium uptake. EMBO J.33, 594–604.
Williams, G.S., Boyman, L., Chikando, A.C., Khairallah, R.J., and Lederer, W.J.
(2013). Mitochondrial calcium uptake. Proc. Natl. Acad. Sci. USA110, 10479–
10486.