Dissimilar flexibility of α and β subunits of human adult hemoglobin influences the protein dynamics and its alteration induced by allosteric effectors
Guszta´v Schay☯, Andra´s D. Kaposi‡, La´szlo´ Smeller‡, Krisztia´n Szigeti‡, Judit Fidy☯, Levente Herenyi*☯
Department of Biophysics and Radiation Biology, Semmelweis University, Budapest, Hungary
☯These authors contributed equally to this work.
‡ These authors also contributed equally to this work.
*herenyi.levente@med.semmelweis-univ.hu
Abstract
The general question by what mechanism an “effector” molecule and the hemes of hemo- globin interact over widely separated intramolecular distances to change the oxygen affinity has been extensively investigated, and still has remained of central interest. In the present work we were interested in clarifying the general role of the protein matrix and its dynamics in the regulation of human adult hemoglobin (HbA). We used a spectroscopy approach that yields the compressibility (κ) of the protein matrix around the hemes of the subunits in HbA and studied how the binding of heterotropic allosteric effectors modify this parameter.κis directly related to the variance of volume fluctuation, therefore it characterizes the molecular dynamics of the protein structure. For the experiments the heme groups either in theαor in theβsubunits of HbA were replaced by fluorescent Zn-protoporphyrinIX, and series of fluo- rescence line narrowed spectra were measured at varied pressures. The evaluation of the spectra yielded the compressibility that showed significant dynamic asymmetry between the subunits:κof theαsubunit was 0.17±0.05/GPa, while for theβsubunit it was much higher, 0.36±0.07/GPa. The heterotropic effectors, chloride ions, inositol hexaphosphate and beza- fibrate did not cause significant changes inκof theαsubunits, while in theβsubunits the effectors lead to a significant reduction down to 0.15±0.04/GPa. We relate our results to structural data, to results of recent functional studies and to those of molecular dynamics simulations, and find good agreements. The observed asymmetry in the flexibility suggests a distinct role of the subunits in the regulation of Hb that results in the observed changes of the oxygen binding capability.
Introduction
Allosteric effect is a widely used term in biochemistry and biophysics that means in general the functional modulation of an active site brought about by the binding of ligands at a distant site a1111111111
a1111111111 a1111111111 a1111111111 a1111111111
OPEN ACCESS
Citation: Schay G, Kaposi AD, Smeller L, Szigeti K, Fidy J, Herenyi L (2018) Dissimilar flexibility ofα andβsubunits of human adult hemoglobin influences the protein dynamics and its alteration induced by allosteric effectors. PLoS ONE 13(3):
e0194994.https://doi.org/10.1371/journal.
pone.0194994
Editor: Eugene A. Permyakov, Russian Academy of Medical Sciences, RUSSIAN FEDERATION
Received: December 15, 2017 Accepted: March 14, 2018 Published: March 27, 2018
Copyright:©2018 Schay et al. This is an open access article distributed under the terms of the Creative Commons Attribution License, which permits unrestricted use, distribution, and reproduction in any medium, provided the original author and source are credited.
Data Availability Statement: All relevant data are within the paper.
Funding: This work was supported by VKSZ_14-1- 2015-0052, Semmelweis Egyetem,http://nkfih.
gov.hu/palyazatok/ktia/tamogatott-projektek/2015/
vksz-14. The funders had no role in study design, data collection and analysis, decision to publish, or preparation of the manuscript.
Competing interests: The authors have declared that no competing interests exist.
on the same molecule [1,2]. These ligands are called “allosteric effectors”. If they are identical with the basic ligand of the protein we use the term “homotropic” effectors, in other cases they are called “heterotropic” effectors. Cooperativity of oxygen binding in this context is a homo- tropic allosteric effect. Hemoglobin that is essential in binding, transporting and offloading oxygen from the lungs to the tissues to respiring cells is one of the most widely studied biomol- ecules. Human adult hemoglobin (HbA) is the classic example of an allosteric protein. HbA is a homo-dimer (α1β1)(α2β2) of two hetero-dimers, (αβ). Each of the monomers consists of one polypeptide chain,αof 141,βof 146 amino acid residues forming 7 and 8α-helices, respec- tively (named A to H, but helix D inβchains has no equivalent in theαsubunits). Each sub- unit contains one protoheme IX as the prosthetic group, to which one O2can bind reversibly [3–5] (see Figs1and2). O2binding to one prosthetic group is known to be allosterically regu- lated both by O2binding to that of another subunit (homotropic effect), and by binding spe- cific other molecules (heterotropic effect).
Several models have been developed to explain the function of Hb. Here we just give a short summary as an enumeration however the reader can find a longer but concise overview at the end of the paper (see Appendix III).
The first classic model has been the “two-state allosteric model” (or MWC model) of Monod, Wyman, and Changeau [7–9] which was structurally interpreted by Perutz in his “ste- reochemical model” [10]. The “sequential model” (or KNF model) of Koshland, Nemethy and Filmer [11] meant another approach to the interpretation of allostery. The newer “ensemble allostery model” (EAM) combined the earlier ones [12] and a recent article emphasizes the chemical perspective on allostery [13].
Based on the literature we conclude that the global mechanism is similar in the case of homo- tropic and heterotropic effects. In connection with heterotropic effects some inconsistencies occurred [14] but the “tertiary two state model” (TTS model) managed to solve the problem [15]. According to another approach some data initiated the reformulation of the earlier models by the “global allostery model” [16,17]. Earlier in our research group it was also demonstrated both by an experimental technique and by computational modeling, that conformational changes induced by the binding of the heterotropic allosteric effectors Chloride ions (Cl-), Inosi- tol Hexaphosphate (IHP) and Bezafibrate (BZF), influenced the interdimeric interfaces of Hb in both conformational states, supporting the global allostery model [18,19]. The detailed mecha- nism of structural rearrangements was also studied by the Perahia group [20,21].
Finally, we have to mention the work of Tsai and Nussinov, they presented a “unified view about allostery” [22,23].
Besides the global symmetry of Hb a structural asymmetry ofαandβsubunits is conspicu- ous. Recently an interesting functional difference was demonstrated. Using resonance Raman spectroscopy in silica gel, which greatly slows protein motions, the evolution of the Fe-His stretching frequency after CO photodissociation (which is a monitor of heme reactivity from state R to T) is faster forβ(Fe-His) than forα(Fe-His) [24]. Another research group showed distinct roles ofαandβsubunits in O2binding with the help of cavity mutant HbA-s [25]. The Hill plots of the two mutants, in which the Fe-His bond was cleared is very different (Fig 3).
Theαmutant of recombinant Hb (rHb(α)) has biphasic O2binding, while theβmutant (rHb (β)) is locked into more or less one state, similarly to Mb. The authors also pointed out, that the detachment of the F-helix from the heme in theβsubunits causes an increase of O2affinity in theαsubunits whose hemes are attached to the F-helix.
If conformational dynamics play decisive role in Hb allostery, and experimental data sug- gest an asymmetric role of theαandβsubunits, then this asymmetry should be observable more directly. To prove this hypothesis, we applied an experimental approach to this problem that resulted in the characterization of subunit dynamics as it became modified by binding
heterotropic allosteric effectors. The selected technique has been pressure tuning Fluorescence Line Narrowing spectroscopy (FLN), and by using proper hybrid Hb samples, the dynamics of the subunits could be separately studied and characterized by the compressibility of the protein matrix around the heme group.
Pressure tuning FLN spectroscopy for compressibility determination Fluorescence line narrowing (FLN) spectroscopy is a high-resolution, laser excitation spectros- copy technique performed at cryogenic temperatures. (For general discussion of this technique
Fig 1. Amino acid sequence of hemoglobin (HbA) inαandβsubunits.α-helices are denoted by capital letters (with numbers) from A to H. Minor deviations because of the absence of amino acid are marked with green ellipses, the major, dominant difference marked with red ellipse in D helix. Distal (E7) and proximal (F8) histidines (H) are also denoted.
https://doi.org/10.1371/journal.pone.0194994.g001
see relevant papers and reviews [26–28]. A short summary is given in Appendix I.) It has been shown that the method may also be successfully used when the matrix surrounding the fluoro- phore is a protein [29,30]. The outcome of an FLN experiment is a series of fluorescence spec- tra resolved for vibronic transitions, and the evaluation yields the so called inhomogeneous distribution function (IDF) of the (0, 0) electronic transition energy (see Appendix I). The spectral broadening of this distribution function is caused by the inhomogeneity of the matrix around the fluorophore, in our case the slightly different local structure of hybrid Hb mole- cules around the modified heme. This inhomogeneity arises from the changing interaction between the chromophore and its environments due to the continuous temporal random fluc- tuation of the protein. A sudden cooling of the protein solution to cryogenic temperatures will freeze the chromophore environments into their present status and this ensemble of protein molecules can be characterized by the IDF.
We applied this technique combined with pressure tuning to obtain information about the dynamics of hemoglobin subunits. The fluorophores were Zn-protoporphyrinIX molecules replacing the heme either in theαor in theβsubunits. Oxygen equilibrium studies and x-ray crystallography have shown that this derivative, as a five-coordinated metal hybrid of HbA,
Fig 2. Structure ofβsubunits of hemoglobin (β-HbA).α-helices are shown as cylinders, number of amino acids of segments is marked with colored digits: red forα-helices, green for loops (gray in the brackets refers toαsubunit). The heme group is stabilized by the distal (E7H) and proximal (F8H) histidines. Helix D is marked with red ellipse as the dominant difference betweenβandαsubunits [6]. The transparent colored discs denote the estimated vicinity of the heme of which is characterized by the compressibility in the present work. Yellow and green area mean the spheres with radiusR98%andR99%, labelling a rage of estimation with 2% and with 1% error respectively (see Appendix II).
https://doi.org/10.1371/journal.pone.0194994.g002
can be considered analogous to T-state HbA [31]. According to the basics of statistical physics (see for example Ref. [32]). the variance of the volume fluctuations of a system–arising from conformational dynamics in a protein–is directly related to its compressibilityκ:
hðV hViÞ2i ¼kkThVi; ð1Þ
whereVis the volume,Tis the temperature,kis the Boltzmann-constant and angle brackets denote the expected value (averaging). It can be shown that FLN measurements performed at varied hydrostatic pressures may yield theκof the matrix (protein) surrounding the fluoro- phore. Since the sample is at cryogenic temperatures, in the frozen state denaturation is not expected to occur, even at very high pressures, because the surface of the protein is firmly bound to a solid matrix. As a consequence of pressurization, a shift and a broadening can be observed on the IDF of the fluorophore determined by FLN, andκcan be calculated from these changes as follows. The pressure-induced shift of a specific electronic transition was the- oretically interpreted by Laird and Skinner [33]. According to their theory, the frequency of a spectral line of an optical transition under pressurepis given by the equation:
np¼n0þ2ðn0 nvacÞkp¼n0þ2nskp ð2Þ
whereν0is the frequency of a spectral line at normal pressure,νvacis the so called vacuum fre- quency, where the chromophore would absorb light in the absence of the matrix.νs, the
Fig 3. O2binding curves (Hill plots) of cavity mutants and native human HbA in the absence and presence of IHP (dotted and continues lines respectively), and that of sperm whale Mb (dashed straight line): rHb(α) in blue, rHb (β) in red, HbA in green color. (Data adapted from Ref. [25].)Yis the fractional oxygen saturation andpO2is the partial pressure of oxygen, pH = 7.4. Tangent of the curves is characterized by two parameters: the slope of the straight line being the Hill coefficient and the intercept with theY/(1-Y) = 1 line (p50) being proportional to the apparent dissociation constant.
https://doi.org/10.1371/journal.pone.0194994.g003
difference ofν0andνvacis called as the solvent shift. This theory was generalized by Smeller and Fidy for IDF-s [34]. Assuming normal distribution, the shift and the corresponding broad- ening of the IDF can be calculated:
n0p ¼n00þ2kpðn0sÞ ð3Þ
sp ¼ ð1þ2kpÞs0 ð4Þ
where the extra “0”-s in the indices ofνemphasize the fact that the parameter corresponds to the center of the normal distribution,?is the width of the normal distribution. It is noticeable that the center of the IDF shifts under pressure the same way as the individual spectral lines do. The slope of both the shift and the broadening on the frequency scale is proportional to the κ, and thus to the extent of volume fluctuation of the measured system (hemoglobin subunits).
Here we have to make two remarks. While in the outlined technique the compressibility is determined at cryogenic temperatures, we think that this parameter is a rather good approxi- mation for the compressibility at room temperature. It is reasonable to suppose that the IDF accounts for almost all states of conformational fluctuations of room temperature, but in “fro- zen” phase. We measure the pressure effect on this conformational population, and think that it should not be different when the motions are activated and the elements of the distribution are switching between each other at room temperature. Experimental results obtained on the protein horseradish peroxidase showed excellent agreement between the compressibility obtained by FLN at 10 K and that obtained by ultrasound velocity technique at room tempera- ture [34].
We also have to remark that in the case of Hb the compressibility as global parameter mea- sured by the present technique is characteristic for the protein matrix near the heme group and not for longer distance. Nevertheless, there is a crucial question: can we determine more precisely what is the range of chromophores’ interaction with the environment? We may get a lower limit from Ref. [35] for cytochrome c, but the estimation based on hole-burning experi- ments, where the applied pressure is much smaller than in pressure tuning FLN. Thus we take a different approach in Appendix II to estimate the interaction volume “visible” to the reporter chromophore in FLN experiments. From this estimation we can assume that the compressibil- ity values are referring to approximately the size of a single monomer (see the transparent col- ored discs inFig 2).
In this paper we show that this method is capable of yielding an experimental parameter (κ) related to protein conformational dynamics and our presented data clearly support the sug- gested asymmetry in the role of theαandβsubunits in Hb allostery and in the influence of heterotropic allosteric effectors. We think that these data unravel the structural background of other experimental observations and serve as new experimental support for the results of molecular dynamics simulations.
Materials and methods Chemicals
Chemicals such as sodium chloride (NaCl), 4-(2-hydroxyethyl)-1-piperazineethanesulfonic acid (HEPES), inositol hexaphosphate (IHP), and bezafibrate (BZF), the highest purity avail- able, were purchased from Sigma-Aldrich. All samples were prepared in 100 mM HEPES, pH 7.4 with double distilled water. IHP was used in a final concentration of 2 mM, BZF in 10 mM, and the NaCl concentration was 100 mM. All the allosteric effectors were added in a concen- tration to ensure saturation of the binding sites (of 60μM protein).
Sample preparation
The experiments were performed on hybrid human HbA with Zn-PP substituting the heme either in theαor in theβsubunits (Zn-HbA) that were prepared in Prof. T. Yonetani’s labora- tory at University of Pennsylvania (Philadelphia, USA) as described in Ref. [17], and kindly provided for our experiments. Samples were stored at -80˚C and their quality after thawing was checked before further experiments by recording an absorption spectrum in the 270–700 nm wavelength range. Only samples with no detectable deterioration were used. All samples were adjusted to 60μM final Zn-HbA concentration in 50% v/v glycerol-buffer solution (pH = 7.4) before measurement. The sample quality was controlled by absorption spectroscopy after each experiments at ambient pressures and temperatures and no significant changes were detected due to the addition of various effectors or the pressure changes.
Experimental setup
For the FLN experiment a Coherent 899–01 ring dye laser pumped by a Coherent Innova 307 Ar-ion laser was used. The dye used for excitation was Rhodamine 560 (Exciton Laser Dyes).
The spectral width of the laser line was 0.7 cm-1, the output power was 1 mW. Fluorescence emission was collected at approximately 35˚ angle relative to excitation and focused into a THR 1000 monochromator (Jobin-Yvon). For detection a CCD camera (WR CCD-4679 DV401-BV, Andor Technology) cooled to -65˚ C was used, mounted at the exit slit of the monochromator with a final resolution better than 1 cm-1in the whole measured spectral range. Integration time was 40 s for each spectrum. The sample was maintained at 10 K inside a diamond anvil cell with a closed cycle M22 cryostat (Cryophysics SA) equipped with a Model-330 auto-tuning temperature controller (Lake Shore Inc.). Typical pressure inside the cryostat was 10−5bar, it was monitored with a model AGD-101-L Pirani-gauge (Edwards High Vacuum International), and was generated with a rotary vacuum pump (model RV5, Edwards High Vacuum International). Spectra were analyzed by a custom-designed software package (“IdfFit”), which also allow for the wavenumber-calibration of the CCD camera. Pressure was adjusted with helium gas in the special low-temperature diamond anvil cell (Diacell Products).
This cell of 40 nl volume allows for applying pressures in the range of 0–1.5 GPa. Small ruby crystals inside the frozen sample were used for the pressure determination [36]. The accuracy of the pressure values measured at low temperatures was typically 0.02 GPa.
Evaluation of FLN spectra, determination of the IDF and compressibility To obtain the compressibility, series of FLN spectra were measured, each at varied excitation frequencies and all series at varied pressures. The highest intensity part of spectra is composed of (0, 0) transition lines (see Appendix I). The first step of evaluation is the baseline-correction removing the non-resolved or non-resonant background from the spectra (see Appendix I).
Based on the energy difference of excitation and (0, 0) emission energies (called as vibrational energy) one may select a line from each spectrum that belongs to the same vibrational state.
After this, one needs to track such a selected spectral line at varied excitation wavenumbers and get a reading of its intensity as a function of its (0, 0) emission energy, giving a possible representation of the IDF. Selecting another line and plotting the results, the same kind of IDF will be represented with the only difference that due to the different line intensity the total area under the curve varies, being a consequence of the different transition probabilities of the exci- tation (see Appendix I). The inverse of the corresponding area was used as a weighting factor for normalization. The reading of line intensities was performed by using the “Peakfinder”
component of the custom-designed software package (“IdfFit”). The spectral analysis was per- formed at each adjusted pressure value. The IDFs were fitted by Gaussians. The center and the
width values were plotted as functions of pressure and the compressibility was determined according to Eqs3and4.
Results
FLN spectra and IDF of hybrid HbAs
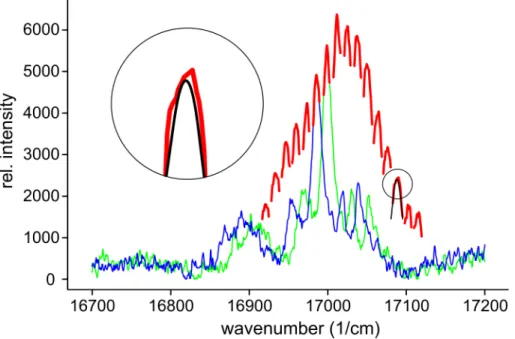
InFig 4two FLN spectra ofβ-Zn-HbA are presented marked with blue and green colors.
The difference between the two curves is that the excitation frequencies were different by about 13 cm-1. If the excitation difference is small, comparable to the linewidth, the shape of the two curves is rather similar, just shifted as much as the excitation frequency changed.
The relative intensities of the shifted spectral lines are, however, somewhat different. In one spectrum each line corresponds to a specific vibrational state with a characteristic vibra- tional frequency. Let us choose one of the spectral lines, for example the most intense one.
InFig 4the vibrational frequency of this line for both spectra is 973 cm-1. The change of the intensity of such a line with the excitation frequency is a consequence of the fact that at dif- ferent excitation frequencies, different number of molecules can be excited to the same level. Therefore, the intensity change follows the inhomogeneous distribution of the (0, 0) transition energies. The change in the peak maximum of the selected line in a broader exci- tation frequency range is marked with red color inFig 4. The somewhat noisy measured peak functions were replaced by fitted peaks for the evaluation of line intensities as shown in the inset.
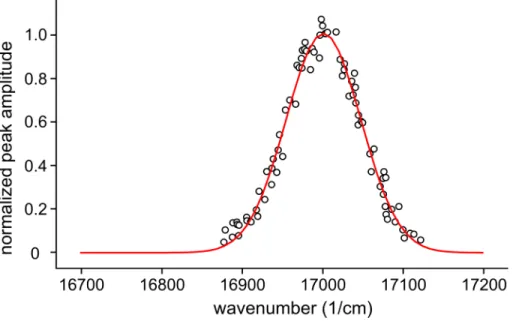
Fig 5shows the result of spectral evaluation in the case ofβ-Zn-HbA. The IDFs obtained by various selected vibronic excitation data were unified after normalization and fitted with Gaussian.
Fig 4. Fluorescence line narrowing (FLN) spectra ofβ-Zn-HbA. Blue and green curves show spectra at 0.14 GPa pressure and at two different excitation frequencies: 17958 cm-1and 17971 cm-1respectively; the detectable emission wavenumber range of the CCD camera is 16700–17200 cm-1. The changing peak maximum of the most intense spectral line (νvibratinal= 973 cm-1) marked with red color is also shown as it becomes shifted by the distinct excitation frequencies in the 17893–18089 cm-1wavenumber range. Inset shows a fitted peak (black) determined by the
“Peakfinder” software.
https://doi.org/10.1371/journal.pone.0194994.g004
IDF as function of pressure
Upon increasing pressure, red shift and broadening of the IDF was observable both for the hybrid HbAs and for their complexes with heterotropic allosteric effectors.Fig 6shows these effects in the case ofβ-Zn-HbA with Cl-. We fitted the data points with straight lines according to Eqs3and4. The compressibility was obtained as a parameter of the fitting.
This technique and evaluation procedure was performed on both kinds of samples (α-Zn- HbA andβ-Zn-HbA), without and with different allosteric effectors such as chloride ions (Cl-), inositol hexaphosphate (IHP), bezafibrate (BZF) or some of their combinations and the respective compressibilities were calculated. These data are summarized inTable 1.
Discussion
The compressibility and its change due to the binding of effectors is different in theαand in theβsubunit
In the interpretation of our results first we compare our data with others measured by different techniques [37,38]. Based on the theory explained in the Introduction part and on this com- parison we consider our compressibilities obtained by FLN as good approximation of the same parameter at room temperature. Our compressibility data are visualized on a more clear- cut form inFig 7. It is conspicuous that without effectors the compressibility in theβsubunit is significantly bigger than in theαsubunit (see red curves). It is also visible that in theαsub- unit the black and red curves generally overlap. This means that there is very slight change in the compressibility due to the binding of heterotropic allosteric effectors. In contrast in theβ subunit they cause a significant reduction. IHP (orange) causes the smallest and BZF (light green) the biggest influence. It needs to be mentioned that this trend agrees with that of their efficiency as effectors in lowering the oxygen-binding affinity of hemoglobin [17]. Extra Cl- addition can further intensify the effect in both cases (yellow and green). Unaccompanied Cl-
Fig 5. Determination of inhomogeneous distribution function (IDF). Normalized amplitudes of the peaks determined from fluorescence line narrowing (FLN) spectra ofβ-Zn-HbA after a background correction as a function of their center in the 16875–17125 cm-1wavenumber range with a fitted Gaussian as an inhomogeneous distribution function (IDF).
https://doi.org/10.1371/journal.pone.0194994.g005
(blue) addition in this concentration can cause similar compressibility reduction as IHP. It is noticeable that in theβsubunit the compressibilities maximally decreased by the effectors just reach the values ofαsubunit. We can read fromTable 1that the compressibility of theβsub- unit without effectors is 0.36±0.07/GPa, while of theαsubunit is about the half, 0.17±0.05/
GPa. Their minimal values reached with the effectors are 0.15±0.04/GPa and 0.14±0.04/GPa respectively, which are practically the same as without effectors in theαsubunit. We can pres- ent the correlation of the compressibility differences and the effector strength (alteration of
Fig 6. Change of the IDF parameters as a function of pressure in the case ofβ-Zn-HbA with Cl-as an example.
Center and width of the inhomogeneous distribution function (IDF) as a function of applied pressure in the 0–1.2 GPa pressure range are fitted with straight lines. The effect of pressure is of opposite sense on the two parameters.
https://doi.org/10.1371/journal.pone.0194994.g006
Table 1. Compressibilities (κ) of HbA under different conditions.
HbA+effectors κ+/- SD (1/GPa)
α-Zn-HbA – 0.17 +/- 0.05
Cl- 0.19 +/- 0.06
IHP 0.16 +/- 0.05
IHP+Cl- 0.17 +/- 0.05
BZF 0.14 +/- 0.04
BZF+Cl- 0.18 +/- 0.06
β-Zn-HbA – 0.36 +/- 0.07
Cl- 0.25 +/- 0.05
IHP 0.27 +/- 0.05
IHP+Cl- 0.23 +/- 0.05
BZF 0.19 +/- 0.04
BZF+Cl- 0.15 +/- 0.04
Data ofα-Zn-HbA andβ-Zn-HbA determined from the pressure shift and broadening of the inhomogeneous distribution functions (IDF-s), without and with different allosteric effectors.
https://doi.org/10.1371/journal.pone.0194994.t001
oxygenation curve based on ref [17]) quantitatively. While the correlation is rather high in the case of theβsubunit (r = 0.90), it is very low in the case of theα(r = 0.25).
Before considering and interpreting the meaning of the compressibility data, one needs to consider the conditions of the model that is the basis of deriving these parameters from the experimental data. According to the applied theoretical model for compressibility determina- tion, the system is homogeneous and isotropic with respect to the volume fluctuations [33]. It is clear that a real protein matrix deviates from these conditions. Literature data, however, obtained on proteins show the validity of this approximation in many cases [39,40]. Another point is that the experimental data refer to the vicinity of the fluorophore, to an “extended”
heme pocket (see the transparent colored discs inFig 2). Therefore, one needs to consider the compressibility data as averages characterizing the conformational dynamics in a surrounding shell of the structure around the hemes. The compressibility data can thus be interpreted as an averaged value based on this volume. According to our estimation, this volume does not exceed the size of one monomer (see Appendix II).
Relation of compressibility and available structural data
The compressibilities of theαandβsubunits were found significantly different. The heme pocket of theαsubunit seems much less flexible than that ofβ. In the amino acid sequence (seeFig 1) we can see that in 63 positions the amino acids are identical (marked with pastel orange rectangles) and 76 are disparate. We also can discover 2–2 local minor deviations because of the absence of amino acids in both cases (marked with green ellipses), but the major, dominant difference is the absence of 5 neighboring amino acids in theαsubunit (marked with red ellipse), which practically means the absence of almost the total D segment (see alsoFig 2).
As it is visible in Figs1and2the fluorophore (Zn-PP) can be found between the E and the F helices. Sterically the next closest part to the heme is helix C. This segment is connected to helix E through a loop and segment D. This intermediate section of the amino acid chain is much shorter in theαsubunit, thus it may result in a tighter structure in the vicinity of the fluorophore. We believe that such a structural difference may cause a difference in compress- ibility. That the binding of allosteric effectors decreases the compressibility in theβsubunit may derive from a slight conformational effect on the flexible loop between helices C and D altogether with helix D and thus leads to decreased flexibility around the heme. It seems that HbA has a minimal flexibility in its heme pocket structure with a minimal compressibility around 0.15/GPa. Theαsubunits are almost in this state without bound allosteric effectors, while theβsubunits reach it by binding the most efficient effectors.
Compressibility and the results of molecular dynamics (MD) simulations MD simulations generally refer to room temperature. In the comparison with our FLN results, we base our argument again on the above discussed similarity of compressibility data obtained at cryogenic and room temperature. Our findings are in accordance with the results of MD simulations of the Perahia group [20,21,41]. They found internal cavities in HbA which are not rigid entities; they appear and disappear along the dynamics trajectory. However, some of them persist, although with varying width in both subunits, but there is a persistent cavity inβ, which has no equivalent inα. They also studied the possible passageways of a ligand by investi- gating the displacement of water molecules around the protein. They suggest that describing the water molecules entering or leaving the vicinity of the heme may be a good indicator for the passage of a ligand. What is interesting, it was found that none of water molecules pene- trated theαsubunits, contrarily to theβwhere, during the transition, some water molecules
started to enter into the heme pocket. The opening of the passage during the transition is due in part to the relative movement of helix D, which has no equivalent inα-chains. The presence of this helix inβgives more flexibility to the region. Their calculations have also shown that the structural changes in the tertiary structure of theβsubunit after the quaternary conforma- tional transition plays a prominent role allowing the iron atom to be more accessible to the oxygen.
MD simulations of Hub and co-workers revealed a marked asymmetry betweenαandβ subunits. They described a tendency forβ-chains to couple more strongly to the quaternary motion thanα-chains [42]. Vesper and de Groot from MD simulations presented a novel allo- steric mechanism emphasizing the role of collective dynamics in the global rearrangement of Hb. The first step of the applied approach, (Functional Mode Analysis) is a strict separation of local/intra-chain and global/inter-chain motions. The developed computational technique allowed to find a linear coupling coordinate between tertiary and quaternary motions and thereby to identify allosteric coupling. They also found that the allosteric mechanism of com- munication between Hb subunits is equally based on hydrogen bonds and steric interactions [43].
According to a new proposed view, binding sites are energetically coupled and a chemical perspective on allostery can be obtained by identifying which amino acid residues are essential for signal propagation and what are the structural or dynamic changes elicited by the excess
Fig 7. Compressibility data of HbA as “Gaussians”. Curves were created based on the data inTable 1from the respectiveκand its standard deviation as parameters of center and width. They were normalized according to their heights. Forα-Zn-HbA they are represented as upside down curves to make the data more easily comparable. Red color marks the cases without allosteric effectors, other colors show the influence of different effectors (see in the Figure) and black means no significant difference.
https://doi.org/10.1371/journal.pone.0194994.g007
energy resulting from effector binding. It should be noted that this picture of energy pathways is a simplification, and does not provide a rigorous model of allosteric communication in pro- teins. Nevertheless, simple pictures of complex phenomena can be extremely powerful [13].
This concept supports the global description of allostery and that the compressibility is a useful parameter in this respect.
Effector binding sites versus global effect
There are different ideas about the binding sites of heterotropic effectors based on x-ray crys- tallography and computational methods [3,18,44,45]. The common feature of these sites is that they are usually rather far from the active sites and consequently also from helix C. Hence the effector can cause a tighter structure only because of a global change. The significance of global dynamics is also emphasized in the case of homotropic effectors [46]. The reported structural changes, included displacements of the F helix, which forms the switch region of HbAβsubunit and influences the stability of the T state structure. The enhanced global struc- tural fluctuation of the T state can be considered as a”non-site-specific” allosteric effect.
The heterotropic effects of CO2and H+is known as the Bohr effect. Since the released pro- tons also lower the oxygen affinity of Hb, they can be considered as being members of the fam- ily of allosteric effectors. Reported results show that chloride ions also contribute to the Bohr effect by neutralizing excess positive charges [47]. Therefore, the Bohr effect, a heterotropic effect, depends on the intricate arrangement and interactions of all hydrogen and anion bind- ing sites in the hemoglobin molecule. It is an excellent example of global electrostatic effects in proteins [48]. Consequently, the shift of the allosteric equilibrium, resulting from the binding of an allosteric effector, arises not only from where the molecule binds but also from how it interacts with Hb [3]. This concept is also supported by the results of pressure-induced tetra- mer to dimer transition studies resulting in the dissociation constant of the dimer interface [31]. The transition was found to be sensitive to the binding of allosteric effectors showing that conformational changes of the tertiary structure “propagate” from the effector binding sites to the interdimeric interfaces. All these findings support the concept of the “global allostery model” [17].
Based on a novel combination of x-ray diffraction analysis and microspectrophotometric O2equilibrium measurements nine different equilibrium conformers were identified that cover the complete conformational space of hemoglobin, providing clear and convincing evi- dence of coexisting states [49]. The authors also emphasized that allowing for multiple confor- mations is not inconsistent with the original MWC model [7], because the number of
allosteric states was not restricted by the original model. This was only simplified into a two- state view by many researchers. In the light of these findings the global average compressibility of the subunits (see the transparent colored discs inFig 2) can be correctly considered as a sig- nificant characteristic parameter.
Functional and dynamic asymmetry of the subunits
Despite of the global structural symmetry of the Hb teramer, it seems that the asymmetry in theαandβsubunits of HbA is an indispensable condition of allostery. Authors of the cavity mutant experiments [25] pointed out, that in the O2binding curve of rHb(α) (blue dotted line inFig 3) the high affinity component is ascribable to theαsubunits (detached heme) and the low affinity one to theβsubunits (normal heme). They also emphasized that the detached heme in theβsubunits (rHb(β), red dotted line inFig 3) causes an increase of O2affinity also in theαsubunits to the same degree as in the other case.
These facts are consonant with the low compressibility or low flexibility ofαsubunits. We may think that theαsubunits have close to optimal but rather rigid structure for O2binding and the presence of Fe-His bonds partially block the binding process reducing the O2affinity in the native HbA. Thus the detachment of Fe-His bonds in theαsubunits directly–through tertiary structural changes–increases the O2affinity and the quaternary structure does not change. While when the detachment of Fe-His bonds happens in theβsubunits, the same effect can occur just by global, at least by partial quaternary structural changes. It seems that the role of Fe-His binding in general is maintaining cooperativity, while the same bond in the αsubunits is responsible for inducing a high-affinity state of theβsubunits.
It is also noticeable, that the oxygenation of rHb(α) is slightly influenced by IHP in contrast to the oxygenation of native HbA (blue and green lines as compared to dotted ones inFig 3), but the low oxygen affinity part of the two curves are very similar. The lowering of oxygen affinity is also observable in the presence of IHP in the upper part of the O2binding curve of rHb(β) (red line inFig 3). The more rigid but higher affinityαsubunits are less sensitive to allosteric effectors, than theβsubunits. Thep50values of this high affinity range are more or less the same in both recombinant Hb-s independently of IHP binding. We found that IHP could not further decrease the compressibility in theαsubunits, because it was originally already small.
O2binding of rHb(β) is rather similar to Mb (seeFig 3), which is interesting because rHb (β) is a tetramer, while Mb is a monomer. Nevertheless, the Hill coefficient isn= 1.2 which means a low but existing cooperativity. The higher affinity part of native HbA and the rHb(β) is also similar, meaning that the detachment of Fe-His bonds in theβsubunits does not cause considerable changes in the same subunits. We think that these findings may also derive from the higher compressibility and thus the possibility for higher volume fluctuations of theβ subunits.
Final conclusions
In this work we applied a unique experimental approach by which the conformational dynam- ics of theαand theβsubunits in HbA could be characterized by the compressibility of the
“extended” heme pockets of the size of a subunit. We found that these parameters are different for the two subunits, and are differently modified by the binding of heterotropic allosteric effectors. Our results are in agreement with literature results of molecular dynamics simula- tions, of structural data and of functional differences of the subunits. We think that compress- ibility values provide a new characterization parameter of HbA, and that the asymmetry in the response to allosteric effectors suggests a distinct role of the subunits in the response sequence leading to changes in the oxygen binding capability. Based on our results we also suggest a
“unified view” composed of the models of Hb allostery based on a variety of approaches as thermodynamics, free energy landscape of population shift, and the structural view of allostery [23]. These descriptions are consistent or at least do not contradict the “global allostery model”
[17]. It’s getting clear that in general the solution of the problem of ligand binding is not to find the best fitted special structure for the specific function, but rather, to discover the global character of the process. We believe that this global character must be a synthesis of induced fit and conformational selection [50], that is, strongly based on an emphasis of the role of
dynamic conformational ensembles in biomolecular recognition.
Appendix I
Fluorescence line narrowing (FLN) spectroscopy. The basic principles of the FLN tech- nique are the following. Fluorescence emission spectra are measured on samples that are
rapidly cooled from room temperature to cryogenic temperatures. As a consequence of the cooling, the thermal fluctuations are practically stopped and the atomic configurations sur- rounding the chromophore that are populated at room temperature become fixed. This con- served population of dye molecules can be studied by spectroscopy. Every dye molecule has an own electronic transition energy, since it is perturbed by the molecular environment, and every molecular environment of the ensemble has a somewhat “different” structure, which is then reflected in a distribution of the transition energies around a mean value. A subgroup of dye molecules with the “same” or rather “very similar” structural environment means the
“same” electronic transition energy of them. With the use of narrow bandwidth (Δν) excita- tion, only this specific part of the molecules is selectively excited. Because of the selective exci- tation and the low temperature, the emission spectra consist of dominant sharp emission lines resulting from resonant excitations superimposed on the background of less dominant broad bands, which are present due to the non-resonant excitation. The mthsharp line originates from the transition between the lowest vibrational level of the first electronic excited state (1, 0) and the ground state (0, 0) after an excitation of (1, m) (0, 0) and a vibrational relaxation (1, m)!(1, 0) (in general it also called as (0, 0) transition). In a background-subtracted spec- trum, the line intensity (Im) is given by
Im¼KIexcABmNmðn;DnÞ ðApp1Þ
whereKis a constant,Iexcis the excitation intensity,Ais the fluorescence emission probability, Bmis the absorption transition probability, andNm(ν,Δν) denotes the number of selectively excited molecules at a given excitation frequency (ν) and excitation bandwidth (Δν). In most cases,Nm(ν,Δν) can be given as
Nmðn;DnÞ ¼N0 nmðnþDn
2Þ nmðn Dn 2Þ
ðApp2Þ
whereN0is the total number of the excitable dye molecules andnm(ν) is their cumulative dis- tribution function characteristic for the broadening, which has a same common shape for all the spectral lines (m = 0, 1, 2,. . .) shifted along the frequency scale. Instead of the cumulative distribution function, we may use the spectral density function which is the derivative ofnm(ν)
Nmðn;DnÞ ¼N0nm0ðnÞDn ðApp3Þ
Let us choose then00(ν) function which is a possible representation of the so called inhomo- geneous distribution function (IDF). Since the source of this broadening is the varying chro- mophore environment, this function is characteristic for the distribution of chromophore molecules in their environments [51].
Appendix II
Estimation of the volume in which the compressibility is measured. Starting withEq 2 we consider how far the interaction of the chromophore and the surrounding atomic groups–
leading to the solvent shiftνs−can extend. The interaction potential is often assumed being inversely proportional to the intermolecular distance (r) between the chromophore and the interacting solvent molecule by a power function [52]. Thus
nsðrÞ ¼ar n; ðApp4Þ
whereαis a proportionality constant. A reasonable choice fornis 6, as is the case for disper- sion or higher order electrostatic interactions (attractive long-range part of the Lennard-Jones potential). We have to remark that in our experiments instead of a classical solvent shift, we
have a “matrix-shift” caused by the interaction with the protein, but for simplicity hereafter we also use the term “solvent”. Let us consider a spherical volume around the chromophore with radiusr. This environment (matrix) is assumed to be homogeneous and isotropic; and each solvent molecule interacts independently with the chromophore [53,54]. Since we expect that an ensemble of solvent molecules may influence the transition frequency of the chromophore, we write the mean solvent shift an integral form:
hnsi ¼ Z1
V0
ar 6gðrÞdrdWd¼ Z1
R0
ar 6gðrÞ4pr2dr ðApp5Þ
where angle brackets indicate the expected value, the lower limit of the integral (V0) is the (effective) spherical volume of the chromophore,g(r) is standing for the kernel function, which may include arbitrary weighing along the distance, for the sake of simplicity we assume here a uniform distribution of the solvent molecules anddrdϑdφ=dVis the volume element in the polar coordinate system. In the last part of the equation,R0is the (effective) radius of the chromophore and 4πr2is the result of the integral according todϑanddφ.
DenoteRmaxthe radius of the spherical volume in which the compressibility is measured.
TheoreticallyRmax=1, because the interaction of Lennard-Jones potential is infinitely long range. Fortunately, this interaction falls off with distance rather quickly. Let us calculate what error (P) is caused if we limitRmaxto a finite value. To do this, we definePas the ratio of the contribution of the solvent shift outside of this spherical volume (νs(out)) forr>Rmax,and that for the total range. We may also use this definition in the opposite direction: If we choose an arbitraryPvalue we can determine the respectiveRmaxasR(1-P), the radius of the sphere which can be considered forRmaxas an approximation withPerror.
P¼nsðoutÞ hnsi ¼
Z1
Rð1 PÞ
r 4dr Z1
R0
r 4dr
¼½r 31R
ð1PÞ
½r 31R
0
¼ Rð1 PÞ
R0
3
: ðApp6Þ
Let bePin succession 1%, 2% and calculateR99%,R98%according to
Rð1 PÞ¼R0P 13: ðApp7Þ
From structural data we estimate the volume of the central part of a heme group to be approximately 300Å3and thus in the simple spherical approximation we can takeR0as [(0,75/
π)300]1/34.2Å. ThusR98%15Å,R99%19Å (seeFig 2). ThePvalue can be estimated from the accuracy of the parameter estimation from experimental data. In our experiments the uncertainity of our measuring procedure is about 1–2%, therefore we takePin this range. This suggests that in the case of FLN experiments we can assume that the compressibility values are referring to approximately the size of a single monomer. We found several demonstrative evi- dence consistent with this approach (seeDiscussionsection).
Appendix III
A concise overview on Hb’s allosteric models. The classical description of allostery in O2
binding has been derived from the concept that Hb as a tetramer exists in equilibrium between two conformations of distinct oxygen affinity, the T (tense) and the R (relaxed) states. In the
two-state allosteric model, Monod, Wyman, and Changeau (MWC) assigned the fully deoxy- genated Hb to the T and fully oxygenated Hb to the R states. Cooperativity of oxygen binding arises from a shift in the population from the low-affinity T state to the high-affinity R state as the oxygen concentration is increased. Thus the binding of O2alters the relative stabilities of the T and R states, whereas the O2affinity of the four subunits remains constant at each stage of ligation [7–9]. The two-state model was given an explicit structural interpretation by Perutz.
He proposed a stereochemical model of Hb to structurally describe the mechanistic details of the cooperativity on the basis of the molecular structures of deoxy- and oxy-Hbs. He assumed a structure-function correlation and assigned the T and R quaternary structures to low-affinity and high-affinity functional states [10]. For decades, the other dominant model for allostery was the ‘sequential’, or KNF (Koshland–Nemethy–Filmer), model [11]. This model assumes an induced-fit mechanism where ligand binding to one domain triggers conformational changes in the other domain, and can thus be easily understood in terms of the propagation of an interdomain signal. The rather new ensemble allostery model (EAM) provides a generaliza- tion of both models, allowing for different conformational states to be populated [12]. A recent review article highlights advances in describing structural and dynamic changes in allosteric proteins, the identification of residues important for signal propagation, the significance of the concept of allosteric pathways and how a chemically appealing picture of allostery can be obtained [13].
The MWC model has correctly interpreted several properties of cooperativity in hemoglo- bin O2binding and it ascribes the heterotropic effects to shifts of the allosteric equilibrium between the two quaternary structures, however Imai [14] showed that these heterotropic effects cannot be realized without assuming that the oxygen affinity of either quaternary struc- ture had been influenced by the bound heterotropic effectors. The tertiary two state model (TTS model) [15] was proposed to solve this inconsistency while conserving the essence of the MWC model.
Extended studies on the effect of heterotropic allosteric effectors indicated that they do not only bind to the T-state but also to the R-state. The modulation of the oxygen association con- stants in both states was shown to occur at a much broader scale than previously known.
These data initiated the reformulation of the earlier models for the allosteric action of hetero- tropic effectors [16,17]. The proposed “global allostery model” supposes that these effectors can bind to both the T- and R-states inducing direct tertiary conformational changes. Former models supposed a change of the interfaces between the subunits, which is a quaternary effect, but not a change in the tertiary structures of the subunits themselves. In this context, it is an important question how the proposed changes in the tertiary structure propagate from the interdimeric interfaces to the oxygen-binding site. It seems that conformational dynamics of the subunits may be the property that couples the interfacial tertiary changes to the site of the regulation of oxygen-binding. Moreover, the tertiary changes may very well be not only static structural rearrangements, but also changes in the dynamics and mobility of the oxygen bind- ing site and its surroundings [20,21].
Several new models describing the action of allosteric effectors on hemoglobin function have been published in the literature. The question of allostery without a conformational change has been raised by Tsai and Nussinov. They suggested the thought that ‘not observed does not imply that it is not there’ and they emphasize that there can be several possible reasons for the apparent missing evidence for conformational change [22]. They also presented a unified view about allostery [23]. Many models have been successfully for- mulated, and are able to describe allostery even in the absence of a detailed structural mechanism.
Acknowledgments
The authors are thankful for contribution to Prof. Takashi Yonetani, without his generosity providing his high quality hybrid samples with us, our work could not have been possible. The authors highly appreciate Prof. David Perahia’s critical reading of the manuscript.
Author Contributions
Conceptualization: Guszta´v Schay, Judit Fidy.
Formal analysis: Guszta´v Schay, Levente Herenyi.
Investigation: Guszta´v Schay, Andra´s D. Kaposi, La´szlo´ Smeller, Krisztia´n Szigeti.
Software: Guszta´v Schay.
Visualization: Guszta´v Schay, Levente Herenyi.
Writing – original draft: Guszta´v Schay, Judit Fidy, Levente Herenyi.
Writing – review & editing: Guszta´v Schay, Andra´s D. Kaposi, La´szlo´ Smeller, Krisztia´n Szi- geti, Judit Fidy, Levente Herenyi.
References
1. Changeux JP. 50th anniversary of the word “Allosteric”. Protein Sci. 2011; 20: 1119–1124.
2. Ronda L, Bruno S, Bettati S. Tertiary and quaternary effects in the allosteric regulation of animal hemo- globins. Biochim Biophys Acta. 2013; 1834: 1860–1872.
3. Safo MK, Ahmed MH, Ghatge MS, Boyiri T. Hemoglobin–ligand binding: Understanding Hb function and allostery on atomic level. Biochim Biophys Acta. 2011; 1814: 797–809.
4. Yonetani T, Kanaori K. How does hemoglobin generate such diverse functionality of physiological rele- vance? Biochim Biophys Acta. 2013; 1834: 1873–1884.
5. Lukin JA, Kontaxis G, Simplaceanu V, Yuan Y, Bax A, Ho C. Quaternary structure of hemoglobin in solution. Proc Natl Acad Sci USA. 2003; 100: 517–520.
6. Park SY, Yokoyama T, Shibayama N, Shiro Y, Tame JRH. 1.25Åresolution crystal structures of human haemoglobin in the oxy, deoxy and carbonmonoxy forms. J Mol Biol. 2006; 360: 690–701.
7. Monod J, Wyman J, Changeux JP. On the nature of allosteric transitions: A plausible model. J Mol Biol.
1965; 12: 88–118.
8. Viappiani C, Abbruzzetti S, Ronda L, Bettati S, Henry ER, Mozzarelli A, et al. Experimental basis for a new allosteric model for multisubunit proteins. Proc Natl Acad Sci USA. 2014; 111: 12758–12763.
9. Ackers GK, Holt JM. Asymmetric cooperativity in a symmetric tetramer: Human hemoglobin. J Biol Chem. 2006; 281: 11441–11443.
10. Perutz MF. Stereochemistry of cooperative effects in haemoglobin. Nature, 1970; 228: 726–739.
11. Koshland DE, Nemethy G, Filmer D. Comparison of experimental binding data and theoretical models in proteins containing subunits. Biochemistry. 1966; 5: 365–385.
12. Motlagh HN, Wrabl JO, Li L, Hilser VJ. The ensemble nature of allostery. Nature, 2014; 508: 331–339.
13. Ribeiro AAST, Ortiz V. A chemical perspective on allostery. Chem Rev. 2016; 116: 6488–6502.https://
doi.org/10.1021/acs.chemrev.5b00543PMID:26741913
14. Imai K. Allosteric Effects in Haemoglobin. Cambridge: Cambridge University Press; 1982.
15. Henry ER, Bettati S, Hofrichter J, Eaton WA. A tertiary two-state allosteric model for hemoglobin. Bio- phys Chem. 2002; 98: 149–164.
16. Tsuneshige A, Park S, Yonetani T. Heterotropic effectors control the hemoglobin function by interacting with its T and R states—a new view on the principle of allostery. Biophys Chem. 2002; 98: 49–63.
17. Yonetani T, Park S, Tsuneshige A, Imai K, Kanaori K. Global allostery model of hemoglobin. J Biol Chem. 2002; 277: 34508–34520.
18. Laberge M, Ko¨vesi I, Yonetani T, Fidy J. R-state hemoglobin bound to heterotropic effectors: models of the DPG, IHP and RSR13 binding sites. FEBS Lett. 2005; 579: 627–632.
19. Ko¨vesi I, Schay G, Yonetani T, Laberge M, Fidy J. High pressure reveals that the stability of interdimeric contacts in the R- and T-state of HbA is influenced by allosteric effectors: Insights from computational simulations. Biochim Biophys Acta. 2006; 1764: 516–521.
20. Mouawad L, Perahia D, Robert CH, Guilbert C. New insights into the allosteric mechanism of human hemoglobin from molecular dynamics simulations. Biophys J. 2002; 82: 3224–3245.
21. Mare´chal JD, Maseras F, Lledo´s A, Mouawad L, Perahia D. A DFT study on the relative affinity for oxy- gen of theαandβsubunits of hemoglobin. J Comput Chem. 2006; 27: 1446–1453.
22. Nussinov R, Tsai CJ. Allostery without a conformational change? Revisiting the paradigm. Curr Opin Struct Biol. 2015; 30: 17–24.
23. Tsai CJ, Nussinov R. A unified view of “How allostery works”. PLoS Comput Biol. 2014; 10(2):
e1003394.https://doi.org/10.1371/journal.pcbi.1003394PMID:24516370
24. Jones EM, Monza E, Balakrishnan G, Blouin GC, Mak PJ, Zhu Q, et al. Differential control of heme reac- tivity in alpha and beta subunits of hemoglobin: A combined Raman spectroscopic and computational study. J Am Chem Soc. 2014; 136: 10325–10339.
25. Nagatomo S, Nagai Y, Aki Y, Sakurai H, Imai K, Mizusawa N, et al. An origin of cooperative oxygen binding of human adult hemoglobin: Different roles of theαandβsubunits in theα2β2 tetramer. PLoS ONE. 2015; 10(8): e0135080.https://doi.org/10.1371/journal.pone.0135080PMID:26244770 26. Personov RI. Site selection spectroscopy of complex molecules in solutions and its applications. In:
Agranovich VM, Hochstrasser RM, editors. Spectroscopy and excitation dynamics of condensed molec- ular systems. Amsterdam; North-Holland; The Netherlands; 1983. Chapter 10.
27. Avarmaa RA, Rebane KK. High-resolution optical spectra of chlorophyll molecules. Spectrochim Acta.
1985; 41A: 1365–1380.
28. Personov RI. Luminescence line narrowing and persistent hole burning in organic materials: principles and new results. J Photchem Photobiol. 1992; 62: 321–332.
29. Angiolillo PJ, Leigh JS Jr, Vanderkooi JM. Resolved fluorescence emission spectra of iron-free cyto- chrome c. Photochem Photobiol. 1982; 36: 133–137.
30. Koloczek H, Fidy J, Vanderkooi JM. Fluorescence line-narrowing spectra of Zn-cytochrome c. Temper- ature dependence. J Chem Phys. 1987; 87: 4388–4394.
31. Schay G, Smeller L, Tsuneshige A, Yonetani T, Fidy J. Allosteric effectors influence the tetramer stabil- ity of both R- and T-states of hemoglobin A. J Biol Chem. 2006; 281: 25972–25983.
32. Landau LD, Lifshitz EM. Statistical Physics, Part 1: (Course of Theoretical Physics, Volume 5) 3rd ed.
Amsterdam: Elsevire; 1980.
33. Laird BB, Skinner JL. Microscopic theory of reversible pressure broadening in hole-burning spectra of impurities in glasses. J Chem Phys. 1989; 90: 3274–3281.
34. Smeller L, Fidy J. The enzyme horseradish peroxidase is less compressible at higher pressures. Bio- phys J. 2002; 82: 426–436.
35. Lesch H, Schlichter J, Friedrich J, Vanderkooi JM. Molecular probes: What is the range of their interac- tion with the environment? Biophys J. 2004; 86: 467–472.
36. Forman R, Piermarini G, Barnett J, Block S. Pressure measurement made by the utilization of ruby sharp-line luminescence. Science. 1972; 176: 284–285.
37. Gekko K, Hasegawa Y. Compressibility-structure relationship of globular proteins. Biochemistry. 1986;
25: 6563–6571.
38. Kharakoz DP. Protein compressibility, dynamics, and pressure. Biophys J. 2000; 79: 511–525.
39. Zollfrank J, Friedrich J, Fidy J, Vanderkooi JM. Photochemical holes under pressure: Compressibility and volume fluctuations of a protein. J Chem Phys. 1991; 94: 8600–8603.https://doi.org/10.1063/1.
1698679
40. Fidy J, Vanderkooi JM, Zollfrank J, Friedrich J. Softening of the packing density of horseradish peroxi- dase by a H-donor bound near the heme pocket. Biophys. J. 1993; 63: 1605–1612.
41. Mouawad L, Mare´chal JD, Perahia D. Internal cavities and ligand passageways in human hemoglobin characterized by molecular dynamics simulations. Biochim Biophys Acta. 2005; 1724: 385–393.
42. Hub JS, Kubitzki MB, de Groot BL. Spontaneous quaternary and tertiary T-R transitions of human hemoglobin in molecular dynamics simulation. PLoS Comput Biol. 2010; 6(5): e1000774.https://doi.
org/10.1371/journal.pcbi.1000774PMID:20463873
43. Vesper MD, de Groot BL. Collective dynamics underlying allosteric transitions in hemoglobin. PLoS Comput Biol. 2013; 9(9): e1003232.https://doi.org/10.1371/journal.pcbi.1003232PMID:24068910 44. Richard V, Dodson GG, Mauguen Y. Human deoxyhaemoglobin-2,3-diphosphoglycerate complex low-
salt structure at 2.5Åresolution. J Mol Biol. 1993; 233: 270–291.
45. Poyart C, Marden MC, Kister J. Bezafibrate derivatives as potent effectors of hemoglobin. Methods Enzymol. 1994; 232: 496–513.
46. Takayanagi M, Kurisaki I, Nagaoka M. Non-site pecific allosteric effect of oxygen on human hemoglobin under high oxygen partial pressure. Sci Rep-UK. 2014; 4: Article Number: 4601.https://doi.org/10.
1038/srep04601
47. Perutz MF, Shih DT, Williamson D. The chloride effect in human haemoglobin. A new kind of allosteric mechanism, J Mol Biol. 1994; 239: 555–560.
48. Sun DP, Zou M, Ho NT, Ho C. Contribution of surface histidyl residues in the alpha-chain to the Bohr effect of human normal adult hemoglobin: roles of global electrostatic effects. Biochemistry-US. 1997;
36: 6663–6673.
49. Shibayama N, Sugiyama K, Tame JRH, Park SY. Capturing the hemoglobin allosteric transition in a sin- gle crystal form. J Am Chem Soc. 2014; 136: 5097–5105.
50. Csermely P, Palotai R, Nussinov R. Induced fit, conformational selection and independent dynamic seg- ments: an extended view of binding events. Trends Biochem Sci. 2010; 35: 539–546.
51. Herenyi L, Suisalu A; Mauring K, Kis-Petik K, Fidy J, Kikas J. Variety in the coupling of mesoporphyrin IX to apohorseradish peroxidase c studied by energy selected fluorescence excitation and vibronic hole burning spectroscopy. J Phys Chem B. 1998; 102: 5932–5940.https://doi.org/10.1021/jp401751z 52. Scharnagl C, Reif M, Friedrich J. Local compressibilities of proteins: comparison of optical experiments
and simulations for horse heart cytochrome-c. Biophys J. 2005; 89: 64–75.
53. Zollfrank J, Friedrich J, Parak F. Spectral hole burning study of protoporphyrin IX substituted myoglobin.
Biophys J. 1992; 61: 716–724.
54. Friedrich J, Gafert J, Zollfrank J, Vanderkooi JM, Fidy J. Spectral hole burning and selection of confor- mational substates in chromoproteins. Proc Natl Acad Sci USA. 1994; 91: 1029–1033.