An International Journal for Engineering and Information Sciences DOI: 10.1556/606.2019.14.2.1 Vol. 14, No. 2, pp. 3–14 (2019) www.akademiai.com
INVESTIGATION OF RAILROAD BALLAST PARTICLE BREAKAGE
1 Erika JUHÁSZ, 2 Szabolcs FISCHER*
1 Department of Transport Infrastructure, Faculty of Architecture, Civil Engineering and Transport Sciences, Széchenyi István University, Egyetem tér 1, H-9026 Győr, Hungary
e-mail: 1juhasz.erika@sze.hu, 2 fischersz@sze.hu Received 30 November 2018; accepted 14 January 2019
Abstract: This paper summarizes the authors’ up-to-date results in the research topic of railway ballast particles’ breakage test with individual laboratory test. In the past few years there were a lot of railway rehabilitation and maintenance project in Hungary, as well as abroad. The largest part of world’s railways has traditional superstructure, i.e. they are so called ballasted tracks. The railway ballast is the highest mass in the railways’ superstructure. Nowadays, it is a naturally fact that there is enough quantity of railway ballast in adequate quality. However, due to the modifications and restrictions in the related regulations since 2010, there are only few quarries in Hungary, which are able to ensure adequate railway ballast material for railway construction and maintenance projects for speed values between 120 and 160 km/h. Quarrying industry is stricken by aggravated environmental, heritage and conservation regulations year by year, it limits the accessibility of mineral wealth in significant manner. This fact with quality requirements means supply and quality risk in production of railway ballast in medium term. The main goal of authors’ research is to be able to simulate the stress-strain effect of ballast particles in real and objective manner in laboratory circumstances, as well as in discrete element method modeling.
This paper introduces the exact assembly of executed laboratory test and newest test results. The authors summarize the up-to-date international literature review, using that they give short outlook to the planned research with research directions in near future.
Keywords: Railway, Ballast, Breakage, Degradation, Abrasion, Laboratory test
* Corresponding Author
1. Introduction and research problem
The authors published an article [1] in 2015 with results of a Research &
Development (R&D) on unique breakage test method in laboratory related to railway ballast. They would like to supplement that paper [1] with relevant, up-to-date outcomes.
The rock physical adequacy of railway ballast materials is determined by laboratory tests in Hungary, as well as in international practice (mainly in the EU) formulated in the same material standard. These standardized tests are the Micro-Deval abrasion test according to MSZ EN 1097-1:2012 [2], as well as Los Angeles abrasion test in the accordance with MSZ EN 1097-2:2010 [3], these are determined in the MSZ EN 13450:2003 standard [4]. These types of tests are exceedingly adequate for defining abrasion characteristics of a given aggregate sample and for ensuring production stability in the quarries, these are indispensable to be able to guarantee the required quality and to ensure the checking possibility of quality level in case of ready constructed railway tracks. The authors developed a special, unique laboratory test method (referring to antecedent [1], [5]) because the other testing methods cannot consider the real particle degradation (abrasion and breakage) due to dynamic vehicle effect (forces and vibration).
The authors compared the results received from the laboratory tests using new testing method with the required (prescribed) limits in standards [1]-[3], as well as related regulation of Hungarian Railways (MÁV) [6]. Required time intervals of ballast screening are able to be calculated according to laboratory test results.
2. Antecedents of the research
The research topic has considerably international literature, sources. Foreign researchers dealt with different areas and they elaborated different methods as follows:
• laboratory tests [7]-[16];
• in-situ tests in railway tracks [17], [18];
• Discrete Element Modeling (DEM) and/or 3D particle generation [10], [18], [19];
• Finite Element Modeling (FEM) [10].
Researchers formulated special indexes, constants and parameters (e.g. Ballast Breakage Index (BBI), Marshal, Hardin, Lee and Farhoomand breakages, etc.) that helped the authors with their research.
The following main sub-topics’ methods and laboratory tests from international literature review were taken into consideration:
• searching of relationship between railway ballast aggregate abrasion, as well as cohesion, inner friction angle and the water permeability of material and its layer [12];
• investigation of ‘angularity breakage’ phenomena [14];
• determination of relationship between Particle Size Distribution (PSD) and particle degradation phenomenon of ballast aggregate, as well as definition of better PSD for real loadings [11], [12];
• at the field of DEM generation method of much more realistic particle shapes was investigated and DEM models were validated [20];
• execution of laboratory and field tests with and without geosynthetic inclusions, measurement of railway ballast’s breakage [9], [10], [11], [17];
• investigation of ballast particle breakage due to tie tamping [7]-[8];
• investigation of glued ballast technique [13].
The authors collected the following relevant statements without the demand of completeness and they are not in raw of importance:
• limit values for Los Angeles Abrasion (LARB) Railway Ballast (RB) is max.
20% in Canada, 25% in Australia, 40% in Brazil and in USA [21] and max. 25- 35% in India [22], [23] that differ significantly from limits values required in Europe, e.g. in Austria LARB is max. 13% and the Micro-Deval Abrasion (MDERB) is max. 10% [24];
• water permeability values related to Los Angeles abrasion test samples after 250, 500, 750 and 1000 revolutions were 6.11×101, 2.7×101, 1.32×101 and 1.27×101 cm/s, respectively, that are dominantly diverge from relatively clean ballast sample (3.1×101 cm/s) [21];
• the higher the degradation, the lower the aggregate’s cohesion, but it does not affect the inner friction angle; the strengths of both the fresh and the recycled ballast material hang on the initial degradation level; cohesion of railway ballast sample after 800 revs in Los Angeles drum decreases almost to zero; ballast mixture from 30% fresh and 70% recycled aggregates has almost the same mechanical strength as the aggregate from 100% fresh ballast [12];
• the ‘angularity breakage’ evolved at lower stress levels and concludes with breakage of edges and corners of particles; there is a linear function correlation between ‘confining stress’ and deviator stress; there is higher ‘confining stress’
at higher dilation angle (ψ); breakage can be first seen at the top and bottom planes during monotonic triaxial tests because there are the highest particle interactions [14];
• ballast samples from real railway tracks (five years after construction) degraded much less compared with fresh ballast material, it can be explained with the particle shape: inner particle friction values were less in case of older ballast (there were more slips between particles) [18];
• hard sandstone ballast samples were tested by Los Angeles abrasion tests without steel balls, abrasion was evaluated after 100, 200, 300 and 400 revs (22.4/63 mm, LARB=11%…15%) [19];
• Particle degradation at low and high ‘confining stress’ values is very significant, but in mid-interval it is minimal; the degradation can be categorized into three obvious zones: Dilatant Unstable Degradation Zone (DUDZ), Optimum Degradation Zone (ODZ), as well as Compressive Stable Degradation Zone (CSDZ); the best (optimal) ‘confining stress’ value is between 30 and 75 kPa in
case of cyclic tri-axial tests, it occurs the minimal degradation that is advantageous in the aspect of maintenance [10];
• the relevant lowest particle degradation was observed in case of cyclic tri-axial laboratory tests regarding to 1.8 coefficient of uniformity (Cu), it is confirmed with three dimensional laser scanner measurements, too, considering this aspect new, better PSD was developed [11];
• new glue material with resin base was examined, which procedure is able to improve the mechanical behavior of railway ballast [13];
• particle degradation is not relevant in real circumstances until 10,000 train axles; in case LARB is improved from 24% to 12%, the particle degradation decreases with 50%; in case of ‘old’ ballast material the Los Angeles test does not give objective results; fresh ballast material can resist against approx. 40 tamping cycles without ballast screening [25];
• in case of fresh ballast material (Cu=1.5) both deformations and abrasion are higher than a recycled ballast aggregate (Cu=1.8); it is able to be explained with the formed contact stresses [17];
• three well separated ranges (zones) can be determined related to ballast deformation according to DEM simulations and cyclic tri-axial tests: plastic shakedown, plastic creep, as well as incremental collapse; in plastic shakedown range the strain rate quick decreases below than 10-6 and there will be some broken particles; in plastic creep range stable and stationary deformation can be observed, there will be some breakage; the range of plastic creep broaden when the ‘confining stress’ is raised; in incremental collapse range particle breakage and permanent deformation can be experienced that is principally because of shearing collapse; at low confining stress values the test frequency does not influence the collapse, at higher ‘confining stress’ values the higher the test frequency the lower stress is needed to collapse [20].
3. Procedure and parameters of the laboratory test
A special laboratory dynamic pulsating testing method and procedure were developed as a part of an R&D financed by Colas Északkő Ltd. in 2014. In 2014 a research report was written, after that more papers were published in this topic [26]-[29].
In 2017 and 2018 this testing and evaluating method were improved (taking into account of more precise deterioration process, considering only determined particle fraction, etc.) and the authors used the following parameters during measurements and evaluation:
• two different types of railway ballast samples from andesite material and from different quarries (samples are in accordance with MSZ EN 13450:2003 [4], A type, 31.5/50 mm, the authors received them from Colas Északkő Ltd.);
• the samples have the following stone physic parameters (laboratory test were done by Colas Északkő Ltd.’s accredited laboratory):
o sample No. 1: LARB=19%, MDERB=17%;
o sample No. 2: LARB=16%, MDERB=4%;
• determination of PSD curves with screening related to sub-samples Before Pulsating (BP) test;
• dynamic pulsating tests in more ‘phases’ (i.e. until 0.1, 0.2, 0.5, 1.0, 1.5, 3.0 and 5.0 million cycles), in every test with only fresh ballast material with particle fraction d≥22.4 mm (before pulsating d<22.4 mm particles were screened out and they were not put back), where d is the size of the particle;
• determination of PSD curves with screening related to sub-samples After Pulsating (AP) test.
The individual laboratory testing method is a dynamic pulsating test for that the six lower frames of a 10-level steel shear box were used [1], [29]. Frames were fixed together with steel metric screws that hinder the horizontal relative displacements. Steel rolls were not in the assembly at the down side of mentioned shear box.
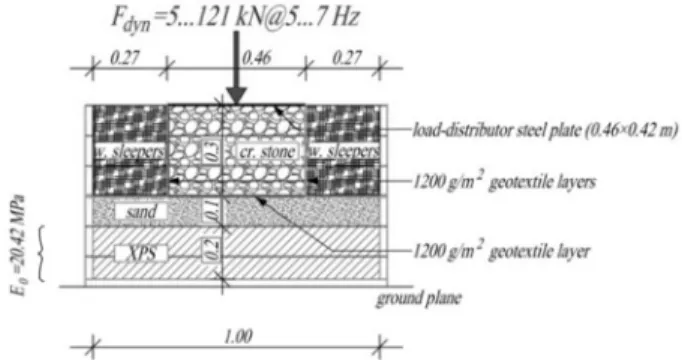
The built-up layer structure is the following (from down to top) (see Fig. 1):
• 20-cm-thick layer from eXtruded PolyStyrol (XPS, type: Austrotherm Thermopan) sheets on the whole 1.0×1.0 m area;
• simple layer from 150 g/m2 mass geotextile (type: Naue Secutex 151 GRK on the whole 1.0×1.0 m area;
• 10-cm-thick sand (E2,XPS+10 cm sand=20.42 MPa according to MSZ 2509-3:1989 [30];
• simple layer heat treated, non-woven, high strength geotextile with 1200 g/m2 mass (type: Viacon GEO PP TC 1200) on the whole 1.0×1.0 m area;
• 30-cm-thick crushed stone (cross section: 46×46 cm);
• steel loading plate with 46×42 cm area + D=300 mm steel plate with circular shape, where D is the diameter;
• wooden sleepers around the crushed stone samples at the side of box, whole thickness is approx. 30 cm.
Fig. 1. Measurement precept of new developed laboratory breakage test
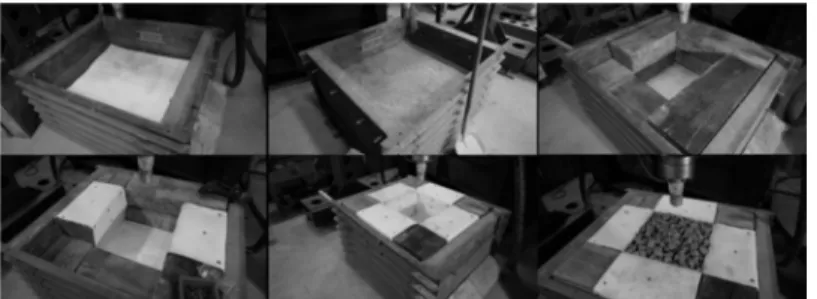
Crushed stone railway ballast samples were put in the middle of shear box into a 46×46 cm area and 30 cm height space where wooden sleepers are around, as it can be seen in Fig. 1. Reducing and excluding wall effect the inner sides of wooden sleepers
were covered with 1200 g/m2 mass geotextile layers (where stones and wooden sleepers would interact). A 46×42 cm area steel loading plate and a D=300 mm circular steel plate were put onto ballast samples to be able to achieve uniform load distribution. The assembly without loading plates can be seen in Fig. 2.
Fig. 2. Assembly procedure of testing box with layer structure, wooden sleepers, geotextile layers, as well as crushed stone ballast sample, but without steel loading plates
Laboratory measurements were executed with dynamic actuator in previously defined loading cycles. Laboratory test parameters (frequency, load values, etc.) were published in [1], [5] papers in detailed formats, they are not written here due to limited space. After pulsating tests PSD data sets were determined (measured) beside them several parameters (see below) were calculated [1], [5]:
• FV (%);
• BBI;
• BR, (BR is a parameter is similar to BBI, but it considers different areas in PSD [31]);
• d<22.4 mm in mass percentage;
• d<0.5 mm in mass percentage;
• d<0.063 mm in mass percentage;
• d60/d10 ratio;
• M ratio ( where M is a special shape factor of PSD curve of railway ballast [32], and M ratio means the ratio of MAP/MBP;
• λ ratio (where λ is a special shape factor of PSD curve of railway ballast that considers standard ballast PSD, as well [32], and λ ratio means the ratio of λAP/λBP).
Required time intervals of ballast screening were also computed with the help of deterioration process obtained from parameters above, as well as prescribed values from standards.
4. Results of last measurements
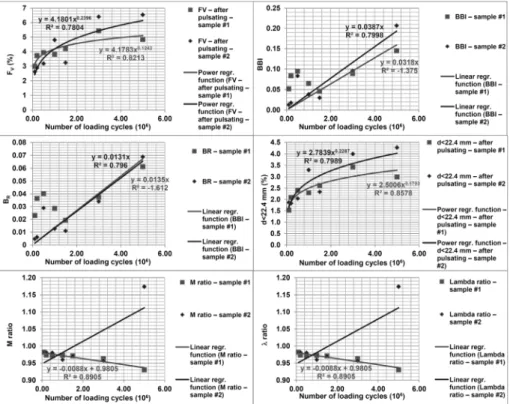
The two ballast samples detailed in Section 3 tested until 5-5 million cycles with dynamic pulsating laboratory test in more phases. Parameters calculated from PSD data sets are plotted in diagrams as a function of pulsating cycles in Fig. 3.
Following statements can be phrased in the consideration of the maximum 5-5 million loading cycles, as well as results in Fig. 3.
Fig. 3. Results of laboratory dynamic pulsating test (FV, BBI, BR, d<22.4 mm, M ratio, λ ratio parameters as a function of number of loading cycles)
There are significant correlations in case of four of the nine calculated parameters (linear and power regression functions, independent variable are the number of loading cycles:
• FV, i.e. the parameter that indicates the necessity of ballast screening recommended by the South African Railways [33]. This parameter can be approximated by power regression function as a function of the number of loading cycles. In case number of loading cycles is 5 million, FV equals to 5.0 and 6.5%. It is an interested fact that better ballast sample (considering stone physics, i.e. sample #2 has lower LARB and MDERB values than sample #1) deteriorates faster that can be verified by the equation of determined power regression functions, (see Fig. 3). Ballast screening has to be executed if FV=80% according to literature [33]. In case power regression functions are considered and number of loading cycles is calculated related to FV=80%, they are 2.1×10¹⁶ cycles and 2.24×10¹¹ cycles (for sample #1 and sample #2, respectively). These values are unrealistic high (compared to Kelenföld-
Hegyeshalom state boarder, No. 1 railway mainline in Hungary - where the loading is approx. 15 million MGT/year, i.e. 666,667 axles/year - and taking into consideration the common used time interval of ballast screening (12-15 years) [33], it means approx. 8-10 million loading cycles (through-rolled axles).
In this aspect, results obtained from analysis of FV parameter and its extrapolation cannot be used dependably.
• BBI parameter that was introduced by Indraratna and Lackenby [10], [11] to be able to calculate and assess the changing of PSD (i.e. the high fine and finest content) of tested samples and their quality. For calculation of BBI index PSD curves related to BP and AP have to be determined. There is linear regression correlation between BBI and number of loading cycles, but it has to be mentioned that in case of sample #1 the R2 coefficient is negative (mathematic meaning: the given correlation is worse than an y=c (constant) function). It has to be mentioned that BBI(0)=0 was a border condition. If measured data before 1.0 million loading cycle are analyzed they are outliers from the defined linear trend. To be able to evaluate fair the measurements are needed to repeat. BBI values are approx. 0.15% and 0.20% at 5 million loading cycles related to tested ballast material samples. It is an interested fact again that sample #2 has higher tangent (steeper slope) than sample #1 (see FV, too) (neglecting the negative R2 value because after 1.5 million loading cycles the given linear trend can be assumed). According to literature [10], [11] ballast screening is needed if BBI=1.0. In case numbers of loading cycles related to both samples are computed in the accordance BBI=1.0, the results are 31.45 million and 25.84 million cycles (for sample #1 and #2, respectively). They mean approx. 47-year and 39-year time intervals.
• BR parameter that takes after BBI because the reference area is calculated like in case of BBI [31]. In this way the linear regression functions and correlation are very close to results discussed at BBI. There is no technical recommendation for ballast screening related to BR value.
• There are power regression relationships between ‘d<22.4 mm in mass percentage’ parameter and number of loading cycles, (see Fig. 3). This parameter’s values are approx. 3.0% and 4.25% if the number of loading cycles is 5×10⁶ related to investigate andesite materials. It is surprising fact again that sample #2 has quicker deterioration than sample #1. According to literature [33]
ballast screening has to be performed if d<22.4 mm is equal or higher than 30%.
In case numbers of loading cycles has to be determined they are the following:
2.17×10¹² and 3.27×10¹⁰ cycles (for sample #1 and #2, respectively) that are unrealistic values.
• The M and λ ratio parameters [32] can be approximated by linear regression function (see Fig. 3). The tangent of regression function is higher in case of sample #2 than sample #1 (the sign is positive for sample #2 and negative for sample #1). If measured data are analyzed more detailed, it can be experienced that there is an outlier point in case of sample #2 (datum related to 5-million- cycle, both M ratio and λ ratio parameters), the reason of it has to be searched by additional tests.
5. Summary, future scope, outlook
There are not significant correlations (neither linear nor power) in case of other five of the nine calculated parameters if the independent variable is the number of loading cycles.
It has to be mentioned that the authors considered the following neglects related to calculation of time intervals between ballast screenings:
• machine-made and/or manual tamping occurred breakage;
• deterioration effect accelerated by substructure defect or superstructure defect;
• other ballast polluting effects (e.g. dust, concrete sleeper abrasion, breakage, in case of water pockets the increase of fine particle content in the ballast bed because of evolving pumping effect due to repeated dynamic load, etc.);
• in the whole ballast cross section comparable amount of breakage is not formulated as the one that was measured in referred laboratory tests (e.g. there is hardly no breakage in the ballast shoulder, etc.);
• only 225 kN axle load was taken into consideration (it is true for freight trains, for passenger trains about 180 kN value would be more realistic);
• effects of other dynamic loadings (e.g. welts, rail joints, turnout frogs [34]-[39]);
• effects of track geometry and its degradation [40].
This paper introduced the research problem related to railway ballast particle degradation and sentenced that a newly developed laboratory testing method can be adequate for measure and evaluate ballast materials’ breakage using dynamic pulsating load (fatigue). This procedure can guarantee that ballast samples are tested in more realistic circumstances than during standardized abrasion tests.
The authors summarized the up-to-date results of relevant international literature in this research topic; they made a so called state of the art related to ballast particle breakage.
It can be concluded that better ballast material (in the aspect of stone physics) does not deteriorate slower than the worse one. Parameters that are used internationally were calculated, as well as the deterioration process was approximated linear or power regression functions related to all parameters. There are only five from nine parameters to them the authors found significant correlation.
Time interval values of ballast screening were defined considering technical prescriptions, standards and handbooks. This calculation could be made for FV, BBI and d<22.4 mm parameters. Only BBI gave nearly acceptable results, in case of the others the results are not realistic, they can’t be accepted.
In some cases, additional control measurements have to be executed in the laboratory to be able to assess the measured data.
The authors would like to search the correlation (relationship) - as future scope - between standardized parameters (Los Angeles and Micro-Deval abrasions), the prognosticated time interval between ballast screening, as well as the results from their laboratory tests. In the beginning of 2019 a modified layer structure will be considered because the extruded polystyrol sheets were significantly deformed. A stiffer layer (e.g.
granular protection layer or steel plate, maybe) can be modified laboratory tests’ results
in better way, as well as difference between substructure circumstances with XPS sheets and stiffer layer is able to be published.
The time consumption of newly developed testing method is significantly high, in this way the authors would like to execute laboratory tests with lower time demand (e.g.
particle splitting tests), so relevant statements can be sentenced sooner.
Beside them field tests are planned in railway lines in Hungary. The authors would like to collect samples from old railway lines where ballast aggregates have known PSD at time of construction. The actual PSD can be determined and the changing can be defined, too. In case a lot of these kinds of measurements are able to be performed the comparison (not only field samples but the others from laboratory dynamic pulsating tests) can supply valuable results.
In the laboratory measured particle breakage values are much higher than the values in real circumstances in tracks, either in tracks with maintenance (ballast screening) demand. The reason is the only one type of loading form used in laboratory. The authors would like to develop their methodology to be able to assess the particle degradation more realistic. Tamping machines also break ballast particles, so this kind of effect is needed to be considered in the future research. Other additional dynamic loading effect can’t be neglected in sophisticated methods, e.g. surroundings of rail welts, rail joints, as well as switch frogs where higher ballast breakage should be expected.
DEM simulations with particle flow code software (e.g. Itasca PFC3D) can be useful in the future researches to be able to evaluate particle degradation. With this DEM method the expensive laboratory tests can be saved (if the model is validated with laboratory measurements), influence effect of lots of parameters can be considered, e.g.
particle shape, PSD, stone physics, abraded particles, geosynthetic reinforcements, depth of ballast, etc.
The authors’ future aim is to utilize of the results and maybe to adopt these results of the research into national regulations, standards.
Acknowledgements
This paper is supported by EFOP 3.6.1-16-2016-00017 project.
Open Access statement
This is an open-access article distributed under the terms of the Creative Commons Attribution 4.0 International License (https://creativecommons.org/licenses/by/4.0/), which permits unrestricted use, distribution, and reproduction in any medium, provided the original author and source are credited, a link to the CC License is provided, and changes - if any - are indicated. (SID_1)
References
[1] Fischer Sz. Crumbling examination of railway crushed stones by individual laboratory method, (in Hungarian) Sínek Világa, Vol. 57, No. 3, 2015, pp. 12‒19.
[2] MSZ EN 1097-1:2012, Tests for mechanical and physical properties of aggregates. Part 1:
Determination of the resistance to wear (micro-Deval), (in Hungarian) 2012.
[3] MSZ EN 1097-2:2010, Tests for mechanical and physical properties of aggregates. Part 2:
Methods for the determination of resistance to fragmentation, (in Hungarian) 2010.
[4] MSZ EN 13450:2003, Aggregates for railway ballast, (in Hungarian) 2003.
[5] Fischer Sz., Németh A., Harrach D., Juhász E. Laboratory fatigue degradation tests of railway ballast materials (in Hungarian), XXII. Conference on Civil Engineering and Architecture (in Hungarian) G. Köllő (Ed.), Csíksomlyó, Románia, 31 May-3 June 2018, pp. 58‒61.
[6] MÁV: Modification 4 in MÁV 102345/1995 Railway substructure and ballast quality acceptance regulations instruction (in Hungarian), 2010, pp. 1‒5.
[7] Al-Saoudi N. K. S., Hassan, K. H. Behavior of track ballast under repeated loading, Geotechnical and Geological Engineering, Vol. 32, No. 1, 2014, pp. 167‒178.
[8] Douglas S. C. Ballast quality and breakdown during tamping, Joint Rail Conference, Knoxville, USA, 15-18 April 2013, pp. 940‒955.
[9] Kamalov R. S., Ghataora G. S., Burrow M. P. N., Wehbi M., Musgrave P. Migration of fine particles from subgrade soil to the overlying ballast, Railway Engineering Conference, Edinburgh, UK, 21-22 June 2017, pages 1‒9.
[10] Indraratna B., Nimbalkar S., Christie D. The performance of rail track incorporating the effects of ballast breakage, confining pressure and geosynthetic reinforcement, in: Bearing Capacity of Roads, Railways and Airfields, Tutumluer E., Al-Qadi I. (Eds.) Taylor and Frances, London, 2009, pp. 5‒24.
[11] Indraratna B., Sun Y., Nimbalkar S. Laboratory assessment of the role of particle size distribution on the deformation and degradation of ballast under cyclic loading, Journal of Geotechnical and Geoenvironmental Engineering, Vol. 142, No. 7, 2016, pages 1‒14.
[12] Kolos A., Konon A., Chistyakov P. Change of ballast strength properties during particle abrasive wear, Procedia Engineering, Vol. 189, 2017, pp. 908‒915.
[13] Kondratov V., Solovyova V., Stepanova I. The development of a high performance material for a ballast layer of a railway track, Procedia Engineering, Vol. 189, 2017, pp. 823‒828.
[14] Liu G., Jing G., Ding D., Shi X. Micro-analysis of ballast angularity breakage and evolution by monotonic triaxial tests, in: Bian X., Chen Y., Ye X. (Eds.) Environmental Vibrations and Transportation Geodynamics, Springer, 2018, pp. 133‒144.
[15] McDowell G. Performance of geogrid-reinforced ballast, Ground Engineering, 2006, pp. 1‒6.
[16] Sun Y., Chen C., Nimbalkar S. Identification of ballast grading for rail track, Journal of Rock Mechanics and Geotechnical Engineering, Vol. 9, No. 5, 2017, pp. 945‒954.
[17] Nimbalkar S., Indraratna B. Field assessment of ballasted rail-roads using geosynthetics and shock mats, Procedia Engineering, Vol. 143, 2016, pp. 1485‒1494.
[18] Diógenes D. F., Maia R. S., Castelo Branco V. T. F. Evaluation of the ballast aggregates shape properties using digital image processing techniques, The 10th International Conference on the Bearing Capacity of Roads, Railways and Airfields, Athens, Greece, 28- 30 June 2017, pp. 2003‒2008.
[19] Fortunato E., Paixão A., Fontul S., Pires J. Some results on the properties and behavior of railway ballast, The 10th International Conference on the Bearing Capacity of Roads, Railways and Airfields, Athens, Greece, 28-30 June 2017, pp. 1877‒1884.
[20] Xiao J. H., Zhang D., Wang Y. H., Luo Z. Cumulative deformation characteristic and shakedown limit of railway ballast under cyclic loading, The 10th International Conference on the Bearing Capacity of Roads, Railways and Airfields, Athens, Greece, 28-30 June 2017, pp. 1899‒1904.
[21] Pavia C. E. L., Pereira M. L., Pimentel L. L. Study of railway ballast fouling by abrasion- originated particles, Railway Engineering Conference, Edinburgh, UK, 21-22 June 2017, pages 1‒13.
[22] Mundrey J. S. Railway track engineering, McGraw Hill, 2017.
[23] Chandra S., Agarwal M. M. Railway engineering, Oxford, 2013.
[24] Steiner E., Kuttelwascher C., Prager G. Load deduction in ballast bed - change effects due to consolidation and railway operation, (in German) Eisenbahntechnische Rundschau, No. 12, 2014, pp. 72‒76.
[25] Nålsund R. Prediction of railway ballast service life, The 10th International Conference on the Bearing Capacity of Roads, Railways and Airfields, Athens, Greece, 28-30 June 2017, pp. 2055‒2061.
[26] Fischer Sz., Németh A. Individual rock physics investigations of railway ballast materials, (in Hungarian) XI. Stone and Gravel Quarry Days (in Hungarian) Velence, Hungary, 1-2 March 2018, pp. 37‒41.
[27] Fischer Sz., Németh A. Special laboratory test for evaluation breakage (particle degradation) of railway ballast, Conference on Transport Sciences, Győr, Hungary, 22-23 March 2018, pp. 87‒96.
[28] Juhász E., Fischer Sz. Investigation of railway ballast materials’ particle degradation with special laboratory test method, Abstract book of 14th Miklós Iványi International PhD &
DLA Symposium, Pécs, Hungary, 29-30 October 2018, pp. 89‒90.
[29] Fischer Sz. Breakage test of railway ballast materials with new laboratory method, Periodica Polytechnica, Civil Engineering, Vol. 61, No. 4, 2017, pp. 794‒802.
[30] MSZ 2509-3:1989, Bearing capacity test on pavement structures, Plate bearing test, (in Hungarian), 1989.
[31] Danesh A., Palassi M., Mirghasemi A. A. Evaluating the influence of ballast degradation on its shear behavior, International Journal of Rail Transportation, Vol. 6, No. 3, 2018, pp. 145‒162.
[32] Gálos M., Kárpáti L., Szekeres D. Railway ballast aggregates (Part 2) (in Hungarian), Sínek Világa, Vol. 54, No. 1, 2011, pp. 6‒13.
[33] Lichtberger B. Track compendium, Eurailpress, Hamburg,2011.
[34] Kurhan D. M. To the solution of problems about the railways calculation for strength taking into account unequal elasticity of the subrail base, Nauka ta Progres Transportu, Vol. 55, No. 1, 2015, pp. 90‒99.
[35] Kurhan D. Determination of load for quasi-static calculations of railway track stress-strain state, Acta Technica Jaurinensis, Vol. 9, No. 1, 2016, pp. 83‒96.
[36] Kovalchuk V. V., Sysyn M. P., Sobolevska J., Nabochenko O., Parneta B., Pentsak A.
Theoretical study into efficiency of the improved longitudinal profile of frogs at railroad switches, Eastern European Journal of Enterprise Technologies, Vol. 4, No. 1 2018, pp. 27‒36.
[37] Sysyn M. P., Kovalchuk V. V., Jiang D. Performance study of the inertial monitoring method for railway turnouts, International Journal of Rail Transportation, 2018, DOI:
10.1080/23248378.2018.1514282.
[38] Sysyn M., Gerber U., Kovalchuk V., Nabochenko O. The complex phenomenological model for prediction of inhomogeneous deformations of railway ballast layer after tamping works, Archives of Transport, Vol. 46, No. 3, 2018, pp. 91–107.
[39] Vinkó Á. Monitoring and condition assessment of tramway track using in-service vehicle, Pollack Periodica, Vol. 11, No. 3, 2016, pp. 73‒82.
[40] Nagy R. Description of rail track geometry deterioration process in Hungarian rail lines No. 1 and No. 140, Pollack Periodica, Vol. 12, No. 3, 2017, pp. 141‒156.