processes
Article
Production of Liquid Milk Protein Concentrate with Antioxidant Capacity, Angiotensin Converting
Enzyme Inhibitory Activity, Antibacterial Activity, and Hypoallergenic Property by Membrane Filtration and Enzymatic Modification of Proteins
Arijit Nath1,*, Burak Atilla Eren1 , Attila Csighy1, Klára Pásztorné-Huszár2, Gabriella Kiskó3, LászlóAbrankó4, Attila Tóth5, Em ˝oke Szerdahelyi6, Zoltán Kovács7 , András Koris1and Gyula Vatai1,*
1 Department of Food Engineering, Faculty of Food Science, Szent István University, Ménesi st 44, HU-1118 Budapest, Hungary; Eren.Burak.Atilla@hallgato.uni-szie.hu (B.A.E.);
Attila.Csighy@phd.uni-szie.hu (A.C.); Koris.Andras@etk.szie.hu (A.K.)
2 Department of Refrigeration and Livestock Products Technology, Faculty of Food Science,
Szent István University, Ménesiút 43-45, HU-1118 Budapest, Hungary; pasztorne.huszar.klara@etk.szie.hu
3 Department of Food Microbiology and Biotechnology, Faculty of Food Science, Szent István University, Somlói st 14–16, HU-1118 Budapest, Hungary; Kisko.Gabriella@etk.szie.hu
4 Department of Applied Chemistry, Faculty of Food Science, Szent István University, Villányiút 29-43, HU-1118 Budapest, Hungary; Abranko.Laszlo@etk.szie.hu
5 Division of Clinical Physiology, Department of Cardiology, Faculty of Medicine, University of Debrecen, Móricz Zsigmond Str 22, HU-4032 Debrecen, Hungary; atitoth@med.unideb.hu
6 Department of Biology, National Agricultural Research and Innovation Center, Food Science Research Institute, Herman Ottó út 15, HU-1022 Budapest, Hungary; szerdahelyi.emoke@eki.naik.hu
7 Department of Physics and Control, Faculty of Food Science, Szent István University, Somlói street 14-16, HU-1118 Budapest, Hungary; Kovacs.Zoltan3@etk.szie.hu
* Correspondence: arijit0410@gmail.com (A.N.); Vatai.Gyula@etk.szie.hu (G.V.);
Tel.:+36-1-305-7110 (A.N.);+36-1-305-7115 (G.V.)
Received: 3 June 2020; Accepted: 10 July 2020; Published: 18 July 2020 Abstract:Liquid milk protein concentrate with different beneficial values was prepared by membrane filtration and enzymatic modification of proteins in a sequential way. In the first step, milk protein concentrate was produced from ultra-heat-treated skimmed milk by removing milk serum as permeate.
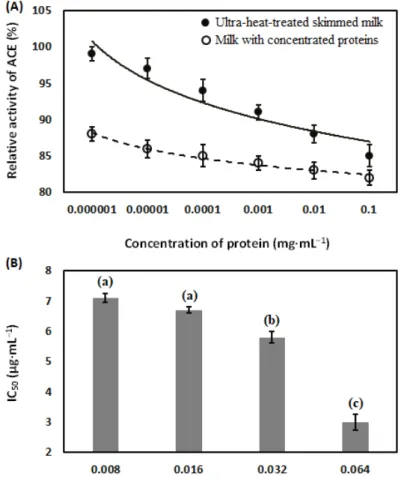
A tubular ceramic-made membrane with filtration area 5×10⁻³m2and pore size 5 nm, placed in a cross-flow membrane house, was adopted. Superior operational strategy in filtration process was herein: trans-membrane pressure 3 bar, retention flow rate 100 L·h−1, and implementation of a static turbulence promoter within the tubular membrane. Milk with concentrated proteins from retentate side was treated with the different concentrations of trypsin, ranging from 0.008–0.064 g·L−1 in individual batch-mode operations at temperature 40◦C for 10 min. Subsequently, inactivation of trypsin in reaction was done at a temperature of 70◦C for 30 min of incubation. Antioxidant capacity in enzyme-treated liquid milk protein concentrate was measured with the Ferric reducing ability of plasma assay. The reduction of angiotensin converting enzyme activity by enzyme-treated liquid milk protein concentrate was measured with substrate (Abz-FRK(Dnp)-P) and recombinant angiotensin converting enzyme. The antibacterial activity of enzyme-treated liquid milk protein concentrate towardsBacillus cereusandStaphylococcus aureuswas tested. Antioxidant capacity, anti-angiotensin converting enzyme activity, and antibacterial activity were increased with the increase of trypsin concentration in proteolytic reaction. Immune-reactive proteins in enzyme-treated liquid milk protein concentrate were identified with clinically proved milk positive pooled human serum and
Processes2020,8, 871; doi:10.3390/pr8070871 www.mdpi.com/journal/processes
peroxidase-labelled anti-human Immunoglobulin E. The reduction of allergenicity in milk protein concentrate was enzyme dose-dependent.
Keywords: liquid milk protein concentrate; antioxidant capacity; angiotensin converting enzyme inhibitory activity; antibacterial activity; hypoallergenic property
1. Introduction
For years, different types of non-fermented and fermented dairy-based food formulas are received great attention among different communities. As time progressed, dairy industries tried their best to improve the quality of dairy-based formulas to fulfill the expectations of consumers [1]. For industrial production of fermented dairy products, milk with a standardized amount of protein is necessary to maintain the quality of products [2,3]. Different dairy-based protein concentrates, such as milk protein concentrate, milk protein isolate, whey protein concentrate, whey protein isolate, micellar casein concentrate, micellar casein isolate, whey concentrate, and selectively demineralized whey concentrate are widely used in the food and biopharmaceutical industries [4]. Milk protein concentrate is well accepted among all communities because it is an abundant source of the various kinds of proteins, including micellar casein, whey proteins, and glycomacropeptide, and has significantly lower amounts of lactose and fat compared to whey protein concentrate and whole milk protein concentrate, respectively [5]. Therefore, it is popularly used to prepare infant formula, protein bar, yogurt, recombined cheese, cultured product, frozen dessert, weight management products, and sports formulas [6]. To produce dairy-based protein concentrate, large-scale production plants with different unit operations are requirement. It may be noted that production of milk varies throughout the year.
During the spring season, milk production is quite high compared to the fall season. To balance economic competitiveness, small-scale and medium-scale dairy industries avoid expensive processing steps, such as evaporation and drying to prepare dairy-based protein concentrate in powder form, and prefer to use liquid milk protein concentrate for manufacturing fresh cultured-food products [7,8].
In the dairy industry, application of membrane technology is noteworthy. Membrane technology is used for preparing concentrated milk proteins, fractionation of dairy proteins, demineralization of whey, and removal of microbial count in milk [9–11]. In some cases, ultrafiltration or nanofiltration operated with diafiltration mode was adopted to achieve high protein concentrate and avoid membrane fouling [12–14]. Some limitations in this context are reported. The limitations are (a) development of gel layer (concentration polarization) on the membrane surface and subsequent membrane fouling, and (b) high energy consumption. During filtration, due to deposition of solute molecules on the membrane surface, concentration polarization take place on the membrane surface. Because of this, permeate flux is reduced in drastic way [15–17]. However, increase of trans-membrane pressure (TMP) or fluid flow through a mechanical pump reduces the development of gel layer on the membrane surface; there is a debating issue about high energy consumption [18,19]. Therefore, it may feel that an efficient membrane separation process and its operational strategy are needed to explore to produce liquid milk protein concentrate.
However, milk has gained a great attention around the globe due to the presence of the different types of proteins (αS1-casein,αS2-casein,β-casein,κ-casein,γ-casein, immunoglobulin, bovine serum albumin, lactoferrin,α-lactalbumin, andβ-lactoglobulin), lactose, vitamins (vitamin A, vitamin E, ascorbic acid, riboflavin, vitamin B6, nicotinic acid, pantothenic acid, and thiamin) and minerals (calcium, magnesium, phosphorus, potassium, selenium, and zinc) [20]. The milk sensitive community frequently experiences with the symptoms of immunoglobulin-mediated milk protein allergies, in some cases [21,22]. Due to the presence of Immunoglobulin E- and Immunoglobulin G- binding epitopes, milk proteins are listed among the “big 8” allergens [23,24]. Milk allergens provoke mild symptoms to life-threatening biochemical outcomes, including severe enterocolitis atopic eczema and immediate
Processes2020,8, 871 3 of 25
immunoglobulin-mediated systematic multisystem reactions [25]. Milk is not recommended in the diet chart due to the presence of saturated fatty acids—those contribute heart disease [26,27], type 2 diabetes, and Alzheimer’s disease [28,29]. Furthermore, due to the absence of lactase, a hydrolytic enzyme in brush border of epithelial cells in the small intestine, the milk sensitive community frequently suffers with symptoms of lactose maldigestion [20,21]. However, concentrations of lactose and fat in milk protein concentrate are significantly low; in some cases, food formulas fortified with milk protein concentrate offer immunoglobulin-mediated allergies among people of all ages [30,31].
A plethora of literature about thermal and non-thermal processing technologies have been adopted to combat milk protein allergens [32,33]. The reduction in protein allergenicity in the molecular basis is the destruction of structure of epitopes. Applications of high pressure- [34,35], heat- [36–38], microwave- [39], and membrane bioreactors [40,41] were implemented for the reduction of allergenic sequences in milk proteins. In some cases, physical- [42–44] and enzymatic- [45–48] modifications of proteins have been adopted for a similar objective. Furthermore, combined physical and biochemical technologies have been adopted for the reduction of milk protein allergens [49–56]. In some cases, new epitopes (neoepitopes) or hidden epitopes may even be produced during cow milk processing due to denaturation of native allergen (cryptotopes) [57]. Realizing advantages and disadvantages of mentioned technologies, it may feel that enzymatic hydrolysis of allergenic epitopes in protein sequences may be an effective attempt to reduce milk protein allergens. Besides the elimination of their allergenic potentiality, modification of milk proteins through enzymatic routes may alter their functional properties, because peptides with unique amino acids in C- and N- terminal positions are produced through enzymatic hydrolysis of peptide bonds in milk proteins. Furthermore, the enzymatic modification of milk proteins may generate new antigenic substances, which may offer immunomodulation, and provide extra health benefits [58]. However, lots of information about the reduction of allergenic epitopes in milk proteins through an enzymatic route are stored in scholarly databases; its production in industrial scale is limited [59]. The challenging issues in enzyme-mediated process are (a) high cost of enzymes, and (b) find out suitable operating process parameters in enzyme-mediated processes.
Therefore, it can feel that an investigation is needed to find out the minimum amount of enzymes, which is responsible for reducing a significant amount (>99.9%) of the allergenic sequence and improve the functional activities of milk protein concentrate. Trypsin is an endopeptidase generally found in the pancreas of mammalians, and cleaves at the carboxyl terminal side of arginine and lysine amino acid residues, except arginyl-proline and lysyl-proline bonds. It is popularly used for preparation of dairy formulations with lower antigenic activities [60,61]. As the catalytic activity of trypsin is quite high (relative activity 99%) at pH 7 and may be able to change the biological activity of proteins and peptides [62–64], it was used in this investigation.
From the above discussion, one can realize that efforts are needed to reduce the limitations of milk protein concentrate production and dairy product consumption. In this investigation, an attempt was considered to develop liquid milk protein concentrate from ultra-heat-treated skimmed milk with antioxidant capacity, angiotensin converting enzyme inhibitory activity, antibacterial activity, and hypoallergenic property by membrane filtration and enzymatic modification of proteins in a sequential way. In the present investigation, membrane filtration process was adopted to increase the protein concentration in milk by reducing the milk serum as permeate and, subsequently, trypsin was adopted to hydrolyze the concentrated liquid milk proteins, obtained at the retentate side.
Membrane filtration process itself cannot change the structural and biological activities of milk proteins.
Peptides, produced by enzymatic hydrolysis of milk proteins with unique C- and N-terminal amino acids, peptide length, and amino acid sequence, offer distinguishing biological activities. Furthermore, allergenic activity of proteins is reduced due to enzymatic cleavage in allergenic epitopes within the amino acid sequence in protein.
2. Materials and Methods
2.1. Chemicals and Reagents
Lyophilized trypsin (≥27.78 units per mg of solid at temperature 25◦C) from bovine pancreas, Bradford reagent, bovine serum albumin, casein,α-lactalbumin andβ-lactoglobulin from bovine milk, Abz-FRK(Dnp)-P, peroxidase-labelled anti-human Immunoglobulin E, 2,4,6-Tris(2-pyridyl)-s-triazine (≥98%), 4-chloronaphtol (≥98%), hydrogen peroxide (≥98%), ethanol (≥99%), and phosphate buffered saline solution were purchased from the Sigma-Aldrich (Sigma-Aldrich, Schnelldorf, Germany). Ultrasil P3-11 was purchased from Ecolab-Hygiene Kft (Ecolab-Hygiene Kft, Budapest, Hungary). Citric acid (99%), hydrochloric acid (≥99%), urea (≥99%), dithiothreitol (DTT) and sodium hydroxide (≥99%) were purchased from Reanal Kft (Reanal Kft, Budapest, Hungary).
Ferric chloride (≥99%), sodium acetate (anhydrous,≥99%), sodium chloride (≥99%), zinc chloride (≥99%), bacteriological agar powder, soybean casein digestive medium and ascorbic acid (99.7%) were procured from Merck (Merck, Darmstadt, Germany). Sodium-dodecyl sulphate (≥99%), acrylamide (≥99%), ammonium persulfate (≥99%), bis-acrylamide (≥99%), tetramethylethylenediamine (≥99%), tris(hydroxymethyl)aminomethane hydrochloride (TRIS HCl), ethyl alcohol (≥99%), glycine (≥99%), coomassie blue stain R250 (≥99%), acetic acid (≥99%), glycerol (≥99%), isopropanol (≥99%), 2β-mercaptoethanol (≥99%), and bromophenol blue (≥99%) were procured from Bio-Rad (Bio-Rad, Hercules, USA). High performance liquid chromatography mass spectrometry (HPLC-MS)-grade acetonitrile, formic acid, and trisodium citrate (≥99%) were purchased from VWR International Ltd.
(VWR International Ltd., Debrecen, Hungary). Recombinant angiotensin converting enzyme was kindly provided by Division of Clinical Physiology, Institute of Cardiology, University of Debrecen (University of Debrecen, Debrecen, Hungary).Bacillus cereusandStaphylococcus aureusATCC 6538 were collected from the Strain collection unit of Szent István University (Szent István University, Budapest, Hungary). Milli-Q ultrapure deionized water (18.2 MΩ·cm) was obtained from Milli-Q Synergy/Elix water purification system (Merck-Millipore, Molsheim, France) and used throughout the experiment.
2.2. Ultra-Heat-Treated Skimmed Cow Milk
Ultra-heat-treated skimmed cow milk was procured from local supermarkets, in and around Budapest, Hungary. Concentrations of protein, lactose, and fat in milk were in average 31±0.16 g·L−1, 47±0.15 g·L−1and 1±0.02 g·L−1, respectively. Average pH of milk was 6.8. Milk was stored in a refrigerator at temperature 10◦C.
2.3. Production of Hypoallergenic Liquid Milk Protein Concentrate with Functional Values
An attempt was considered to develop a process to produce allergen-free liquid milk protein concentrate with functional values, such as antioxidant capacity, angiotensin converting enzyme inhibitory activity, and antibacterial activity. Combination of different physical- and biochemical- based technologies were adopted for this purpose (Figure1).
Processes2020,8, 871 5 of 25
Processes 2018, 6, x FOR PEER REVIEW 4 of 25
buffered saline solution were purchased from the Sigma-Aldrich (Sigma-Aldrich, Schnelldorf, Germany). Ultrasil P3-11 was purchased from Ecolab-Hygiene Kft (Ecolab-Hygiene Kft, Budapest, Hungary). Citric acid (99%), hydrochloric acid (≥99%), urea (≥99%), dithiothreitol (DTT) and sodium hydroxide (≥99%) were purchased from Reanal Kft (Reanal Kft, Budapest, Hungary). Ferric chloride (≥99%), sodium acetate (anhydrous, ≥99%), sodium chloride (≥99%), zinc chloride (≥99%), bacteriological agar powder, soybean casein digestive medium and ascorbic acid (99.7%) were procured from Merck (Merck, Darmstadt, Germany). Sodium-dodecyl sulphate (≥99%), acrylamide (≥99%), ammonium persulfate (≥99%), bis-acrylamide (≥99%), tetramethylethylenediamine (≥99%), tris(hydroxymethyl)aminomethane hydrochloride (TRIS HCl), ethyl alcohol (≥99%), glycine (≥99%), coomassie blue stain R250 (≥99%), acetic acid (≥99%), glycerol (≥99%), isopropanol (≥99%), 2β- mercaptoethanol (≥99%), and bromophenol blue (≥99%) were procured from Bio-Rad (Bio-Rad, Hercules, USA). High performance liquid chromatography mass spectrometry (HPLC-MS)-grade acetonitrile, formic acid, and trisodium citrate (≥99%) were purchased from VWR International Ltd.
(VWR International Ltd., Debrecen, Hungary). Recombinant angiotensin converting enzyme was kindly provided by Division of Clinical Physiology, Institute of Cardiology, University of Debrecen (University of Debrecen, Debrecen, Hungary). Bacillus cereus and Staphylococcus aureus ATCC 6538 were collected from the Strain collection unit of Szent István University (Szent István University, Budapest, Hungary). Milli-Q ultrapure deionized water (18.2 MΩ·cm) was obtained from Milli-Q Synergy/Elix water purification system (Merck-Millipore, Molsheim, France) and used throughout the experiment.
2.2. Ultra-Heat-Treated Skimmed Cow Milk
Ultra-heat-treated skimmed cow milk was procured from local supermarkets, in and around Budapest, Hungary. Concentrations of protein, lactose, and fat in milk were in average 31 ± 0.16 g·L−1, 47 ± 0.15 g·L−1 and 1 ± 0.02 g·L−1, respectively. Average pH of milk was 6.8. Milk was stored in a refrigerator at temperature 10 °C.
2.3. Production of Hypoallergenic Liquid Milk Protein Concentrate with Functional Values
An attempt was considered to develop a process to produce allergen-free liquid milk protein concentrate with functional values, such as antioxidant capacity, angiotensin converting enzyme inhibitory activity, and antibacterial activity. Combination of different physical- and biochemical- based technologies were adopted for this purpose (Figure 1).
Figure 1. Experimental steps for preparing hypoallergenic liquid milk protein concentrate with functional values (antioxidant capacity, angiotensin converting enzyme inhibitory activity, and antibacterial activity).
Figure 1. Experimental steps for preparing hypoallergenic liquid milk protein concentrate with functional values (antioxidant capacity, angiotensin converting enzyme inhibitory activity, and antibacterial activity).
2.3.1. Concentrate Milk Proteins in Ultra-Heat-Treated Skimmed Milk by Membrane Technology De-watering (remove of milk serum) of ultra-heat-treated skimmed milk was performed by a tubular nanofiltration membrane with active filtration area 5 × 10⁻³ m2 and pore size 5 nm (Pall Corporation, Crailsheim, Germany), placed in a stainless steel-made cross-flow membrane module (Figure2). The active layer, support layer, length, inner diameter, and outer diameter of the membrane were titanium oxide, aluminum oxide, 250 mm, 7 mm, and 10 mm, respectively. In the membrane module, feed flow rate was controlled by a centrifugal pump (Verder Hungary Kft, Budapest, Hungary). Flow rate of fluid (milk, water) in the membrane module was also controlled by a rotameter at a retentate flow channel and a bypass channel at the inlet channel of the membrane module. TMP of the membrane module was controlled by pressure gauges, fitted at inlet and retentate flow channels of the membrane module. A mechanical agitator was fitted inside of the storage tank of the membrane module. Temperature in the storage tank of the membrane module was maintained by a temperature sensor and automated circulation of warm/cold water within the water jacket.
Processes 2018, 6, x FOR PEER REVIEW 5 of 25
2.3.1. Concentrate Milk Proteins in Ultra-Heat-Treated Skimmed Milk by Membrane Technology De-watering (remove of milk serum) of ultra-heat-treated skimmed milk was performed by a tubular nanofiltration membrane with active filtration area 5 × 10⁻³ m2 and pore size 5 nm (Pall Corporation, Crailsheim, Germany), placed in a stainless steel-made cross-flow membrane module (Figure 2). The active layer, support layer, length, inner diameter, and outer diameter of the membrane were titanium oxide, aluminum oxide, 250 mm, 7 mm, and 10 mm, respectively. In the membrane module, feed flow rate was controlled by a centrifugal pump (Verder Hungary Kft, Budapest, Hungary). Flow rate of fluid (milk, water) in the membrane module was also controlled by a rotameter at a retentate flow channel and a bypass channel at the inlet channel of the membrane module. TMP of the membrane module was controlled by pressure gauges, fitted at inlet and retentate flow channels of the membrane module. A mechanical agitator was fitted inside of the storage tank of the membrane module. Temperature in the storage tank of the membrane module was maintained by a temperature sensor and automated circulation of warm/cold water within the water jacket.
Figure 2. Schematic diagram of the cross-flow membrane module.
A mechanical device, known as static turbulence promoter, made of stainless steel (SS316), was inserted within the membrane tube. Detailed geometry of the static turbulence promoter is mentioned in an earlier publication [65]. To investigate the effects of process parameters in filtration process, different TMPs, such as 2 bar and 3 bar, and retention flow rates (RFRs), such as 100 L·h−1 and 200 L·h−1, were used with or without the static turbulence promoter. Each membrane filtration experiment started with 1 L of ultra-heat-treated skimmed milk, and volume reduction factor 2 was considered. Membrane filtration process was performed with a batch recirculation mode. Constant volume of permeate from the membrane was collected at different time fractions and permeate flux (J) was calculated with the following equation.
J = V/(A × t) (1)
Where, J = permeate flux during filtration (L m−2·h−1), V = volume of permeate (L), A = active membrane filtration area (m2) and t = filtration time (h) [66].
In the feed tank, after 50% reduction of volume (volume reduction factor 2), reduction of permeate flux (∆J) was calculated from initial permeate flux with Equation 2.
∆J (%) = (Jinitial – Jfinal) × 100/Jinitial (2) Figure 2.Schematic diagram of the cross-flow membrane module.
A mechanical device, known as static turbulence promoter, made of stainless steel (SS316), was inserted within the membrane tube. Detailed geometry of the static turbulence promoter is mentioned in an earlier publication [65]. To investigate the effects of process parameters in filtration process, different TMPs, such as 2 bar and 3 bar, and retention flow rates (RFRs), such as 100 L·h−1 and 200 L·h−1, were used with or without the static turbulence promoter. Each membrane filtration experiment started with 1 L of ultra-heat-treated skimmed milk, and volume reduction factor 2 was considered. Membrane filtration process was performed with a batch recirculation mode.
Constant volume of permeate from the membrane was collected at different time fractions and permeate flux (J) was calculated with the following equation.
J=V/(A×t) (1)
where, J = permeate flux during filtration (L m−2·h−1), V = volume of permeate (L), A =active membrane filtration area (m2) andt=filtration time (h) [66].
In the feed tank, after 50% reduction of volume (volume reduction factor 2), reduction of permeate flux (∆J) was calculated from initial permeate flux with Equation (2).
∆J(%)=(Jinitial−Jfinal)×100/Jinitial (2)
where,∆J=reduction of permeate flux (−),Jinitial=initial permeate flux (L m−2·h−1) andJfinal=final permeate flux (L m−2·h−1) [65].
During filtration, pressures at inlet and retentate flow channels of the membrane module were recorded. Specific energy consumption (Es) was calculated with Equation (3).
Es=(RFR×∆p)/(Jinitial×A) (3) where,Es=specific energy consumption (kWh·m−3),QR=retention flow rate (L·h−1),∆p=difference of pressure (Newton·m−2),A=active membrane filtration area (m2) andJinitial=initial permeate flux (L m−2·h−1) [65].
After removing the milk serum, membrane cleaning was performed with 1% ultrasil and 1% citric acid in a sequential way with intermediate water cleaning. During cleaning with ultrasil and citric acid, TMP 0.8 bar and RFR 200 L h−1were used. During cleaning with water, TMP 4 bar and RFR 200 L h−1were used. Prior to removing the milk serum, membrane compaction was performed with de-ionized water to achieve the steady state water permeate flux. For that purpose, TMP 4 bar and RFR 200 L·h−1were used [67].
2.3.2. Enzymatic Hydrolysis of Concentrated Proteins in Milk
Milk with concentrated proteins was collected from the storage tank of the membrane module.
Prior to enzymatic reaction, milk with concentrated proteins, pH 7 was pre-incubated until the temperature reached 40◦C in a laboratory-scale well-controlled jacketed bioreactor, working volume 0.6 L and aspect ratio H/D* 2:1 (Solida Biotech, München, Germany). After pre-incubation of milk with concentrated proteins, it was treated with different concentrations of trypsin, such as 0.008 g·L−1, 0.016 g·L−1, 0.032 g·L−1, and 0.064 g·L−1. Individual batch-mode experiments were performed for protein hydrolysis process. For that purpose, 450 µL, 900 µL, 1.8 mL, and 3.6 mL of trypsin solution from stock solution (concentration of trypsin 0.009 g·mL−1) were injected through 0.22µm of polytetrafluoroethylene (PTFE) syringe filter (VWR International, Pennsylvania, USA) to 500 mL of milk with concentrated proteins in bioreactor [67]. Enzymatic reaction was performed at a temperature of 40◦C for 10 min [68,69]. During enzymatic reaction, agitation speed in the bioreactor was maintained, 175 rpm, and the pH of milk in the bioreactor was controlled, 6.8, by automated addition of 2.0 N of sodium hydroxide or hydrochloric acid [67]. After 10 min of enzymatic reaction, 20 mL of sample was collected by a syringe from the bioreactor and kept in a sample tube. Activity of
Processes2020,8, 871 7 of 25
trypsin in enzymatic reaction was stopped by heat treatment. For that purpose, sample tubes were immediately placed in a water bath at temperature 70◦C for 30 min because denaturation temperatures of bovineα-lactalbumin andβ-lactoglobulin are ~75◦C [70–72]. Two control samples (without enzyme treatment) were considered in the experiment: control 1: ultra-heat-treated skimmed milk was heated at temperature 40◦C for 10 min and subsequently placed at temperature 70◦C for 30 min; control 2:
milk with concentrated protein was heated at temperature 40◦C for 10 min and subsequently placed at temperature 70◦C for 30 min. After inactivation of trypsin, the temperature of samples (reaction mixture) was reduced to ambient temperature (~25◦C) and freshly prepared samples were used for all kinds of biochemical assay, described in Section2.4.
2.4. Analytical Method
2.4.1. Understanding of Molecular Weight of Proteins in Concentrated Milk
Molecular weight of proteins in concentrated milk was determined by liquid chromatography- electrospray ionization time-of-flight mass spectrometry (LC-ESI-TOF-MS) (Agilent Technologies, Santa Clara, CA, USA). Sample preparation was performed according to the protocol, mentioned by Rauh et al., 2015 [73]. Briefly, 200µL of concentrated milk was treated with 20µL of 0.5 M DTT, 1 mL of 100 mM trisodium citrate, and 6 M urea at temperature 30◦C for 1 h in a thermostat. Subsequently, a sample was centrifuged at 9500 g for 20 min at temperature 4◦C by a laboratory centrifuge (HERMLE Labortechnik, Wehingen, Germany). Aliquot of the clear phase was collected aseptically and used for LC-MS analysis. Chromatographic separation was achieved by an XBridge BEH300 C4 column with particle size: 3.5µm, and inner diameter x length: 2.1 mm×150 mm (Waters, Milford, USA), placed in an Agilent 1200 HPLC system (Agilent Technologies, Santa Clara, CA, USA). The column temperature was 30◦C during chromatographic separation. The binary mobile phase consisted of Milli-Q ultrapure deionized water with 0.1% formic acid (eluent A), and acetonitrile (eluent B) was used for that purpose. The flow rate was set to 0.5 mL·min−1. Gradient separation started at 3% B and linearly increased to reach 90% in 9 min. The eluent was kept constant at 90% B until 11 min and then the column was re-equilibrated at the initial conditions for 8 min. A UV signal was recorded at 280 nm using the diode-array detector (DAD) in the LC system and the effluent was connected to an Agilent 6530 high-resolution, accurate-mass, quadrupole time-of-flight mass spectrometry system equipped with a dual sprayer electrospray ion source. The mass spectrometry was run with full scan, MS-only mode (2 GHz, extended dynamic range setup) scanning in the range of 50–3200 m/z in positive ionization mode. A continuous reference mass correction was applied using purine and HP-921 (Hexakis(1H,1H,3H-perfluoropropoxy)phosphazene) as reference substances. The ion source temperature was maintained at 325◦C, and capillary and fragmentor voltages were set to−4000 V and 140 V, respectively. The Mass Hunter (MH) Workstation software package (version B02.01) and MH BioConfirm (version B 09.00) (Agilent Technologies, Santa Clara, CA, USA) were used for data acquisition and data evaluation, respectively. For raw mass spectrum deconvolution, the maximum entropy algorithm was used with automatic mass range detection (for intact protein), and for multiply charged ions, 500–3000 m/z limited range was considered.
2.4.2. Understanding of Hydrolysis of Liquid Milk Protein Concentrate
Molecular weight of proteins in ultra-heat-treated skimmed milk, milk with concentrated proteins, and enzyme-treated milks was determined by the sodium dodecyl sulfate polyacrylamide gel electrophoresis (SDS-PAGE) method. For this purpose, a vertical electrophoresis system (Bio-Rad Mini Protean Tetra system) and standard protein marker (precision plus protein standards) from Bio-Rad (Bio-Rad, Hercules, CA, USA) were used. In the SDS-PAGE method, concentration of stacking gel and running gel were 6% and 15%, respectively. The Laemmli sample buffer with 2-mercaptoethanol was used for dilution of samples and 10µL of appropriate diluted sample was loaded into the respective wells. 0.2% Coomassie Brillant Blue R250 was used for gel staining. After 30 min of gel staining,
de-staining of gel was performed with 50% (volume basis) of methanol-water and 10% (volume basis) of acetic acid. Gel image was captured using a Gel Doc XR+System (Bio-Rad, Hercules, USA) and the molecular weight of bands were determined using Quantity One software program (version 4.6) (Bio-Rad, Hercules, CA, USA) [74].
2.4.3. Immunoblotting of Concentrated Milk Proteins
Proteins from SDS-PAGE gel were transferred onto a 0.45µm of polyvinylidene difluoride (PVDF) membrane (Merck-Millipore, Molsheim, France) by a trans blot semi-dry transfer cell (Bio-Rad, Hercules, CA, USA). It was operated with 0.25 V and 0.08 mA/cm2for 60 min. Immune-reactive proteins were identified with clinically proved milk positive pooled human serum and peroxidase-labelled anti-human Immunoglobulin E. The binding patterns were visualized using a substrate solution containing 4-chloronaphtol, hydrogen peroxide, and ethanol in phosphate buffered saline solution.
Image analysis of blots was carried out with Gel Doc 2000 system (Bio-Rad, Hercules, CA, USA) [75].
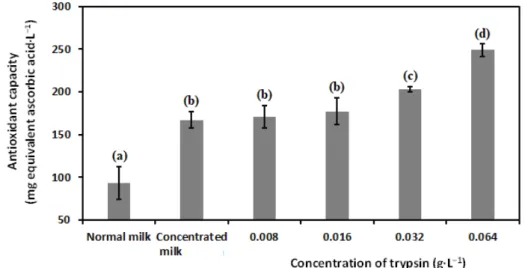
2.4.4. Determination of Antioxidant Capacity
Antioxidant capacity of ultra-heat-treated skimmed milk, milk with concentrated proteins and enzyme-treated milks was measured using the Ferric reducing ability of plasma method with respect of ascorbic acid [76]. Appropriate diluted 100µL of all kinds of milk samples with 2.9 mL of reagent (20 mM of ferric chloride: 10 mM of 2,4,6-Tris(2-pyridyl)-s-triazine with 40 mM of hydrochloric acid:
300 mM of acetate buffer, pH 3.6=1:1:10 (volume basis)) were incubated at temperature ~35◦C for 30 min in a water bath. Colorimetric determination was performed in room temperature (~25◦C) with a UV-Vis spectrophotometer (Thermo ScientificTM, Waltham MA, USA). Spectrophotometric measurement was performed with wavelength 593 nm.
2.4.5. Estimation of Angiotensin-Converting-Enzyme Inhibitory Activity
Enzymatic reaction mixture (final volume 200µL in each well), consisted of 50 mM of sodium chloride, 100 mM of TRIS HCl (pH 7), 10µM of zinc chloride, 15µM of substrate Abz-FRK(Dnp)-P, recombinant angiotensin converting enzyme, and milk samples (in a dilution range of 10-fold to 106-fold) was used in investigation. The amount of the recombinant angiotensin converting enzyme was chosen to result in about 10-fold activity than that in the human serum (dilution was 200 to 400-fold from the stock). Reaction was initiated by the addition of substrate. Changes in fluorescent intensities were recorded in each 2–3 min and then changes were plotted as the function of time. These plots were fitted by a linear fit, and the slope was used to estimate enzyme activity (slope represents the change in fluorescent intensity in one minute). Activities in the absence of milk samples (uninhibited samples) were used as controls. The level of inhibition was calculated as % of uninhibited activity in each plate. Measurements were performed in a fluorescent plate reader (BMG Labtech, Ortenberg, Germany) at temperature 37◦C in Corning 96 wells black and flat bottom plates (Corning, New York, USA). Changes in optical density were measured with wavelength 340 nm for at least 90 min with 5 min intervals [77].
2.4.6. Determination of Protein Concentration
Concentration of protein in ultra-heat-treated skimmed milk, milk with concentrated proteins, and enzyme-treated milks were determined by the Bradford assay. Appropriate dilution of 100µL of all kinds of milk samples with 3 mL of Bradford reagent were incubated at room temperature (~25◦C) for 30 min in a water bath. Colorimetric determination was performed with wavelength 280 nm in a UV-Vis spectrophotometer (Thermo ScientificTM, Waltham, MA, USA). Assay was performed in room temperature (~25◦C) and bovine serum albumin as a standard was used in assay [78].
Processes2020,8, 871 9 of 25
2.4.7. Microbiological Assay
Antibacterial activity of ultra-heat-treated skimmed milk, milk with concentrated proteins, and enzyme-treated milks againstBacillus cereusandStaphylococcus aureusATCC 6538 were investigated.
Antibacterial activity was measured by agar well diffusion method. Sterile soybean casein digestive agar medium was used in the investigation. Freshly prepared (overnight grown culture) each culture was diluted with maximum recovery diluent (MRD) solution (8.5 g sodium chloride+1 g peptone in 1 L of de-ionized water) to reach the bacterial concentration 106colony-forming units mL−1in respective agar plate [79]. Bacterial culture was spread on solidified agar in respective petri plates (pour plated) and agar wells with diameter 5 mm were filled with 100µL of control milk and enzyme-treated milk samples. Petri plates were incubated at temperature 37◦C for 48 h in a biological incubator (HACH, Düsseldorf, Germany) [65,67]. The diameter of zone of inhibitions in microbial plates were measured by excluding the diameter of wells (5 mm) using a digital Vernier caliper (UEMATSU SHOKAI CO., LTD., Sendai, Japan).
2.5. Statistical Analysis
All experiments were performed at three times (technical triplicate). The mean value and standard deviation were calculated by Microsoft Excel (version 2013) (Microsoft Corporation, Washington, DC, USA). Subsequently, one-way analysis of variance method followed by the Tukey’s post hoc test were performed to understand the significant difference (P<0.05) between different groups. SPSS 15.0 (version 25.0) (IBM, Armonk, NY, USA) was used for statistical analysis.
3. Results and Discussion
3.1. Concentrate Milk Proteins in Skimmed Milk by Membrane Filtration
A ceramic tubular membrane with active filtration area 5×10⁻³ m2and pore size 5 nm was used to concentrate milk proteins in ultra-heat-treated skimmed milk by removing milk serum as a permeate. At room temperature and pH ~7, casein micelle may have a mean radius of 50 nm, whereas, the radius of whey proteins, such asα-lactalbumin,β-lactoglobulin, bovine serum albumin, and tetrad immunoglobulin are ~1.8 nm, ~1.8 nm, ~4 nm, and ~6 nm, respectively [80].
Typically, ultra-heat-treated milk is prepared with temperature 135–145◦C and treatment exposure time 1–8 s [81]. Due to heat treatment with high temperature, beside the Maillard reaction, sizes of proteins in milk are changed compared to their conventional sizes. When milk is heated at a temperature above 80◦C, the tertiary structure of whey protein turns to unfold [82]. It has been reported that at a temperature higher than 80◦C, denaturation rate ofα-lactalbumin is faster than β-lactoglobulin’s and denaturation ofα-lactalbumin is faster whenβ-lactoglobulin is present [83,84].
Subsequently, intramolecular highly reactive thiol groups, broken hydrophobic, and disulphide bonds may bind with covalent and hydrophobic bonds among themselves or with casein molecules, especially withκ-casein, present in periphery of casein micelle [85–87]. Furthermore, some whey proteins with sulfur containing thiol group (R-SH) can bind with other proteins by covalent bonds.
Bovine serum albumin andβ-lactoglobulin [88,89], andκ-casein andβ-lactoglobulin [90–92] may bind together due to heat treatment. However,α-lactalbumin does not contain -SH group, it may conjugate with caseins in presence ofβ-lactoglobulin [93]. In addition, heat treatment may promote the formation of isopeptide bond between lysine and glutamine (N-ε-(γ-glutamyl)-lysine) or asparagine (N-ε-(β-aspartyl)-lysine) among different proteins, present in liquid milk protein concentrate [94–96].
Due to faster thermodenaturation ofα-lactalbumin in presence ofβ-lactoglobulin, it may completely conjugate with casein micelle [80]. Therefore, it might expect that most of whey proteins have chance to conjugate with casein and the size of casein micelle might increase. On the other hand, due to intermolecular conjugation of whey proteins, the size of whey proteins might increase. Because of it, most of the proteins might reject by the nanofiltration membrane and residual (unbounded) whey proteins and lactose might permeate with milk serum through membrane pores during nanofiltration.
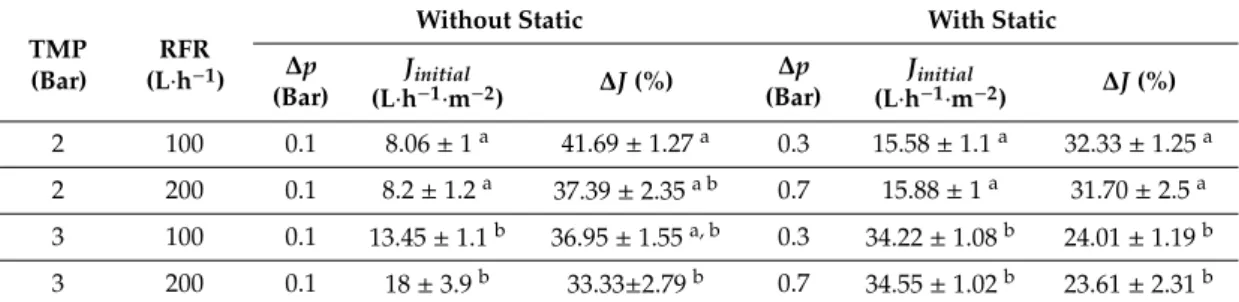
As nanofiltration is a pressure-driven membrane separation process, a gel layer is developed on the membrane surface during separation process. A detailed investigation was performed to reduce the development of gel layer on the membrane surface by changing TMP and RFR. In Table1, initial permeate flux and percentage change of permeate flux for different TMPs and RFRs are reported.
Table 1. Difference of pressure, initial permeate flux and percentage change of permeate flux for different trans-membrane pressures (TMPs) and retention flow rates (RFRs) in absence and presence of static turbulence promoter. Results are represented by mean value with standard deviation (±values).
In superscript, dissimilar alphabet represents the significant difference between results, evaluated by the Tukey’s post hoc method.
TMP (Bar)
RFR (L·h−1)
Without Static With Static
∆p (Bar)
Jinitial
(L·h−1·m−2) ∆J(%) ∆p (Bar)
Jinitial
(L·h−1·m−2) ∆J(%) 2 100 0.1 8.06±1a 41.69±1.27a 0.3 15.58±1.1a 32.33±1.25a 2 200 0.1 8.2±1.2a 37.39±2.35a b 0.7 15.88±1a 31.70±2.5a 3 100 0.1 13.45±1.1b 36.95±1.55a, b 0.3 34.22±1.08b 24.01±1.19b 3 200 0.1 18±3.9b 33.33±2.79b 0.7 34.55±1.02b 23.61±2.31b
It is observed that permeate flux of serum was increased with the increase of TMP, because TMP provided driving force on the membrane surface. At higher TMP, the formation of gel layer on membrane surface was reduced and convective flux of serum increased due to the driving force on the membrane surface. For a similar reason, the percentage change of permeate flux decreased with the increase of TMP. As an outcome, concentration of protein in retentate side of the membrane, increased. As an example, after volume reduction 2, concentrations of protein in storage tank of the membrane module were 59.2 g·L−1and 42 g·L−1, when filtration process was performed with TMP 3 bar, RFR 100 L·h−1 and 2 bar, RFR 100 L·h−1, respectively. At constant TMP, permeate flux was increased at higher RFR;
however, results were not statistically significant. The tubular membrane had the lower surface area to volume ratio and, therefore, high feed flow rate promoted permeation. In cross-flow module, fluid on the membrane surface flowed with horizontal direction on the membrane surface with higher velocity and created more turbulence at higher RFR. Due to the sweeping action of fluid on the membrane surface, the deposition of solute molecules on the membrane surface reduced. Lower deposition of solute molecules on the membrane surface reduced the formation of concentration polarization and gel layer resistance, accompanied by the increase rate of permeation. Moreover, it was found that rate of flux declination was lower when the static turbulence promoter was used in the filtration process. The static turbulence promoter offered tangential velocity of fluid across the membrane surface, which created turbulence and vorticity of fluid on the membrane surface. Furthermore, the static turbulence promoter provided centrifugal force on the fluid, which contributed driving force on the membrane surface.
All these factors reduced the deposition of solute molecules on the membrane surface and membrane gel layer resistance, which offered higher permeate flux in filtration process. As permeate flux was significantly higher in the static turbulence promoter-implemented filtration process, specific energy consumption was studied with different TMPs and RFRs in static turbulence promoter-implemented filtration process (Figure3).
At constant TMP, values of specific energy consumption in filtration process were significantly low at lower RFR. When RFR was 200 L·h−1, permeate flux was not significantly increased compared to 100 L·h−1because RFR could not provide driving force on the membrane surface. Therefore, permeate flux was not significantly increased compared to pressure drop at two opposite ends of the membrane.
Filtration process with static turbulence promoter, higher TMP and lower RFR, tangential velocity of fluid across the membrane surface, driving, and centrifugal force on the fluid were generated. As an outcome, permeate flux was increased and pressure drop was reduced. Protein concentration in the retentate side of the membrane is also represented in Figure3. It is noted that concentration of
Processes2020,8, 871 11 of 25
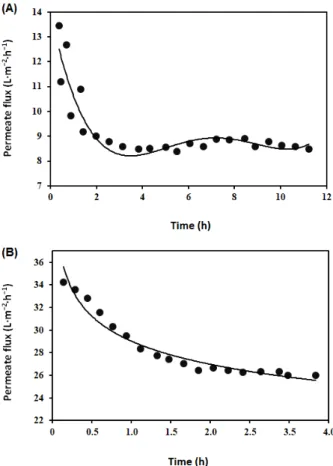
protein in the retentate side was higher with TMP 3 bar compared to TMP 2 bar. Protein concentration increased due to higher permeation of serum through membrane pores at higher TMP. Concentration of protein in retentate was not significantly increased at RFR 200 L·hh−1compared to 100 L·hh−1, because RFR could not generate the driving force on the membrane surface and osmotic pressure. In Figure4, time histories of the permeate flux, without and with the static turbulence promoter, are presented.
Processes 2018, 6, x FOR PEER REVIEW 10 of 25
the membrane surface. For a similar reason, the percentage change of permeate flux decreased with the increase of TMP. As an outcome, concentration of protein in retentate side of the membrane, increased. As an example, after volume reduction 2, concentrations of protein in storage tank of the membrane module were 59.2 g·L−1 and 42 g·L−1, when filtration process was performed with TMP 3 bar, RFR 100 L·h−1 and 2 bar, RFR 100 L·h−1, respectively. At constant TMP, permeate flux was increased at higher RFR; however, results were not statistically significant. The tubular membrane had the lower surface area to volume ratio and, therefore, high feed flow rate promoted permeation.
In cross-flow module, fluid on the membrane surface flowed with horizontal direction on the membrane surface with higher velocity and created more turbulence at higher RFR. Due to the sweeping action of fluid on the membrane surface, the deposition of solute molecules on the membrane surface reduced. Lower deposition of solute molecules on the membrane surface reduced the formation of concentration polarization and gel layer resistance, accompanied by the increase rate of permeation. Moreover, it was found that rate of flux declination was lower when the static turbulence promoter was used in the filtration process. The static turbulence promoter offered tangential velocity of fluid across the membrane surface, which created turbulence and vorticity of fluid on the membrane surface. Furthermore, the static turbulence promoter provided centrifugal force on the fluid, which contributed driving force on the membrane surface. All these factors reduced the deposition of solute molecules on the membrane surface and membrane gel layer resistance, which offered higher permeate flux in filtration process. As permeate flux was significantly higher in the static turbulence promoter-implemented filtration process, specific energy consumption was studied with different TMPs and RFRs in static turbulence promoter-implemented filtration process (Figure 3).
Figure 3. Specific energy consumption and concentration of protein in the retentate side of membrane for different trans-membrane pressures (TMPs) and retention flow rates (RFRs) in static turbulence promoter-implemented filtration process. Results are represented by mean value with standard deviation (± values). In superscript, dissimilar alphabet represents the significant difference between results, evaluated by the Tukey’s post hoc method.
At constant TMP, values of specific energy consumption in filtration process were significantly low at lower RFR. When RFR was 200 L·h−1, permeate flux was not significantly increased compared to 100 L·h−1 because RFR could not provide driving force on the membrane surface. Therefore, permeate flux was not significantly increased compared to pressure drop at two opposite ends of the membrane. Filtration process with static turbulence promoter, higher TMP and lower RFR, tangential velocity of fluid across the membrane surface, driving, and centrifugal force on the fluid were generated. As an outcome, permeate flux was increased and pressure drop was reduced. Protein concentration in the retentate side of the membrane is also represented in Figure 3. It is noted that concentration of protein in the retentate side was higher with TMP 3 bar compared to TMP 2 bar;
Figure 3.Specific energy consumption and concentration of protein in the retentate side of membrane for different trans-membrane pressures (TMPs) and retention flow rates (RFRs) in static turbulence promoter-implemented filtration process. Results are represented by mean value with standard deviation (±values). In superscript, dissimilar alphabet represents the significant difference between results, evaluated by the Tukey’s post hoc method.
Processes 2018, 6, x FOR PEER REVIEW 11 of 25
however, the change was not significant. Protein concentration increased due to higher permeation of serum through membrane pores. Concentration of protein in retentate was not significantly increased because RFR could not generate the driving force on the membrane surface and osmotic pressure. In Figure 4, time histories of the permeate flux, without and with the static turbulence promoter, are presented.
Figure 4. Time history of permeate flux without the static turbulence promoter (a) and with the static turbulence promoter (b). Results are represented by mean value with standard deviation (± values).
In superscript, dissimilar alphabet represents the significant difference between results, evaluated by the Tukey’s post hoc method.
It was noted that when the static turbulence promoter was used in membrane filtration process, rate of flux declination and filtration time were reduced because the formation of gel layer was reduced in the presence of static turbulence promoter inside of tubular membrane.
3.2. Molecular Weight of Different Proteins in Concentrated Milk and Their Enzymatic Hydrolysis
Analysis of molecular weight of different proteins in concentrated milk was performed using UV chromatogram, total ion chromatogram (TIC), and deconvoluted mass spectrum of observed protein spectra (Figure 5).
Figure 4.Time history of permeate flux without the static turbulence promoter (A) and with the static turbulence promoter (B).
It was noted that when the static turbulence promoter was used in membrane filtration process, rate of flux declination and filtration time were reduced because the formation of gel layer was reduced in the presence of static turbulence promoter inside of tubular membrane.
3.2. Molecular Weight of Different Proteins in Concentrated Milk and Their Enzymatic Hydrolysis
Analysis of molecular weight of different proteins in concentrated milk was performed using UV chromatogram, total ion chromatogram (TIC), and deconvoluted mass spectrum of observed protein spectra (FigureProcesses 2018, 6, x FOR PEER REVIEW 5). 12 of 25
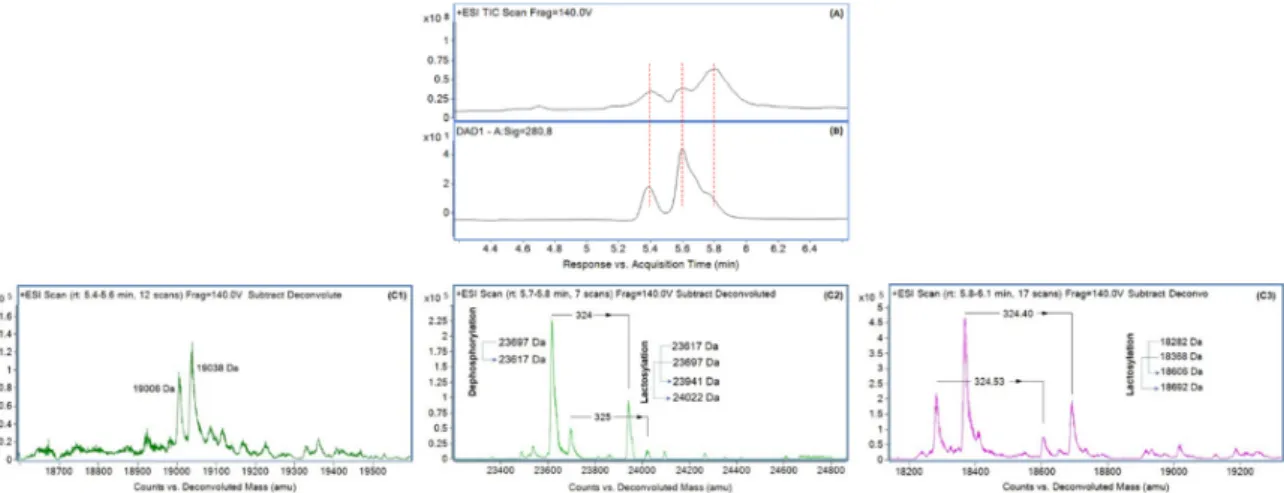
Figure 5. Results of liquid chromatography-mass spectrometry; (A) UV chromatogram of proteins in concentrated milk, (B) total ion chromatogram of proteins in concentrated milk, (C) deconvoluted mass spectra of different proteins, peaks appear at retention time 5.4 min (C1), 5.6 min (C2), and 5.8 min (C3).
Major proteins provided pronounced UV signal at 280 nm. In that UV wavelength, three peaks at 5.4 min, 5.6 min, and 5.8 min retention times were detected. Corresponding MS (TIC) signals are fully matched with UV peaks and deconvolution of each chromatographic peak spectrum was performed. Deconvoluted mass spectrum of proteins appeared in the retention time 5.4 min is provided in Figure C1. In this figure, it is noted that there are two major deconvoluted masses, such as 19006 Da and 19038 Da. According to the previously published results, they might represent κ- casein. Deconvoluted mass spectrum of proteins appeared in retention time 5.6 min is provided in Figure C2. In this figure, two major deconvoluted masses, such as 23617 Da and 23697 Da are observed. Comparing with the previously published results, they might represent α-casein [97].
Protein with molecular mass 23617 Da might be dephosphorylated form of α-casein (-80 Da mass shift from 23697 Da). Different types of caseins have a high degree of phosphorylation, which is generally affected by high temperature treatment during milk processing [98]. Interestingly, two protein with molecular mass shift +324 Da were observed in Figure C2. These proteins with molecular mass 23941 Da and 24022 Da might be the lactosylated form of their original protein. Lactosylation of protein took place due to heat treatment during ultra-heat-treated milk production and, subsequently, their storage. The Amadori product ɛ-lactulosyllysine is produced by free ɛ-amino group of lysine in protein chain and milk sugar lactose [99]. It has been reported that protein become more hydrophilic due to addition of lactose in its structure, which results a shift to lower retention time [100,101]. Deconvoluted mass spectrum of proteins appeared in retention time 5.8 min is provided in Figure C3. In this figure, two major deconvoluted masses, such as 18282 Da and 18368 Da, along with their lactosylated form with molecular mass 18606 Da and 18692 Da are observed.
According to the already published results, the original protein might represent β-lactoglobulin [97].
According to the electrophoretic pattern, represented in Figure 6, ultra-heat-treated skimmed milk and milk with concentrated proteins may have had immunoglobulin, lactoferrin, lactoperoxidase, bovine serum albumin, α-casein, conjugated β-lactoglobulin, and α-lactalbumin or dimer β- lactoglobulin, β-casein, γ-casein, κ-casein, β-lactoglobulin, and α-lactalbumin with molecular weight
~150 kDa, ~80 kDa, ~78 kDa, ~66 kDa, ~35 kDa, ~34 kDa, ~25 kDa, ~22 kDa, ~20 kDa, ~18 kDa, and ~14 kDa, respectively. Some other investigators also published similar results [83,102–104].
Figure 5.Results of liquid chromatography-mass spectrometry; (A) UV chromatogram of proteins in concentrated milk, (B) total ion chromatogram of proteins in concentrated milk, (C) deconvoluted mass spectra of different proteins, peaks appear at retention time 5.4 min (C1), 5.6 min (C2), and 5.8 min (C3).
Major proteins provided pronounced UV signal at 280 nm. In that UV wavelength, three peaks at 5.4 min, 5.6 min, and 5.8 min retention times were detected. Corresponding MS (TIC) signals are fully matched with UV peaks and deconvolution of each chromatographic peak spectrum was performed. Deconvoluted mass spectrum of proteins appeared in the retention time 5.4 min is provided in Figure5(C1). In this figure, it is noted that there are two major deconvoluted masses, such as 19006 Da and 19038 Da. According to the previously published results, they might represent κ-casein. Deconvoluted mass spectrum of proteins appeared in retention time 5.6 min is provided in Figure5(C2). In this figure, two major deconvoluted masses, such as 23617 Da and 23697 Da are observed. Comparing with the previously published results, they might representα-casein [97].
Protein with molecular mass 23617 Da might be dephosphorylated form ofα-casein (-80 Da mass shift from 23697 Da). Different types of caseins have a high degree of phosphorylation, which is generally affected by high temperature treatment during milk processing [98]. Interestingly, two protein with molecular mass shift +324 Da were observed in Figure 5(C2). These proteins with molecular mass 23941 Da and 24022 Da might be the lactosylated form of their original protein.
Lactosylation of protein took place due to heat treatment during ultra-heat-treated milk production and, subsequently, their storage. The Amadori productε-lactulosyllysine is produced by freeε-amino group of lysine in protein chain and milk sugar lactose [99]. It has been reported that protein become more hydrophilic due to addition of lactose in its structure, which results a shift to lower retention time [100,101]. Deconvoluted mass spectrum of proteins appeared in retention time 5.8 min is provided in Figure5(C3). In this figure, two major deconvoluted masses, such as 18282 Da and 18368 Da, along with their lactosylated form with molecular mass 18606 Da and 18692 Da are observed. According to the already published results, the original protein might representβ-lactoglobulin [97]. According to the electrophoretic pattern, represented in Figure6, ultra-heat-treated skimmed milk and milk with concentrated proteins may have had immunoglobulin, lactoferrin, lactoperoxidase, bovine serum albumin,α-casein, conjugatedβ-lactoglobulin, andα-lactalbumin or dimerβ-lactoglobulin,β-casein,
Processes2020,8, 871 13 of 25
γ-casein,κ-casein,β-lactoglobulin, andα-lactalbumin with molecular weight ~150 kDa, ~80 kDa,
~78 kDa, ~66 kDa, ~35 kDa, ~34 kDa, ~25 kDa, ~22 kDa, ~20 kDa, ~18 kDa, and ~14 kDa, respectively.
Some other investigators also published similar results [83,102–104].
Processes 2018, 6, x FOR PEER REVIEW 13 of 25
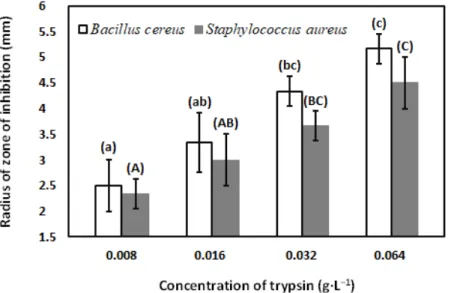
Figure 6. Sodium dodecyl sulfate polyacrylamide gel electrophoresis (SDS-PAGE) image of ultra- heat-treated skimmed milk, milk with concentrated proteins and milk with concentrated proteins after enzyme treatment; lane 1: marker protein, lane 2: standard casein, lane 3: standard α-lactalbumin and β-lactoglobulin, lane 4: ultra-heat-treated skimmed milk, lane 5: concentrated ultra-heat-treated skimmed milk, lane 6: concentrated liquid milk protein treated with 0.008 g L−1 of trypsin, lane 7:
concentrated liquid milk protein treated with 0.016 g L−1 of trypsin, lane 8:concentrated liquid milk protein treated with 0.032 g L−1 of trypsin, lane 9: concentrated liquid milk protein treated with 0.064 g L−1 of trypsin.
In the PAGE image, hydrophobic protein conjugate with molecular weight ~34 kDa is clearly visualized. It was reported that due to heat treatment of skimmed milk, sometimes β-lactoglobulin and α-lactalbumin might participate in intermolecular thiol-disulphide bond interchange to produce covalently bonded hydrophobic aggregates [105]. Another group of investigators reported that at temperature more than 90 °C, β-lactoglobulin might present with disulphide-bonded dimer with molecular weight ~34 kDa and monomer [106]. However, some researchers reported about the formation of dimer α-lactalbumin with molecular weight ~28 kDa [107], but it was not found in our investigation. From the above discussion, it may say that the molecular weight of casein in concentrated milk, determined by SDS-PAGE and mass-spectroscopy is not directly comparable. It may explain by the fact that the electrophoretic mobility of caseins in electrophoresis gel is lower than expected from their molar mass [108]. It may be justified by the fact that phosphorylation [109] and lactosylation of caseins [73] change the migration of casein molecules in electrophoresis gel. However, in SDS-PAGE, several protein aggregates were present, they were absent in mass-spectrum. The possible reason is that dissociation of protein molecules and disruption of any type of protein aggregate might done by reducing agents DTT and chaotropic agent urea in sample preparation for mass-spectroscopy [110].
Without any contradiction, it was found that the numbers of peptide bands were increased due to tryptic digestion of milk proteins (lane 6–9). The hydrolysis of concentrated milk proteins was dose-dependent because it was noted that band numbers with lower molecular weight were increased gradually with increase of enzyme concentration in hydrolysis reaction. Immunoglobulin were hydrolyzed at more than 99% when concentration of trypsin was increased from 0.016 g·L−1 to 0.032 g·L−1. Lactoferrin, lactoperoxidase, and bovine serum albumin were hydrolyzed at more than 99% due to treatment with 0.008 g·L−1 of trypsin. Furthermore, κ-casein and β-casein were hydrolyzed at more than 99% when concentration of trypsin was increased from 0.008 g·L−1 to 0.016 g·L−1, whereas α-casein was retained. Moreover, α-casein was hydrolyzed at more than 99% with 0.064 g·L−1 of
Figure 6. Sodium dodecyl sulfate polyacrylamide gel electrophoresis (SDS-PAGE) image of ultra-heat-treated skimmed milk, milk with concentrated proteins and milk with concentrated proteins after enzyme treatment; lane 1: marker protein, lane 2: standard casein, lane 3: standardα-lactalbumin andβ-lactoglobulin, lane 4: ultra-heat-treated skimmed milk, lane 5: concentrated ultra-heat-treated skimmed milk, lane 6: concentrated liquid milk protein treated with 0.008 g L−1of trypsin, lane 7:
concentrated liquid milk protein treated with 0.016 g L−1of trypsin, lane 8:concentrated liquid milk protein treated with 0.032 g L−1 of trypsin, lane 9: concentrated liquid milk protein treated with 0.064 g L−1of trypsin.
In the PAGE image, hydrophobic protein conjugate with molecular weight ~34 kDa is clearly visualized. It was reported that due to heat treatment of skimmed milk, sometimesβ-lactoglobulin andα-lactalbumin might participate in intermolecular thiol-disulphide bond interchange to produce covalently bonded hydrophobic aggregates [105]. Another group of investigators reported that at temperature more than 90◦C,β-lactoglobulin might present with disulphide-bonded dimer with molecular weight ~34 kDa and monomer [106]. However, some researchers reported about the formation of dimerα-lactalbumin with molecular weight ~28 kDa [107], but it was not found in our investigation. From the above discussion, it may say that the molecular weight of casein in concentrated milk, determined by SDS-PAGE and mass-spectroscopy is not directly comparable. It may explain by the fact that the electrophoretic mobility of caseins in electrophoresis gel is lower than expected from their molar mass [108]. It may be justified by the fact that phosphorylation [109] and lactosylation of caseins [73] change the migration of casein molecules in electrophoresis gel. However, in SDS-PAGE, several protein aggregates were present, they were absent in mass-spectrum. The possible reason is that dissociation of protein molecules and disruption of any type of protein aggregate might done by reducing agents DTT and chaotropic agent urea in sample preparation for mass-spectroscopy [110].
Without any contradiction, it was found that the numbers of peptide bands were increased due to tryptic digestion of milk proteins (lane 6–9). The hydrolysis of concentrated milk proteins was dose-dependent because it was noted that band numbers with lower molecular weight were increased gradually with increase of enzyme concentration in hydrolysis reaction. Immunoglobulin were hydrolyzed at more than 99% when concentration of trypsin was increased from 0.016 g·L−1to