Performance evaluation of finite-source cognitive radio networks with non-reliable
services using simulation
Hamza Nemouchi, János Sztrik
Faculty of Informatics, University of Debrecen Debrecen, Hungary
nemouchih@gmail.com sztrik.janos@inf.unideb.hu
Submitted November 6, 2018 — Accepted December 17, 2018
Abstract
The cognitive radio (CR) is a dynamic spectrum access technique which provides the capability to share a wireless channel between licensed and unli- censed users opportunistically (also called Primary Users - PU and Secondary Users - SU).
In this paper, stochastic simulation is used for performance evaluation of cognitive radio network. A finite-source retrial queuing model with two service units is proposed. A priority queue and an orbit are assigned to the PUs and SUs respectively. The proposed queueing system contains two interconnected, not independent sub-systems. The Primary Channel Service (PCS) and the Secondary Channel Service (SCS) are not reliable and the services are assumed to be subject to a random failure with probabilityp1
andp2for the PCS and SCS, respectively. The failure can be detected after the service and the request retransmission process starts immediately.
The novelty of this work is to analyze the effect of the failure probability on the mean and the variance of the response time of the PUs and SUs, and on the Utilization of the PCS and SCS. The inter-event times are supposed to be exponentially, hypo-exponentially and hyper-exponentially distributed random variables, depending on different cases during simulation.
By the help of simulation we compare the effect of the non-reliability of the servers in different combination of distributions on the first and second moments of the response times of the requests, and the utilization of the doi: 10.33039/ami.2018.12.001
http://ami.uni-eszterhazy.hu
109
system by illustrating on different figures.
Keywords: Retrial queueing systems, simulation, cognitive radio networks, non-reliable servers, performance and reliability measures.
MSC:60K25/68M20/90B22/90B25
1. Introduction
Cognitive radio (CR) has emerged as a promising technology to realize dynamic spectrum access and increase the efficiency of a largely under utilized spectrum. As it was defined in [4], the cognitive radio network (CRN) is a network made up of CRs by extending the radio link features to network layer function and above. By means of CRs cooperation, the network is able to sense its environment, learn from the history, and accordingly decide the best spectrum settings. Many researches have dealt with the opportunistic use of this latter, see for example [5, 11].
In other words, cognitive radio allows efficient use of the available spectrum by defining two types of users in wireless networks: licensed and unlicensed users.
An unlicensed user (also called secondary user (SU)) can use the spectrum if it is not being used at that time by licensed users (also called primary user (PU)).
When the licensed user appears to use the spectrum, the unlicensed user must find another spectrum to use, depending on different paradigms of wraith sharing for the cognitive radio networks. The SU may access the frequency only if it is not used by any PU, from where, the SU flow is interweaved with the PU’s flow. Also, the SU is allowed to transfer simultaneously with the PU only if the interference causing by the SU transfer at the PCS in under some established sill, see for example [21, 23]. Several novel research directions were introduced by the cognitive radio networks. The accuracy of the spectrum sensing which is performed by the SU in order to estimate the PCS occupancy, affects the global system performance.
Likewise, the SU must release the PCS once a PU arrives into the system, the SU waits until the channel will be idle or switch to an another, this operation is called “Spectrum Handoff” where there is a trade-off between these two options.
Also, the resource allocation by trying to initiate an optimal assignment in order to maximize some of the system’s performance parameters. These elements are interlinked and independent. [7, 22, 2].
Queueing theoretical methods have been used in several articles [6] in order to evaluate the performance of the main characteristics on different queueing systems.
This latter consists of users that desire a certain type of service and servers who procure the required service. Therefore, a queueing model is designated in terms of probability distributions of the inter-events times (arrival, service and retrial times). As described, the cognitive radio networks are frequently modelled by the help of the queueing theory where the higher-priority users can preempt the service of lower-priority users according to the appropriate model of the CRN paradigms.
In this paper which is the enlarged and revised version of our conference Pro- ceedings paper [15] we introduce a finite-source queueing model with two (non
independent) frequency channels. The cognitive radio architecture of our model consists of two main networks: The Primary Channel Service (PCS) and Sec- ondary Channel Service (SCS). The PCS refers to the existing network, wherein the primary users (PUs) have got a licensed frequency which does not suffer from overloading. The SCS does not have a license to operate in a licensed frequency.
Hence, SCS is designed to work with PCS to provide the capability to utilize or share the unused spectrum in an opportunistic way. The secondary users have got also a frequency band but it suffers from overloading. In our environment the band of the PUs is modelled by a queue where the requests have preemptive priority over the SUs requests. The band of the SUs is described by a retrial queue: if the band is free when the request arrives then it is transmitted. Otherwise, the request goes to the orbit if both bands are busy. The Primary Service Channel (PCS) and Secondary Service Channel (SCS) are not reliable and the services are assumed to be subject to a random failure with probability p1 and p2 of the PUs and SUs, respectively.
In [17], the authors have applied the queueing theoretical methods on a finite- source cognitive radio network with primary and secondary service units in order to analyze the main performance of the system by the help of tool supported approach. Therefore by the help of a discrete-event simulation, the authors in [18] have investigated the impact of the source and service time’s distribution.
several figures were generated to illustrate the main operational characteristic of the system.
Hence, the novelty of this work is to evaluate the effect of the failure probability on the mean and the variance response time of the PUs and SUs, and on the utilization of the PCS and SCS. By using simulation we compare the effect of the failure probability on the first and second moments of the response times illustrating in different figures.
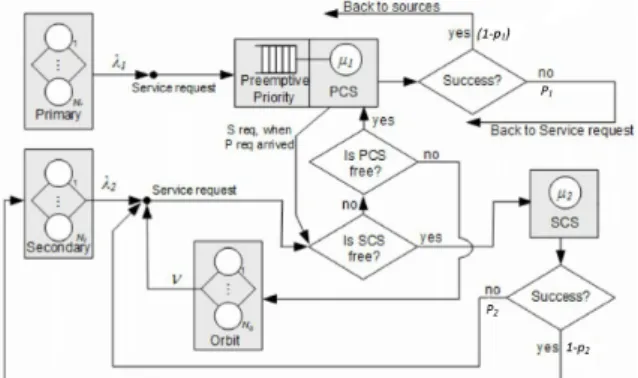
2. System’s operation model
Fig.1 illustrates a finite source queueing system which is used to model the consid- ered cognitive radio network. The queueing system contains two interconnected, not independent sub-systems. The first part is for the requests of the PUs. The number of sources is denoted byN1. These sources generate high priority requests with an exponentially distributed inter-request times with the parameterλ1or with the mean 1/λ1. The generated requests are sent to a single server unit (Primary Channel Service - PCS) with preemptive priority queue. The service times are sup- posed to be exponentially, hypo-exponentially and hyper-exponentially distributed with the same rateµ1 or with the same mean1/µ1.
The second part is for the requests of the SUs. There are N2 sources, the inter-arrival times are exponentially distributed random variables with parameter λ2 and the service times of the single server unit (Secondary Channel Service - SCS) is assumed to be exponentially, hypo-exponentially and hyper-exponentially distributed random variables with the same mean1/µ2.
Figure 1: Finite-source retrial queueing system: Modeling the Cog- nitive Radio Network
A generated high priority packet goes to the primary service unit. If the unit is idle, the service of the packet begins immediately. If the server is busy with a high priority request, the packet joins the preemptive priority queue. When the unit is engaged with a request from SUs, the service is interrupted and the interrupted low priority task is sent back to the SCS. Depending on the state of secondary channel, the interrupted job is directed to either the server or the orbit and starts again its service from the beginning. The transmission through the radio channel may produce errors, which can be detected after the service and produce a failure. In the model, this case has a probabilityp1, and the failed packet is sent back to the appropriate service unit. When the submission, is successful (probabilities1−p1), the requests goes back to the source. In case of requests from SUs. If the SCS is idle, the service starts, if the SCS is busy, the packet senses the PCS. In case of an idle PCS, the service of the low priority packet begins at the high priority channel (PCS). If the PCS is busy, the packet goes to the orbit. From the orbit it retries to be served after an exponentially distributed time with parameter ν. The same transmission failure with the probabilityp2 may occur as in the PCS segment.
To create a stochastic process describing the behaviour of the system, the fol- lowing notations are introduced
• k1(t)is the number of high priority sources at timet,
• k2(t)is the number of low priority (normal) sources at timet,
• q(t) denotes the number of high priority requests in the priority queue at timet,
• o(t)is the number of requests in the orbit at timet.
• y(t) = 0if there is no job in the PCS unit, y(t) = 1if the PCS unit is busy with a job coming from the high priority class,y(t) = 2when the PCS unit is servicing a job coming from the secondary class at timet
• c(t) = 0 when the SCS unit is idle and c(t) = 1, when the SCS is busy at timet.
It is easy to see that
k1(n) =
(N1−q(t), y(t)= 0,2 N1−q(t)−1 y(t)= 1
k2(n) =
(N2−o(t)−c(t), y(t)= 0,1 N2−o(t)−c(t)−1 y(t)= 2
In this paper, the numerical results are obtained by the validation of the simula- tion outputs. In the case of exponentially distributed inter-event time, a continuous time Markov chain can be constructed and the main steady-state performance mea- sures can be obtained, see [16]. In this work, we deal with more general situations allowing non-exponentially distributed times. The input parameters are collected in Table 1.
Parameter Maximum Value att
Active primary sources N1 k1(t) Active secondary sources N2 k2(t)
Primary generation rate λ1
Secondary generation rate λ2
Requests in priority queue N1- 1 q(t)
Requests in orbit N2- 1 o(t)
Primary service rate µ1
Secondary service rate µ2
Primary service error probability p1
Secondary service error probability p2
Retrial rate ν
Table 1: List of simulation parameters
3. Simulation results
Since most input parameters of simulation models are random variables, the output data are also random variables (observations). Hence, in this paper the output data are also random variables with a finite population mean and finite population variance. The difficulty of using an estimator of the mean without any additional information is that we have no approach to determine how close the estimator is to the mean. As shown in [12], the estimator may be adjacent to the mean on one analysis while it may diverge by a large difference on an another. The common method used in the simulations to evaluate the precision of the estimator for the mean is to construct the confidence interval for this latter.
In order to estimate the mean and variance of the response times and set up its confidence interval, the batch means method is used which consists to divide the output data from the simulation run into few large portions, and then treats the means obtained from these portions as if they were independent, knowing that the first data collections in the beginning of the simulation run are negligible and this period is called “the warm-up period”. See [19]
The batch mean method is the most popular confidence interval technique for the output analysis of a steady-state simulation, see for example [8, 3, 20].
There are many possible combinations of the cases, We consider only the fol- lowing sample results showing the effect of the failure probability of services on the mean and variance response time and the utilisation of PCS and SCS. For the easier understanding the numerical values of parameters are collected in Table 2.
No. N1,N2 λ1 λ2 µ1,µ2 ν p1 p2
Fig.2, Fig.3 10 0.02 0.03 1 20 x - axis 0.1
Fig.4,Fig.5 10 0.02 0.03 1 20 x - axis 0.1
Fig.6, Fig.7 10,50 0.02 0.03 1 20 x - axis 0.1
Fig.8, Fig.9 10 x - axis 0.03 1 20 0.3, 0.6 0.3, 0.6 Fig.10, Fig.11 10 x - axis 0.03 1 20 0.3, 0.6 0.3, 0.6 Fig.12, Fig.13 10 0.02, 0.06 0.03 1 20 x - axis 0.1
Fig.14 10 0.02 0.03 1 20 0.1 x - axis
Table 2: Numerical values of simulation parameters
3.1. Illustrations and comments
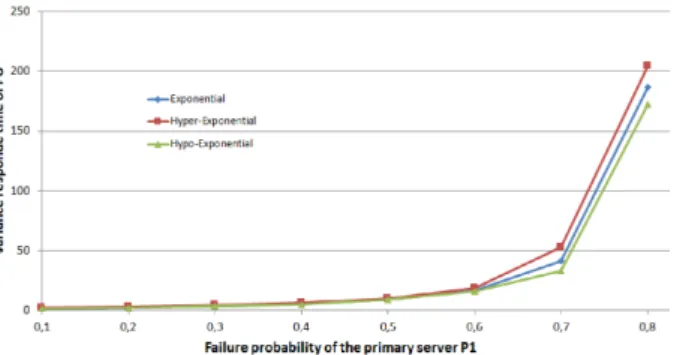
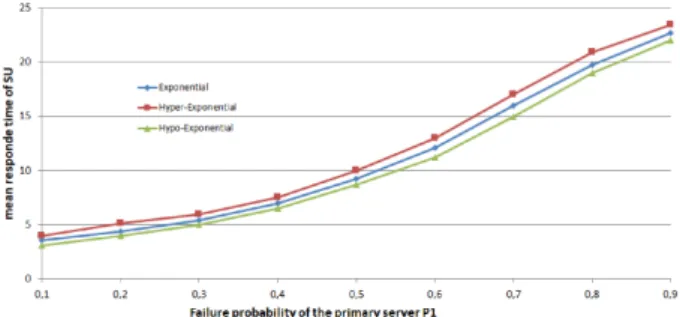
Figure 2 and Figure 3 illustrate the effect of the failure probability of the PCS on the mean and the variance response time while the transmission in the primary channel may occur errors more often. In this simulation case, the distribution of the inter-request time of SUs and the service time of the secondary service unit are exponentially distributed random variable, however, the service time of the primary server is exponentially, hypo-exponentially and hyper-exponentially dis- tributed random variable. The figures show that increasing the failure probability of the services involves longer response time of the users. Similarly, the value of variance is Also rising while the failure probability increases.
Likewise, the Figure 4 and Figure 5 show how the utilizations of the primary and secondary service channel are larger when the probability of the services failures is increasing on this part of system.
Therefore, the impact of the primary service failure probability on the mean and variance response time of the secondary users (SUs) is displayed in the Figure 6 and Figure 7. In this case of the simulation, The inter-arrival times of the customers and the service time of the Primary server are exponentially distributed random variable, as for the service time of the secondary server is generally distributed ran- dom variable (Hypo-exponential and Hyper-exponential distributions). Regarding
Figure 2: The effect of the failure probability of the PCS on the mean response time of the PUs
Figure 3: The effect of the failure probability of the PCS on the variance response time of the PUs
the opportunistic use of the primary service channel (PCS) by the secondary cus- tomers (SUs) in the cognitive radio networks, the failure of the services at the PCS level causes longer waiting time for the secondary calls. Hence, a high probability of primary service failure affects the mean and the variance response time of the secondary users (SUs) by involving longer response time for the customers.
Otherwise, the previous figures show the effect of the distribution of the service time on the mean, variance response time and the utilization of service units. It is the consequence of [18], in where it was proved that the steady-state distribution is sensitive to the distribution of the service time.
The other case of simulation is where the Primary Service Channel (PCS) is less reliable than the Secondary Service Channel (SCS) and where the PCS is more reliable than the SCS, supposing that the inter-request times are exponentially dis- tributed random variable and the service times are hyper-exponentially distributed random variables.
Figure 4: The impact of the failure probability of the PCS on the Utilization of the PCS
Figure 5: The impact of the failure probability of the PCS on the Utilization of the SCS
Figure 6: The impact of the failure probability of the PCS on the mean response time of the SUs
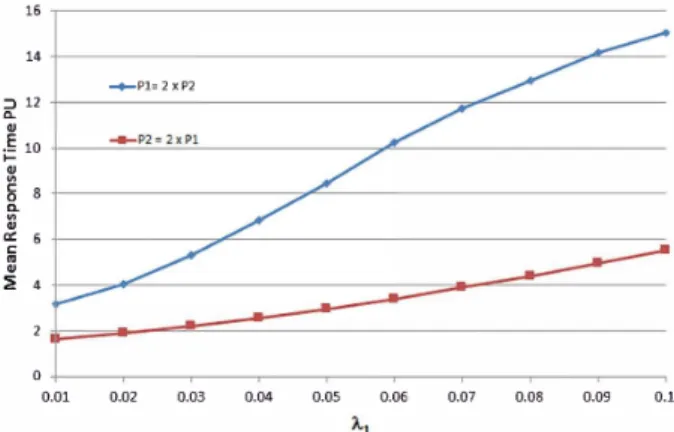
The Figure 8 and Figure 9 illustrate the effect of the failure probability of the servers on the mean response time of the users in terms of the primary inter-request rate (λ1).
Figure 7: The impact of the failure probability of the PCS on the variance response time of the SUs
Figure 8: The effect of the failure probability of the services on the mean response time of the PUs vsλ1
The Figure 8 demonstrates the difference on the mean response time of the PUs where the PCS is less reliable than the SCS and the contrary case. The Figure 9 shows the effect of the failure probability of the servers on the mean response time of the SUs. As it was expected in the cognitive radio networks, when the PCS is not reliable and increasing the primary arrival intensity (λ1), the mean response time of the SUs becomes a constant.
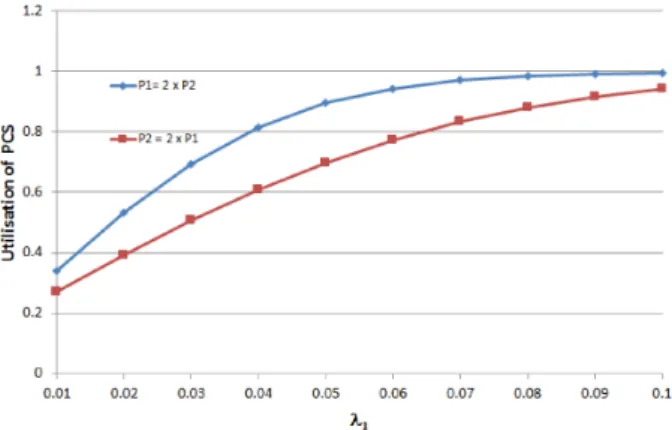
The Figure 10 and Figure 11 illustrate the effect of the failure probability of the servers (p1 and p2) on the utilization of the servers in terms of the primary inter-request rate (λ1). In the Figure 10, when increasingλ1 the utilization of the PCS is almost the same when the PCS is less reliable than the SCS, similarly in the opposite case, when the SCS is less reliable than the PCS. Hence, in the Figure 11, the utilisation of the SCS becomes a constant when the PCS is less reliable than the SCS and when the arrival intensity higher.
The other results of the several cases of the simulation are illustrated in the figures that show the effect of the inter-request times on the mean response time of the customers and the utilization of the servers in terms of the failure probability
Figure 9: The effect of the failure probability of the services on the mean response time of the SUs vsλ1
Figure 10: The effect of the failure probability of the services on the utilization of the PCS vsλ1
of the primary services (p1).
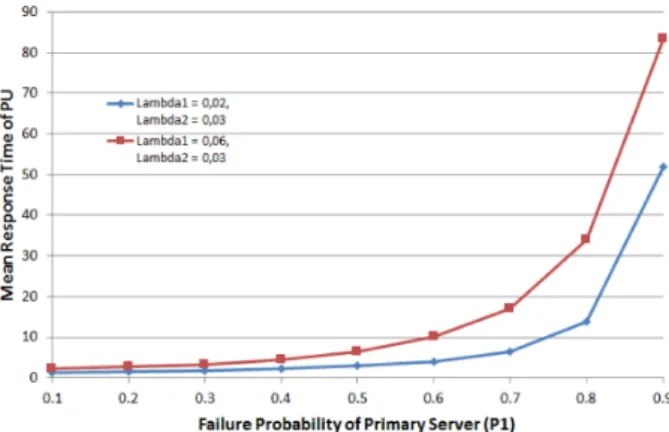
The Figure 12 shows the effect of the primary arrival rate (λ1) on the mean response time of the PUs. Here also as it was expected,increasing the primary failure probability (p1) involves longer response time of the PUs. Otherwise, the Figure 13 shows that the mean response time of the SUs is insensitive to the primary arrival rate (λ1) when the primary failure probability (p1) is high.
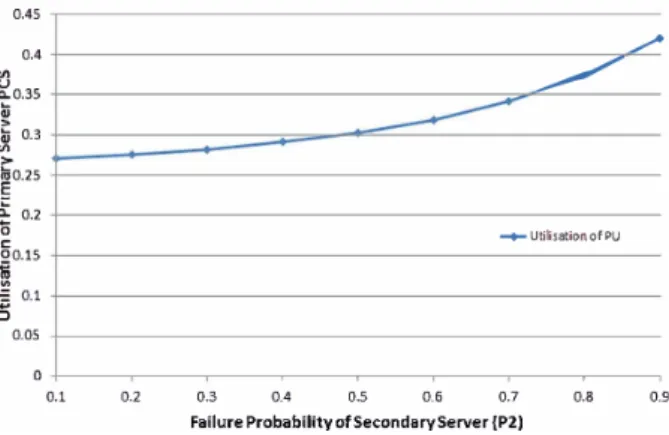
In the Figure 14, according to the cognitive radio networks paradigms and as shown in the previous figures, we see that the utilization of the PCS depends on the failure probability of the SCS (p2). It shows that more the SCS is not reliable, more the utilization of the PCS increase.
Figure 11: The effect of the failure probability of the services on the utilization of the SCS vsλ1
Figure 12: The effect of the inter-request rate on the mean response time of the PUs vsp1
4. Conclusion
In this paper a finite-source retrial queueing model was proposed with two channels servicing primary and secondary users in a cognitive radio network. Primary users have preemptive priority over the secondary ones in servicing at primary channel.
An orbit was constructed at the secondary channel, for the secondary packets find- ing the both servers busy upon arrival or those who their service was interrupted.
Supposing that the services may fail or be interrupted after the service time, sim- ulation was used to obtain several sample examples illustrating the effect of the failure probability of the services on the first and second moments of the response times, also the utilization of the servers.
Figure 13: The effect of the inter-request rate on the mean response time of the SUs vsp1
Figure 14: The effect of the failure probability of the SCS on the Utilization of the PCS
Acknowledgements. The Stipendium Hungaricum has supported the work of H. Nemouchi.
References
[1] H. AhmedandS. A. AlQahtani. 2015. Performance evaluation of joint admission and eviction controls of secondary users in cognitive radio networks.Arabian Journal for Science and Engineering 40(2015), 34469–34481.
[2] M. G. Di Benedetto, A. F. Cattoni, J. Fiorina, F. Bader, and L. De Nardis. 2015. Cognitive Radio and Networking for Heterogeneous Wireless Net- works. Springer.
[3] E. CarlsteinandD. Goldsman. 1986. The use of subseries values for estimating the variance of a general statistic from a stationary sequence. Annals of Statistics 14(1986), 1171–1179.
[4] N. Devroye,M. Vu, andV. Tarock. 2008. Cognitive radio networks.IEEE Signal Processing Magazine 25(2008), 12–23.
[5] T. V. Do,N. H. Do,A Horváth, andJ. Wang. 2015. Modelling Opportunistic Spectrum Renting in Mobile Cellular Networks. Journal of Network and Computer Applications 52(2015), 129–138.
[6] T. V. Do,P. Wüchner,T. Bérczes,J. Sztrik, andH. de Meer. 2014. Spectrum Renting with Two Finite Source Pools in Mobile Cellular Networks. Asia-Pacific Journal of Operational Research 31, 2 (2014), 19.
[7] A. S. Alfa F. Paluncic,B. T. Maharaj, andH. M. Tsimba. 2018. Queueing models for cognitive radio networks: A survey.IEEE Access09(2018), 50801–50823.
[8] G. S. Fishman. 2001. Discrete-Event Simulation: Modeling, Programming, and Analysis. Springer.
https://doi.org/10.1007/978-1-4757-3552-9
[9] N. J. Gunther. 2011.Analyzing Computer System Performance(2 ed.). Springer.
[10] M. Harchol-Balter. 2013. Performance Modeling and Design of Computer Sys- tems: Queueing Theory in Action. Cambridge University Press.
[11] A. HorváthandT. Bérczes. 2015. Spectrum Renting with Two Finite Source Pools in Mobile Cellular Networks. Communications - Scientific Letter of the University of Zilina1/a2015 (2015), 4–11.
[12] A. M. LawandW. D. Kelton. 1991. Simulation Modeling and Analysis (second ed.). McGraw-Hill College.
[13] O. León, J. Hernández-Serrano, and M. Soriano. 2010. Securing cognitive radio Networks. International Journal of Communication Systems 23(2010), 633–
652.
[14] P. F. Moeller. 2004. Mathematical and Computational Modeling and Simulation:
Fundamentals and Case Studies. Springer.
https://doi.org/10.1007/978-3-642-18709-4
[15] H. NemouchiandJ. Sztrik. 2017. Performance evaluation of finite-source cogni- tiver radio networks with non-reliable services using simulation. Proceedings of the 10th International Conference on Applied Informatics (2017), 225–234.
https://doi.org/10.14794/ICAI.10.2017.225
[16] J. Sztrik. 1985. On the finite-source G/M/r queues. European Journ. Oper. Res 20(1985), 261–268.
https://doi.org/10.1016/0377-2217(85)90068-2
[17] J. Sztrik,T. Bérczes,B. Almási,A. Kuki, andJ. Wang. 2016a. Performance Modeling of Finite-Source Cognitive Radio Networks.Acta Cybernetica22, 3 (2016), 617–631.
https://doi.org/10.14232/actacyb.22.3.2016.5
[18] J. Sztrik,T. Bérczes,H. Nemouchi, andA. Z. Melikov. 2016b. Performance modeling of finite-source cognitive radio networks using simulation.Communications in Computer and Information Science. Springer 678(2016), 64–73.
https://doi.org/10.1007/978-3-319-51917-3_7
[19] J. Tyser. 1999. Object-Oriented Computer Simulation of Discrete-Event Systems (first ed.). Springer Science, LLC.
[20] A. J. White,J. W. Schmidt, andG. K. Bennett. 1975. Analysis of Queueing Systems (first ed.). Academic Press, INC.
[21] E. W. Wong, C. H. Foch, and F. Adachi. 2011. Analysis of cognitive radio spectrum decision for cognitive radio networks. IEEE Journal on Selected Areas of Communication 29(2011), 757–769.
[22] Y. XiaoandF. Hu. 2008. Cognitive Radio Networks. CRC Press.
[23] Y. Zhang,J. Zhend, andH. Chen. 2010.Cognitive Radio Networks: Architectures, Protocols, and Standards. CRC Press.