A TUDATOSSÁGON ALAPULÓ SZERVEZETI MŰKÖDÉS
AVAGY A MINDFULNESS SZERVEZETI SZEREPÉT TÁRGYALÓ IRODALOM BEVEZETŐ ÁTTEKINTÉSE
In this study, it is searched the relationship between the organizational climate for innovation and innovative work beha- vior of the employees in the ICT “Information and Communication Technology” sector in Turkey. According to the findings of this study, positive innovative climate in the organization has a significant and positive effect on the innovative work behavior of the employees whereas, negative innovative climate in the organization has a negative impact on the inno- vative work behavior of the employees. Resource supply for the innovation in the organization has also a significant and positive effect on the innovative work behavior of the employees. However this effect is relatively weaker than the effect of the positive innovative climate in the organization.
Keywords: organizational climate for innovation, innovative work behavior, innovation, positive innovative climate, nega- tive innovative climate, resource supply for the innovation, idea generation, idea implementation
A szerző ebben a tanulmányában a szervezeti innovációs légkör és az alkalmazottak innovációs magatartása közötti kap- csolatot vizsgálja a török információtechnológiai (ICT) szektorban. A tanulmány eredményei alapján megállapítható, hogy a pozitív innovációs klíma szignifikáns és pozitív hatású a munkahelyi innovációs magatartásra, míg a negatív innovációs klíma a szervezetben negatívan befolyásolja az alkalmazottak innovációhoz való viszonyát. A szervezet innovációs erőfor- rása szintén jelentős és pozitív hatást gyakorol a munkavállalók innovatív munkaviszonyára. Ez a hatás viszonylag gyen- gébb, mint a pozitív innovatív szervezeti légkör.
Kulcsszavak: szervezeti innovációs klíma, innovációs magatartás, innováció, pozitív innovációs klíma, negatív innovációs klíma, innovációs erőforrások, ötletgenerálás, ötletmegvalósítás
Funding/Finanszírozás:
The author did not receive any grant or institutional support in relation with the preparation of the study.
A szerző a tanulmány elkészítésével összefüggésben nem részesült pályázati vagy intézményi támogatásban.
Author/Szerző:
Ömür Önhon, PhD, associate professor, Tomori Pál College (omur_onhon@yahoo.com.tr) This article was received: 18.03.2019, revised: 07.07.2019, accepted: 17.07.2019.
A cikk beérkezett: 2019.03.18-án, javítva: 2019.07.07-én, elfogadva: 2019.07.17-én.
VERDES TAMÁS
THE RELATIONSHIP BETWEEN ORGANIZATIONAL CLIMATE FOR INNOVATION AND EMPLOYEES’ INNOVATIVE WORK BEHAVIOR:
ICT SECTOR IN TURKEY
A SZERVEZETI INNOVÁCIÓS LÉGKÖR ÉS AZ ALKALMAZOTTAK INNOVÁCIÓS MAGATARTÁSA KÖZÖTTI KAPCSOLAT:
AZ ICT SZEKTOR TÖRÖKORSZÁGBAN
ÖMÜR ÖNHON
I
n today’s business world, innovation has become vital in all areas. It has become essential that firms must take place in the market with innovative products and services, also make innovations in business processes in order to be able to adapt to continuously changing conditions, respond to highly diversified customer needs, control the costs and therefore gain sustainable competitive advantage. Porter (1991) stated that one of the most critical factors for the firms to gain competitive advantage is creativeness and innovati- on. King et al. (2007) also suggested that innovation might generate procedures and ideas which enhance productivity.Technology entering our lives day by day makes our lives easier at one side, however creates new requirements on the other side. Today’s information driven firms must particularly be innovative in order to be in a good position in the competitive environment (Kwasniewska & Neçka, 2004). Firms, especially technologically-driven ones, need to be more creative and innovative than before in order to survive, to compete, to grow, and to lead (Jung et al., 2003). Otherwise, such firms that are not able to adapt to change and make innovations in this direction, would not be able to survive (Drucker, 1998).
We may argue that the primary way for the firms of participating in their field of activity with more innovative product and services is to motivate their human resources to innovativeness. Similarly, Imran and Anis-ul-Haque (2011) argued that the organizations willing to maintain their competitive edge foster the innovative work behavior of their employees. Miron, Erez and Naveh (2004) found that individual innovation does not diminish the quality and efficiency of normal work. Employees are well able to balance between being innovative and paying attention to their regular work. They conclude that personal and orga- nizational characteristics necessary to promote innovation, quality and efficiency complement rather than compete with each other (Miron, Erez & Naveh, 2004). Genera- tion and realization of creative ideas in an organization can only be possible if employees at all levels are provided with necessary resources and encouraged for innovation.
One way for organizations to become more innovative is to capitalize on their employees’ willingness and ability to be innovative (De Jong & Hartog, 2010). Amabile and Pratt (2016) stated that in the absence of the motivation to innovate, or resources in the task domain, or skills in in- novation management, innovation cannot happen. Camp- bell, Gasser and Oswald (1996) empirically demonstrated a positive link between innovation-specific behaviors and organizational performance. Many researchers also stated that innovative behaviors of employees will have positive effect on firms’ success (Amabile & Rigolizzo, 2015; Ax- tell et al., 2000; Smith, 2002; Unsworth & Parker, 2003;
Cited in: De Jong & Hartog, 2007, p. 41-64).
Amabile (1996) defined creativity as the production of novel and useful ideas in any domain, innovation as the suc- cessful implementation of those ideas within an organization.
Amabile (1996) also stated that all humans with normal ca- pacities are able to produce at least moderately creative work in some domain, some of the time and that the social environ- ment can influence both the level and the frequency of creative
behavior. A number of theorists have suggested that climate may channel and direct both attention and activities toward innovation (Amabile, 2000; Kanter, 1988). Others have noted that innovative organizations are characterized by an orien- tation toward creativity and innovative change, support for their members in functioning independently in the pursuit of new ideas (Siegel & Kaemmerer, 1978), and a tolerance for diversity among their members (Siegel & Kaemmerer, 1978).
Finally, adequate supplies of such resources as equipment, fa- cilities, and time are critical to innovation (Amabile, 2000;
Angle, 2000) and the supply of such resources is another manifestation of the organizational support for innovation.
İşcan and Karabey (2007) stated that in order to suc- ceed in today’s rapidly changing business environment, human capital plays a major role and it is very important to establish a workforce producing constantly new ideas and to implement them in the organization. Thus, it is essential to build a strong organizational climate that supports in- novation. Innovation can only be nurtured and grow in an organizational climate that encourages to put forward new ideas. Such a climate will work as a tool to help employees pay their attention to innovation and develop a collective mentality supporting innovation (İşcan & Karabey, 2007).
In Turkey, thanks to technological advances in recent years that many innovation potentials has entered our lives. Thus, customer needs and demands in ICT (Infor- mation and Communication Technology) sector has been changed to a very large extent and competition between the firms providing such services increased to the same extent. Companies operating in the ICT sector should have to make continuous innovations in their products, servic- es and business processes in order to manage this major change, satisfy their customers and step ahead of the com- petition by controlling their costs.
Those companies can be truly and sustainably innovative companies if only their employees generate innovative ideas and implement those ideas in the organization. Thus, it is con- sidered the most prominent factors could be to establish an organizational climate where the employees are supported for innovative activities, can express their ideas freely and access the necessary resources easily in the organization.
In this study, the relationship between organizational cli- mate for innovation and employees’ innovative work behavior in ICT sector in Turkey shall be investigated. It is considered that the results of this study will contribute to the managers working in ICT sector in order them to provide their subordi- nates a business environment that encourages innovation that positively effects subordinates’ innovative work behavior.
Literature review
Innovative Work Behavior
Many research focus mainly on the creativity or idea gen- eration. However, innovation as the theory stresses that also includes the implementation of the ideas (King & Anderson, 2002). King and Anderson (2002) define innovation as new to the social setting in which it is introduced, although not nec- essarily new to the person(s) introducing it, based on an idea which is a necessary but not a sufficient condition for inno- vation, aimed at producing some kind of benefit, intentional
rather than accidental, apart from financial gains, possible benefits might be personal growth, increased satisfaction, im- proved cohesiveness or better interpersonal communication.
Based on the above definitions, De Jong (2007, p. 19) described innovative work behavior (IWB) as “individuals’
behaviors directed towards the initiation and intentional in- troduction (within a work role, group or organization) of new and useful ideas, processes, products or procedures”.
According to Baer (2012) and Kanter (1988), IWB refers to the development and initiation of novel and useful ideas and implementing these ideas into new and improved products, services or ways of doing things. Rules and regulations and procedures are not sufficient to ensure effective employee behavior in the workplace, there is always some need for dis- cretionary innovative actions to adapt to new situations and unusual circumstances (Janssen, 2003). Especially the firms operating in technology domain should be more creative and innovative rather than they did in the past in order to survive, compete, grow and lead (Jung et al., 2003). IWB implies that individuals go beyond the scope of their job requirements to be innovative of their own free will. It includes idea genera- tion as well as the types of behavior needed to implement improvements that will enhance personal and/or business performance. The construct of IWB thus captures both the initiation and implementation of ideas. In doing so, IWB dif- fers from more limited constructs such as employee creativ- ity which focuses on the discovery and generation of ideas (De Jong, 2007). Initiation for idea generation is a divergent phase, including activities such as the recognition of problems and thinking about ways to improve things. This phase results in more suggestions for innovations, such as new products, services or work processes. Implementation is a convergent phase directed towards the development and launch of inno- vations in order to acquire their benefits (King & Anderson, 2002). King and Anderson (2002), described innovation pro- cess as two main phases: initiation and implementation. The dividing line between the two phases is believed to be the point of the first adoption of the innovation; that is, the point at which the decision is made to implement the idea. First phase ends with the generation of the idea and second phase ends with the realization of the idea (King & Anderson, 2002).
Scott and Bruce (1994) first regarded innovative work behavior as a multistage process and stated that innovation consists of multistage and discontinuous activities as idea generation, idea promotion and idea implementation and in- dividuals can be expected to be involved in any combination of these behaviors non sequentially and at any time. Based on in-depth interviews with managers of an R&D facility and drawing on Kanter’s (1988) work on the stages of in- novation, they developed a six-item scale. Leaving out the transfer task, Scott and Bruce’s (1994) measure captures the behaviors of idea generation, coalition building and idea realization as Kanter (1988) stated four major dimensions:
idea generation, coalition building, idea realization and transfer. Janssen (2000), referring to Scott and Bruce (1994), he regarded IWB as consisting of three dimensions, namely idea generation, idea promotion and idea implementation.
Individual innovation begins with idea generation, that is the production of novel and useful ideas in any domain (Am-
abile & Rigolizzo, 2015; Kanter, 1988). These ideas are the first task of innovation process and can stem not only from creative ideas that originate within organization but also from the ideas adapted from the existing situation which resulted in innovation as well. Perceived work-related problems, in- congruities, discontinuities, and emerging trends are often instigators of the generation of novel ideas (Drucker, 2014).
Problems at the existing work flow, insufficient response to customer requests or market trends change can be examples to such instigators (De Jong & Hartog, 2007). Employees re- spond to these situations with new ideas such as developing new products and services, reengineering the working styles and/or processes (Kanter, 1988; Amabile, 1988).
The next task of the innovation process consists of idea promotion to potential allies. At its core, innovation is a sociopolitical process that can be expected to be re- sisted by organizational members who are committed to the existing frameworks of thoughts and actions (Janssen, 2003; Kanter, 1988; cited in: Janssen, 2005). Therefore, a worker’s innovative behavior is likely to be obstructed by resisting co-workers who have an interest in safeguarding the existing paradigm or who want to avoid the uncertainty and insecurity surrounding change. Taken together, on the basis of literature on resistance to change, co-workers are likely to resist a worker’s innovative ideas for change be- cause of their desire to avoid the insecurity and stress sur- rounding change, their habits and preferences for familiar practices and actions, their wish to reduce cognitive disso- nance, and their commitment to the established framework of theories and practices. This resistance to change can be conceived as interpersonal conflict in the sense that the in- novative worker who is pushing forward ideas for change is obstructed or irritated by the resisting co-workers who prevent this change. Besides conflict with co-workers, a worker’s innovative behavior might also be resisted by other actors in the work environment, such as supervi- sors, subordinates or other stakeholders of the organiza- tion (Janssen, 2003). That is, once a worker has generated an idea, he or she has to engage in social activities to find friends, backers, and sponsors surrounding an idea, or to build a coalition of supporters who provide the necessary power behind it (Kanter, 1988; cited in: Janssen, 2000).
The final task of the innovation process concerns idea realization by producing a prototype or model of the in- novation that can be experienced and ultimately applied within a work role, a group or the total organization (Kanter, 1988). Simple innovations are often completed by individual workers involved, while the accomplishment of more complex innovations usually requires teamwork based on a variety of specific knowledge, competence, and work roles (Kanter, 1988). Additionally, implementation of human resources strategies, administrative policies such as labor health and safety or team work implementations can also be evaluated in terms of innovation. For example, starting a teamwork activity in a public department gov- erned by highly formal rules where many people cannot even communicate each other healthily can also be con- sidered as an innovative practice. Innovations may vary from those that are relatively minor, to those that are of
great significance. Some innovations can be introduced in an hour while others may take several years. Some innova- tions are unplanned and emerge by accident. In contrast some innovations are planned and managed (West, 2002).
Organizational Climate for Innovation
There are the meanings accepted in the organization emerging as a result of interaction between individuals that are consisted of common values, norms and their meanings of symbolic expressions. Senses, approaches and behaviors that characterize the organizational life can be defined as organizational climate (Özçer, 2005). Sch- neider et al. (2011) conceptualized climate as employees’
shared perceptions of organizational events, practices, and procedures. These perceptions are assumed to be primar- ily descriptive rather than affective or evaluative (Sch- neider & Reichers, 1983; Schneider et al., 2011; cited in:
Schneider, Ehrhart & Macey, 2013).
Schneider and Reichers (1983) expressed that it is meaningless to speak about organizational climate with- out attaching a referent. Schneider suggests that the di- mensions of organizational climate will differ depending on the purpose of the investigation and the criterion of interest, and that general measure of organizational cli- mate will contain dimensions that are not relevant for each specific study (Scott & Bruce, 1994). For example, in the study of innovative performance among R&D units, only two of the ten generic work-climate dimensions examined, performance-reward dependency and flexibility, were consistently correlated with measures of R&D innovation (Abbey & Dickinson, 1983; cited in: Scott & Bruce, 1994).
Amabile et al. (1996) describe studies indicating that internal strife, conservatism and rigid, formal management structures represent obstacles to creativity. The authors sug- gest that because these factors may be perceived as control- ling, their likely negative influence on creativity may evolve from an increase in individual extrinsic motivation (a moti- vation through external factors but not the task itself) and a corresponding decrease in the intrinsic motivation neces- sary for creativity. In a study comparing the work environ- ments (climate) of highly creative R&D projects against less creative projects, Amabile et al. (1996) found support for their model and found that high-creativity projects were overall higher on work environment stimulants and lower on obstacles than low-creativity projects.
Amabile et al. (1996) stated that the stimulants (i.e., orga- nizational and supervisory encouragement, work group sup- port) incorporate facets of a climate of positive affect. Thus, it is suggested that a climate of positive affectivity within an organization may provide a secure base from which teams can generate both creative ideas and ensure their implementa- tion. Senior managers should focus on managing the climate or culture of the organization in order to increase employees’
experience of positive challenge; organizational encourage- ment for innovation; support and openness; and to decrease their perceptions of chronic organizational hostility, conser- vatism, and rigid formal structures. Finally, increasing posi- tive affect by determining and increasing the factors that pro- mote employee satisfaction may well lead to higher levels of
team innovation (West et al., 2004). A number of theorists have suggested that climate may channel and direct both at- tention and activities toward innovation (Amabile, 2000;
Kanter, 1988). Others have noted that innovative organiza- tions are characterized by an orientation toward creativity and innovative change, support for their members in func- tioning independently in the pursuit of new ideas (Siegel &
Kaemmerer, 1978), and a tolerance for diversity among their members (Siegel & Kaemmerer, 1978). Additionally, ad- equate supplies of such resources as equipment, facilities, and time are critical to innovation (Amabile, 2000; Angle, 2000), and the supply of such resources is another manifestation of the organizational support for innovation.
In this study, employees’ perception of organizational climate for innovation is selected as independent variable and more specificly, as it is oftenly cited in the creativity and innovation literature, is concerned with the two di- mensions of the climate for innovation. These dimensions are support for innovation (Kanter, 1988; Siegel & Kaem- merer, 1978) and resource supply (Amabile, 1988).
Siegel and Kaemmerer (1978) noted that support for in- novation is characterized by an orientation toward creativity and innovative change, support for their members in func- tioning independently in the pursuit of new ideas and a tol- erance for diversity among their members. Individuals who perceive that the organization expects, sponsors, and sup- ports innovation respond with innovative behavior for both intrinsic reasons like self-satisfaction and because outcome expectancies are increased (Scott & Bruce,1994). Addition- ally, adequate supplies of such resources as equipment, fa- cilities, and time are critical to innovation (Amabile, 2000;
Angle, 2000) and the supply of such resources is another manifestation of the organizational support for innovation.
The relationship between organizational climate for innovation and innovative work behavior
Managers who understand how to positively impact the climate of innovation and work behavior supportive of in- novativeness will create the most opportunities for innova- tion in their organizations which, in turn, may enhance the performance of organizations (Shanker et al., 2017). İşcan and Karabey (2007) state that human capital plays a major role to succeed and it is so important to establish a work- force in the organization that generates and implements continuously new ideas and it is essential to build a strong organizational climate that supports innovation in order to have this workforce in today’s rapidly changing business environment. Innovation can only be nurtured and grow in a climate that encourages the new ideas. Such a climate will work as a tool for focusing employees’ attentions on innovation and developing a collective mentality that sup- ports innovation (İşcan & Karabey, 2007).
A number of theorists have suggested that climate may channel and direct both attention and activities toward in- novation (Amabile, 1988; Kanter, 1988). Sarros, Cooper and Santora (2008), mentioned that climate for organiza- tional innovation is a useful proxy when it is difficult to get direct behavioral measures of innovation across diverse organizations and industry sectors. Yeoh and Mahmood
(2013) and Imran et al. (2010) also found a significant posi- tive relationship between innovative organizational cli- mate and innovative work behavior.
Mumford and Gustafson (1988) have argued that or- ganizational innovation also depends on whether the or- ganization has a climate that supports innovation. Even when individuals have developed the capacity for innova- tion, their willingness to undertake productive efforts may be conditioned by beliefs concerning the consequences of such actions in a given environment. When an organiza- tion’s culture emphasizes reliable and efficient operations without making any mistakes or is not highly concerned with innovation, employees will be discouraged from tak- ing initiative in their work even if they are given autonomy.
In part, this is due to employees fearing potentially nega- tive consequences associated with risky decisions. How- ever, when an organizational culture values initiative and innovative approaches, employees are more likely to take calculated risks, accept challenging assignments and de- rive intrinsic enjoyment from their work (Yukl, 2009).
Scott and Bruce (1994) defined climate as individual cognitive representations of the organizational setting expressed in terms that reflect psychologically meaning- ful interpretations of the situation. Individuals whom perceived the organization’s expectations and supports for innovation, respond to such expectations with innova- tive behaviors because of either intrinsic reasons such as self-satisfaction or their increasing beneficial expectations (Scott & Bruce, 1994). Thus, it is assumed that there is a positive and direct relationship between the psychological climate for innovation and individual innovativeness.
Scott and Bruce (1994) predicted that the degree to which organization members perceived an organizational climate as supportive of innovation would affect individual innovative behavior, hence given climate's conceptualization as a deter- minant of individual behavior and the previous empirical sup- port for climate's effect on organizational and departmental innovation. Interviews indicated that support could motivate employees in both phases of the innovation process. How sup- port motives idea generation as the first stage of innovation is explained as follows; Experiencing support was believed to be helpful in creating and generating ideas. An innovative re- spondent stated that: “People know that I just love new ideas.
That’s why they come up with suggestions every day. I am al- ways excited by them” (De Jong & Hartog, 2007, p. 53). How support motives idea implementation as the second stage of innovation is explained as follows; the way in which leaders dealt with mistakes seemed to be a key driver in the imple- mentation stage. Most respondents from our group of front- runners, but also some in the non-innovative subset, indicated that mistakes should not be used to punish subordinates but instead should be considered a learning opportunity. For ex- ample: “You can really discourage innovative behavior by be- ing unreliable. When you do not support your subordinates when problems arise, you can forget successful innovation”
(De Jong & Hartog, 2007, p. 53).
As soon as the decision to implement a promising idea is made, providing the necessary time and money seems to be essential. Some relevant quotes of interviewees include:
“Being enthusiastic about an idea is one thing, but your em- ployees will not believe you if you do not come up with the re- sources to develop it” and “We have plenty of ideas, but at the moment we do not innovate at all. We have had a vacancy for over six months now, and we need all our time to keep up with our current activities” (De Jong & Hartog, 2007, p. 55). Em- pirical support for a positive connection between providing resources and application behavior is widely available. Ekvall and Ryhammer (1999) examined a variety of organizational variables that might influence innovation among scholars working at a Swedish university, and found that the availabil- ity of resources was most strongly related to their innovative results. Drawing upon interviews with R&D managers and employees. Nijhof et al. (2002) recommended exempting em- ployees from their ordinary tasks in order to concentrate all their efforts on the development and implementation of their ideas. When employees were assigned to work on innova- tions only part-time they experienced working on a project as something additional to their daily activities, and this of- ten resulted in longer development times, as their daily work remained the number one priority (cited in: De Jong & Har- tog, 2007). Thus, it is assumed that providing adequate time resource is also one of the important elements of climate for innovation in order to proceed effective innovative behavior in the organization. In the light of the statements made above, the hypothesis of this study is suggested as follows;
H1: Organizational climate for innovation has posi- tive effect on innovative work behaviors of employees Method
Sample
The sample (N=270) consists of employees working in the companies in ICT sector in Turkey. As it is seen in Table 1, 87 of the participants are female and 183 are male. The age of all participants ranging from 23 to 61 and the average age 34.4 (Std. Deviation 0.46) respectively. 47.8 % of the participants (129 persons) are in age group 31-40, 34,4% (93 persons) in age group 23-30, 17,8% (48 persons) in age group 41-61. 66% of the participants (178 persons) are engineers and technicians, 10%
(27 persons) are financiers and business administrators. 44% of the participants (120 persons) are working at non R&D depart- ments and 14% (37 persons) are working at R&D departments.
According to the definition, qualification and classifica- tion of small and medium enterprises in the related regulation published in the official newspaper dated November 18, 2005 and issue no: 25997, companies employing less than 10 peo- ple are classified as “micro” enterprises, employing less than 50 people are “small” enterprises, employing less than 250 people are “medium” enterprises (Turkish Official Newspa- per Issue no: 25997, dated Nov. 18, 2005). Accordingly, 61,5%
of the participants (166 persons) are working at “large” enter- prises where equal or more than 250 people are employed, 20,7% (56 persons) are working at medium, 12,2% (33 per- sons) are working at small and 5,6% (15 persons) are working at micro enterprises. In summary, 38,5% of the participants (104 persons) are working at the companies classified as SME
“Small and Medium Enterprises” (Turkish Official Newspa- per Issue no: 25997, dated Nov. 18, 2005).
97,8% of the participants have the university or higher degree. 23% of the participants have female and 77% have male managers. 54,1% of these manager are in age group 36-45 and 97,4% of them have university or higher degree.
57,4% of the participants (155 persons) have 0-3 years seniority, 31,4% (85 persons) have 4-10 years seniority, 11,2% (30 persons) have 11-35 years seniority at their exist- ing companies and 42,2% of the participants (114 persons) have been working with their existing managers for 0-1 years, 45,6% (123 persons) for 2-5 years, 12,2% (33 per- sons) for 6-35 years (Table 1).
Table 1 Demographic data
N %
Gender
Female 87 32,2
Male 183 67,8
Age
23-30 93 34,4
31-40 129 47,8
41-61 48 17,8
Profession
Engineer-Technician 178 66
Business Adm.-Financier 27 10
Other 65 24
Department
R&D 37 14
Technical (Non R&D) 120 44
Other 113 42
Number of employees in the co.
0-9 15 5,6
10-49 33 12,2
50-249 56 20,7
>250 166 61,5
Education
High School 6 2,2
University 131 48,5
Master Degree 120 44,4
Doctorate 13 4,9
Gender of the manager
Female 62 23
Male 208 77
Age of the manager
27-35 64 23,7
36-45 146 54,1
46-63 60 22,2
Seniority at the existing co.(year)
0-3 155 57,4
4-10 85 31,4
11-35 30 11,2
Education of the manager
Primary School 2 0,7
High School 5 1,9
University 168 62,2
Master Degree 78 28,9
Doctorate 17 6,3
Seniority with existing manager (Year)
0-1 114 42,2
2-5 123 45,6
6-35 33 12,2
Total N : 270
Procedure
Employees attended to the survey through questionnaire link sent them by e-mail. This method is not considered as a major disadvantage compared to hand-distributed survey because of the employees’ competence and ability of using technology and computer in ICT sector. The questionnaires are sent to 1210 employees in total. 397 of the questionnaires are responded and the ones which their reliability is sup- posed to be low (e.g. all the questions are filled with the same constantly repeating score) or so many questions left blank are excluded from the survey. As a result of this elimination, 270 questionnaires used in the analysis of survey data.
Bartlett, Kotrlik and Higgins’ (2001) method derived from Cochran’s (1977) formula is used for determining whether 270 samples is sufficient or not as adequate sam- ple size for this study. First of all, total employee num- ber in ICT sector in Turkey as the population should be determined for the calculation of adequate sample size representing the population. Lastly, sector’s employment data for 2013 has been published in Turkish Statistical In- stitution’s “TUIK” bulletin dated April 27, 2015 and is- sue no: 21501. According to this bulletin, totally 187.019 persons were employed as of 2013 year-end in ICT sec- tor in Turkey. Sample collection process for this study has been realized in the middle of 2014. Thus, considering the yearly growth rate of service sectors in Turkey was around 5-10%, we might estimate that the total employment num- ber in ICT sector in Turkey was less than 200.000 persons in the middle of 2014 when the sample collection was per- formed for this study (TURKSTAT “TUIK”, 2015).
Cochran’s (1977) formula uses two key factors: (1) the error the researcher is willing to accept in the study, com- monly called the “Margin of Error”, (2) the “Alpha Level”, the level of acceptable risk the researcher is willing to accept that the true margin of error exceeds the accept- able margin of error also known as Type I error (Bartlett, Kotrlik & Higgins, 2001).
Alpha level is considered as 0,05 in many surveys. It is considered as 0,05 in this survey as well. Accordingly, if the sample size is >120 (it is 270 in our study) and alpha level is 0,05 then, t value will be 1,96 (Ary, Jacobs & Raza- vieh, 1996; cited in: Bartlett, Kotrlik & Higgins, 2001).
The general rule relative to acceptable margins of error in social research is as follows: For categorical data, 5% mar- gin of error is acceptable and for continuous data, 3% mar- gin of error is acceptable (Krejcie & Morgan, 1970; cited in:
Bartlett, Kotrlik & Higgins, 2001). Acceptable margin of er- ror is considered as 3% since continuous data is used in this survey. Accordingly, acceptable margin of error for mean (d) is calculated by multiplying acceptable margin of error and number of points on primary scale. d= ,03 x 5 = 0,15.
The Formula below is used for the calculation of es- timation of standard deviation (S) as it is defined in Co- chran’s (1977) Formula;
Number of points on primary scale S = --- Number of Standard Deviation (Points at the two sides of the mean of the scale)
According to above Formula, variance estimation in this study is calculated as below. Number of points in the scale is 5 since 5 point equal interval scale is used in this study and there are 2 points at each sides of the mean point of this scale which is 4 in total. Accordingly variance esti- mation is S=5/4= 1,25.
When we placed all the values in the Cochran’s (1977) sample size Formula for the continuous data, we found the sufficient sample size amount as 267 necessary for this study below.
(t)2 * (s)2 (1.96)2*(1.25)2 no= --- = --- = 267 (d)2 (5*.03)2
The correction Formula suggested by Cochran (1977) is used in the situations where sample size higher than 5%
of the population. However, it is not necessary to apply the correction Formula for this study since the sample size we found 267 above is not higher than the 5% of the population which we already estimated the population as not higher than 200.000 (5% of the population is approx. 10.000). As a result, it is decided to continue with the sample number (n=270) already collected and finally found sufficient for this study.
Instruments
It is utilized from the instruments already existed in the literature in order to measure the variables in this study. The instruments are translated from their original language English into Turkish by the researcher. Turkish translations of the instruments are reviewed by the con- sultant academicians working at Marmara University, Business Administration Department, Organizational Behavior Section considering the appropriateness of the meanings of each item and necessary changes have been made. Afterwards, Turkish instruments have been applied as a pilot study on 50 people working at different positions in various sectors in Turkey in order to test the operability of each item in the instruments. The data, criticism and feedback obtained from the results of this pilot study were reassessed by the researcher and academicians and instru- ments were finalized with the latest revisions. Detailed in- formation regarding the instruments is below.
Innovative Work Behavior Scale
Innovative work behavior (IWB) scale developed by Janssen (2000, 2001) was used for measuring employees’
innovative work behavior in the organization. Participants self-rated their innovative behavior at work with the IWB scale consisted of 9 items. Janssen (2000, 2001) described IWB scale with three dimensions by utilizing Kanter’s (1988) work on the stages of innovation. First three items refer to “idea generation”, the next three items refer to
“idea promotion” and the last three items refer to “idea re- alization” dimensions. Equal interval scale consisting of 5 choices is used for rating (1-Never, 2-Rarely, 3-Sometimes, 4-Often, 5-Always). Original English scale’s Cronbach Al- pha is 0,97.
The IWB scale can either be rated by the respondents (self-reports) or their supervisors (leader-reports) (Jans- sen, 2000). In this study, self-reporting is chosen besides observer-scores for three reasons; First, a worker’s cogni- tive representation and reports of his or her own IWB may be more subtle than those of his or her supervisor, since a worker has much more information about the historical, contextual, intentional and other backgrounds of his or her own work activities (Jones & Nisbet, 1971, cited in: Scott &
Bruce, 1994). Second, the assessment of IWB as discretion- ary work behavior is much like many forms of subjective performance appraisal, highly susceptible to idiosyncratic interpretations and thus likely to vary across different raters (Organ & Konovsky, 1989, cited in: Scott & Bruce, 1994).
Finally, the supervisor measure may miss much genuine employee innovative activities, and may capture only those gestures intended to impress the supervisor (Organ & Ko- novsky, 1989, cited in: Scott & Bruce, 1994).
Organizational Climate for Innovation Scale
Organizational climate for innovation scale was origi- nally developed by Siegel and Kaemmerer (1978) and later modified by Scott and Bruce (1994) for wider usage. Orga- nizational climate for innovation scale composed of 22 item measures respondents’ perception of innovative climate in the organization in the context of support for innovation and change, tolerance of differences and resource supply for in- novation. 11 items in the scale are reverse coded. Organi- zational climate for innovation scale that was first used by Scott and Bruce (1994) contains originally two dimensions:
support for innovation and resource supply for innovation.
All items were rated on a 5 point scale ranging from 1 (defi- nitely disagree), 2 (quite disagree), 3 (somewhat agree), 4 (quite agree) to 5 (definitely agree). First dimension support for innovation’s Cronbach Alpha is 0,92 and second dimen- sion resource supply for innovation’s Cronbach Alpha is 0,77 of the original English scale (Scott & Bruce, 1994).
Statistical Data Analysis
In the factor analyses which determine the factor struc- ture of the variables, Kaiser-Meyer-Olkin (KMO) measure of sampling adequacy test and Bartlett’s Test of Sphericity was firstly used to see whether data for the variables were convenient for conducting factor analysis or not. Then, factor analyses were conducted with principal component analysis (PCA) and varimax rotation for the factor structure.
Cronbach’s Alpha analysis used for computing the reliabil- ity level of the factors. Pearson correlation analysis used for the determination of the significance, strength and direction of the relationships between variables and then simple linear and hierarchical regression analyses are conducted to test the hypotheses. T-test and ANOVA tests are used to test the group differences with regard to research variables.
Findings
Factor analysis performed for the organizational climate for innovation variable with data collected through 22 items organizational climate for innovation instrument. As a re- sult, items “Around here, people are allowed to try to solve
the same problems in different ways.”,” The main function of members in this organization is to follow orders which come down through channels.”,” In this organization, we tend to stick to tried and true ways.”, “This place seems to be more concerned with the status quo than with change.”,
“The reward system here benefits mainly those who don't rock the boat.” that belong to support for innovation dimen- sion were excluded from the analysis because of their fac- tor loadings were distributed on several factors and their reliability (Cronbach’s Alpha) coefficients were found to be low. When the factor analysis performed with the remain- ing items again, it was found that organizational climate for innovation variable was grouped under three factors and total variance explained ratio was 66,5%. When the items which were grouped under these three factors examined, it was found that the items of support for innovation dimen- sion of Scott and Bruce’s (1994) instrument were divided into two tailed perceptions of the participants as positive and negative climate for innovation and resource supply for innovation items emerged as a separate dimension similar to original instrument. However, according to the factor anal- ysis result, the following items originally forming the re- source supply for innovation dimension “There is adequate time available to pursue creative ideas here”, “Assistance in developing new ideas is readily available”, “There are adequate resources devoted to innovation in this organi- zation”, “This organization gives me free time to pursue creative ideas during the workday”, shifted to support for innovation dimension. As a result, three factors were named as positive innovative climate, negative innovative climate and resource supply for innovation. As a result of reliability analyses, Cronbach’s Alpha for positive innovative climate is 0,938, for negative innovative climate is 0,846 and re- source supply for innovation is 0,688.
Factor analysis performed for the innovative work be- havior variable with data collected through 9 items innova- tive work behavior instrument. As a result, item “Mobilizing support for innovative ideas.” that belongs to idea promotion dimension was excluded from the analysis because of its fac- tor loadings were distributed on several factors and its reli- ability (Cronbach’s Alpha) coefficient was found to be low.
When the factor analysis performed with the remaining items again, it was found that innovative work behavior variable was grouped under two factors and total variance explained ratio was 64%. When the items which were grouped under these two factors examined, it was found that the items of idea generation were formed the same as Janssen’s (2000, 2001) instrument. However, idea promotion and idea realization dimensions emerged as one dimension. As a result, the first factor was named as idea generation as its items were kept the same and the second factor was named as idea realization be- cause its items were more associated with the application and implementation of any kind of innovation in any organiza- tion. As a result of reliability analyses, Cronbach’s Alpha for idea generation is 0,750, for idea realization is 0,814.
Correlation analyses were performed to determine the relationships between the variables and factors of this study.
As it is seen in Table 2, significant, positive and moderate (r=0,428) correlation between organizational climate for innovation and innovative work behavior is found. As it is also seen in Table 2, correlation analyses were performed at factor level in order to understand in details the correlation between the main variables of this study.
It is found either the significant, positive and very low intense (r=0,152) correlation between positive innovative climate and idea generation or significant, positive and moderate (r=0,565) correlation between positive innova- tive climate and idea realization. Negative innovative cli- mate is found to be significantly and negatively correlated (r= -0,320) with only idea realization.
Resource supply for innovation is found to be signifi- cantly and negatively correlated (r= -0,196) with only idea realization. As noted, the direction of the correlation be- tween resource supply for innovation and innovative work behavior is negative. Items forming the resource supply for innovation dimension have negative contents and empha- size the lack of resources so that this finding is not sur- prising and indicates that innovative work behavior will be reducing as the resources are getting inadequate.
In order to test the hypothesis of this study (H1: Or- ganizational climate for innovation has positive effect on innovative work behaviors of employees), we performed Table 2 Correlation Analysis Among Research Variables
the simple linear regression analysis first for organizational climate for innovation and innovative work behavior vari- ables (Table 3) and then for their sub dimensions which sig-
nificant correlation exists among them (Table 4 and 5) to test organizational climate for innovation’s contribution on innovative work behavior.
Table 3 Regression Analysis among Organizational Climate for Innovation and IWB
As it is seen in Table 3, the simple linear regression model established between organizational climate for innovation and innovative work behavior is sig- nificant (F=59,967; p<0,001) and 18,3% (R2=0,183)
of employees’ innovative work behavior is explained with their perception of organizational climate for in- novation. This result supports the first hypothesis of this study.
Table 4 Regression Analysis among Positive Innovative Climate and Innovative Idea Generation
As it is seen in Table 4, the simple linear regression model established between idea generation and positive innovative cli- mate which significant correlation found among them. This mod-
el is found significant (F=6,312; p<0,05) and 2,3% (R2=0,023) of employees’ innovative idea generation is explained with their perception of positive innovative climate in their organization.
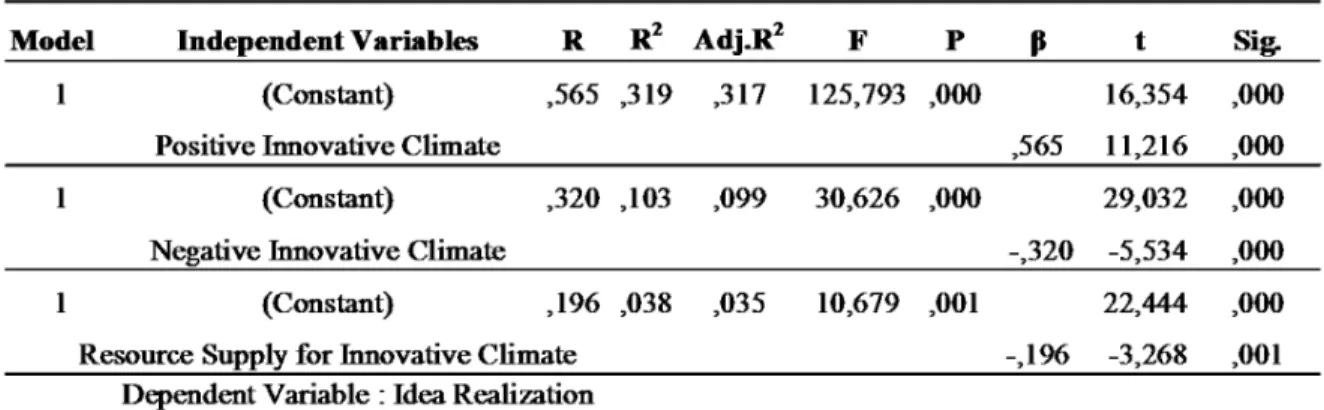
Table 5 Regression Analysis among Positive/Negative Innovative Climate and Resource Supply for Innovative Climate and Innovative Idea Realization
As it is seen in Table 5, the simple linear regression model established between idea realization and positive in- novative climate which significant correlation found among them. This model is found significant (F=125,793; p<0,001) and 31,9% (R2=0,319) of employees’ innovative idea real- ization is explained with their perception of positive innova- tive climate in their organization. As it is seen in Table 5 as well, the simple linear regression model established between idea realization and negative innovative climate which sig- nificant correlation found among them. This model is found significant (F=30,626; p<0,001) and 10,3% (R2=0,103) of
employees’ innovative idea realization is explained with their perception of negative innovative climate in their orga- nization. The regression model between resource supply for innovation and idea realization is also significant (F=10,679;
p<0,001) and 3,8% (R2=0,038) of employees’ innovative idea realization is explained with their perception of re- source supply for innovation in their organization. In these models, beta and t values are negative. It is also found in the correlation analyses that there is a negative correlation between innovative idea realization and negative innovative climate and resource supply for innovation.
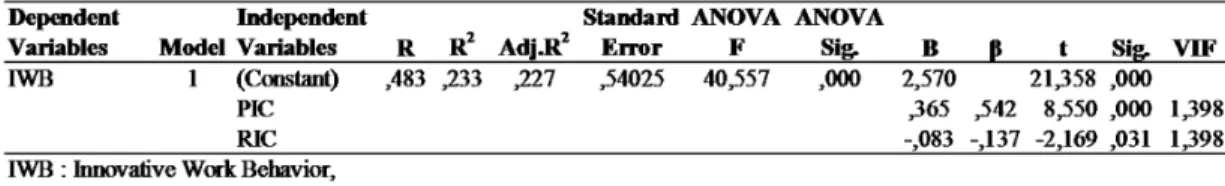
Multiple regression analyses were performed for the sub dimensions of organizational climate for innovation and in- novative work behavior and its sub dimensions as well. When the effects of three sub dimensions of organizational climate for innovation on innovative work behavior was tested, sig-
nificant effects of positive innovative climate (β = 0,542; p <
0,001) and resource supply for innovation (β = -0,137; p < 0,05) on IWB was found (Table 6). However, the effect of positive innovative climate on IWB is stronger. The effect of negative innovative climate on IWB is not significant in this analysis.
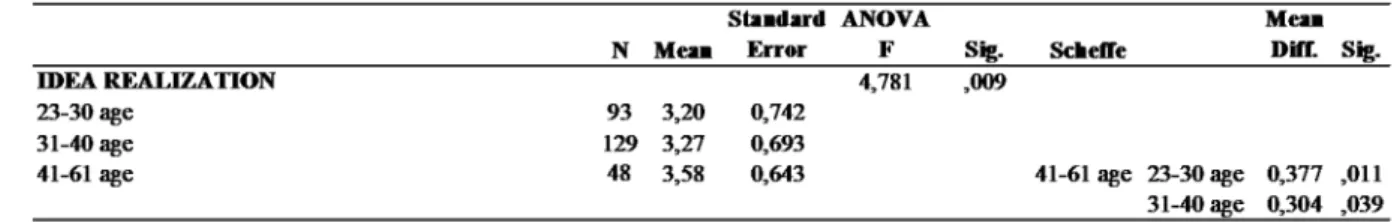
As it is seen in Table 9, innovative idea realization be-
haviors of employees whom are within age group 41-61 is significantly higher than those of employees whom are within age group 23-40.
Table 6 Multiple Regression Analysis among Organizational Climate for Innovation Dimensions and IWB
When the effects of three sub dimensions of organiza- tional climate for innovation on idea generation was test- ed, only significant effect of positive innovative climate on idea generation was found. Therefore, we may state that innovative idea generation can only be explained with positive innovative climate. The results of the simple lin- ear regression can be examined above (See Table 4).
When the effects of three sub dimensions of organi- zational climate for innovation on idea realization was tested, significant effects of positive innovative climate (β
= 0,644; p < 0,001) and resource supply for innovation (β
= -0,148; p < 0,05) on idea realization was found. The sig- nificant effect of negative innovative climate on innovative idea realization which is found in the result of simple linear regression analysis lost its significance when it is analyzed with all three sub dimensions of organizational climate for innovation in a multiple regression model (See Table 7).
According to the results of the analyses above, we ac- cept the hypothesis “H1: Organizational climate for in- novation has positive effect on innovative work behaviors
of employees” of this study. We may particularly state that positive innovative climate has remarkable effect on IWB.
When we examine this relationship at factor level, we find that positive innovative climate has remarkable effect par- ticularly on innovative idea realization.
Demographic groups, shown in Table 1, were compared to examine the differences among them with regard to the organi- zational climate for innovation, IWB and their sub dimensions.
As a result, significant difference has been found in employees’ positive innovative climate perceptions and in- novative idea realization behaviors between the companies employing less than 250 people and companies employing equal or more than 250 people. Additionally, significant dif- ference has been found in employees’ innovative idea real- ization behaviors among the participants’ age groups.
As it is seen in Table 8, positive innovative climate percep- tions and innovative idea realization behaviors of employees working in the companies which employ less than 250 people is significantly higher than those of employees working in the companies which employ equal or more than 250 people.
Table 7 Multiple Regression Analysis among Organizational Climate for Innovation Dimensions and Innovative Idea Realization
Table 8 T-test for the Research Variables
Discussion
In this study, it is found significant relationship be- tween participants’ perceptions of organizational climate for innovation and their innovative work behavior. Ac- cording to the survey results, employees’ perception of or- ganizational climate for innovation has stronger effect on their innovative idea realization behavior rather than their idea generation behavior. Amabile (1996) defined cre- ativity as the production of novel and useful ideas in any domain and stated that individual innovation begins with idea generation. Based on the definition, we may state that innovative idea generation is more related to creativity and emerging as a result of individual characteristics. King et al. (2007) also found that that organizational climate for innovation is positively associated with organization per- formance and productivity. On the other hand, main focus of the companies in ICT sector in Turkey could be decent operation rather than new idea generation. This could be the reason that employees’ perception of organizational climate for innovation has stronger effect on their idea realization behavior rather than their idea generation be- havior.
Particularly, employees exhibit innovative idea realiza- tion behavior when positive innovative climate is facilitat- ed in their workplace. In such workplaces where positive climate is facilitated, innovative idea generation behavior can also be observed to a lesser extent as well. If negative innovative climate is in place, it does not affect employees’
innovative idea generation, however it has negative effect on their innovative idea realization behavior. In the work- places where adequate resources are supplied for innova- tion, only employees’ innovative idea realization behavior is positively affected in a low amount. In the correlation analyses, it is found out significant, negative and low in- tense (r= - 0,196) correlation between resource supply for innovation and idea realization. Therefore, this result can be interpreted as innovative idea realization increases as the inadequacy of resources reduces.
Scott and Bruce (1994) and Yuan and Woodman (2010) predicted that the degree to which organization members perceived an organizational climate as supportive of inno- vation would affect individual innovative behavior, hence given climate's conceptualization as a determinant of in- dividual behavior and the previous empirical support for climate's effect on organizational and departmental inno- vation. Interviews in Scott and Bruce’s (1994) study indi- cated that support could motivate employees in both phas- es of the innovation process. Experiencing support was believed to be helpful in creating and generating ideas. In this context, our findings in this study do not strongly sup- port Scott and Bruce’s (1994) findings above.
In demographic analyses, it is found that positive in- novative climate perceptions and innovative idea realiza- tion behaviors of employees working in the companies so called as SME (Small and Medium Enterprises) which employ less than 250 people is significantly higher than those of employees working in the companies which em- ploy equal or more than 250 people. Based on my expe- rience and observations, I think that bigger companies might face with more competition and more uncertainty because of continuous changes rather than smaller compa- nies in ICT sector. Additionally, SMEs are more operation oriented companies compared to the bigger ones that as- sumed to be more creative. Therefore, I think that positive innovative climate perception and innovative idea realiza- tion behavior might be seen more often in smaller compa- nies where the competition, change and uncertainty facts are felt relatively rare and the decisions and initiatives can be taken faster and easier. In demographic analyses again, it is found that innovative idea realization behaviors of employees whom are within age group 41-61 is signifi- cantly higher than those of employees whom are within age group 23-40. I think the participants in age group 41- 61 can take more initiative because they are more expe- rienced than those in younger age group and thus exhibit more innovative idea realization behavior, at least they are more conscious to exhibit such behavior.
As a result in this study, it is found out that building a positive innovative climate in the workplace has sig- nificant effect on employees’ innovative work behavior exhibition. It is also observed that a negative climate has unfavorable and bad effects on IWB. Companies’ resource supply for innovation has also positive effect on employ- ees’ innovative work behavior.
It is crucial for the companies to encourage and rec- ognize their employees’ creative ideas and innovative be- haviors, to provide them adequate time for creative and innovative activities, reward their exhibition of such be- havior and additionally to provide a flexible and “open to change” working environment in order to build a positive innovative climate in the workplace. It is suggested the companies operating in the ICT sector in Turkey to build such a positive climate as mentioned above in their orga- nization in order to be more competitive, to better manage the change and to make more innovation to satisfy their customers more.
In this study, it is also found that organizational cli- mate for innovation has effects on mainly employees’ in- novative idea realization behavior however lesser effects on employees’ idea generation behavior. Innovative idea generation is one of the dimensions of IWB, however also the first stage of IWB at the same time. Amabile et al.
Table 9 ANOVA for the Research Variables
(1996) and Kanter (1988) stated that innovation begins with idea generation, that is the production of novel and useful ideas in any domain. Therefore, for the future stud- ies, it is suggested that researchers had better emphasize on the factors effecting particularly idea generation behav- ior more in order to better explain which other factors have significant effects on IWB. At the same time, I think the investigation of other factors such as leadership styles etc.
that supposed to have effects on IWB and the employees’
innovative work behavior from other sectors in Turkey or other countries will contribute to competitiveness yet it is not as much as desired but in an increasing trend today.
References
Abbey, A., & Dickinson, J. (1983). R&D work climate and innovation in semiconductors. Academy of Management Journal, 26, 362-368. https://doi.org/10.5465/255984 Amabile, T.M. (1988). A model of creativity and innovati-
on in organizations. In B. M. Staw & L. L. Cummings (Eds.), Research in organizational behavior, vol. 10 (pp.123-167). Greenwich, CT: JAI Press.
Amabile, T.M. (1996). Creativity and innovation in orga- nizations. Boston: Harvard Business School Press.
Amabile, T.M., Conti, R., Coon, H., Lazenby, J., & Herron, M. (1996). Assessing the work environment for creati- vity. Academy of Management Journal, 39, 1154–1184.
https://doi.org/10.5465/256995
Amabile, T. M. (2000). A model of creativity and innova- tion in organizations. In B. Staw & R. Sutton (Eds.).
Research in Organizational Behavior. Vol. 22. Ams- terdam: Elsevier Science.
Amabile, T. M. & Rigolizzo, M. (2015). Entrepreneurial creativity: The role of learning processes and work environment supports. In The Oxford Handbook of Creativity, Innovation, and Entrepreneurship. Ch.4:61, Oxford Library of Psychology.
Amabile, T. M., & Pratt, M. G. (2016). The dynamic com- ponential model of creativity and innovation in organi- zations: Making progress, making meaning. Research in Organizational Behavior, 36, 157-183. http://dx.doi.
org/10.1016/j.riob.2016.10.001
Angle, H. (2000). Psychology and organizational innovation.
In A. Van de Ven, H. Angle, & M. Poole (Eds.), Research on the management of innovation: The Minnesota studies (pp. 135-170). Oxford: Oxford University Press.
Baer, M. (2012). Putting creativity to work: the imple- mentation of creative ideas in organizations. Academy of Management Journal, 55(5), 1102-1119. https://doi.
org/10.5465/amj.2009.0470
Bartlett, E.J., Kotrlik, J.W. & Higgins, C.C. (2001). Orga- nizational research: Determining appropriate samp- le size in survey research. Information Technology, Learning and Performance Journal, 19(1). https://doi.
org/10.1.1.486.8295
Campbell, J.P., Gasser M.B. & Oswald F.L. (1996). The substantive nature of job performance variability, In Murphy, K.R. (1996), Individual difference and beha- viours in organizations (pp. 258-299). San Francisco:
Jossey Bass.
Cochran, W.G. (1977). Sampling techniques (3rd ed.). New York: John Wiley & Sons.
Cooper, R.G. (2003). Profitable product innovation: the critical success factors. In Shavinina, L.V. (Ed.), The International Handbook on Innovation (pp. 139-157).
London: Elsevier Science, Barking.
De Jong, J.P.J. (2007). Individual innovation: The con- nection between leadership and employees’ innova- tive work behavior. Amsterdam: University of Ams- terdam.
De Jong, J.P.J. & Den Hartog, D.N. (2007). How leaders influence employees’ innovative behaviour. European Journal of Innovation Management, 10(1), 41-64.
https://doi.org/10.1108/14601060710720546
De Jong, J.P.J. & Den Hartog, D.N. (2010). Measuring innovati- ve work behaviour. Creativity and Innovation Management, 19(1), 23-36. https://doi.org/10.1111/j.1467-8691.2010.00547.x Drucker, P.F. (1998). Sonuç İçin Yönetim (Çev. Bülent Tok-
söz). İstanbul: İnkılâp Kitabevi.
Drucker, P.F. (2014). Innovation and entrepreneurship. Lon- don: Routledge. https://doi.org/10.4324/9781315747453 Ekvall, G. & Ryhammer, L. (1999). The creative clima-
te: Its determinants and effects at a Swedish Uni- versity. Creativity Research Journal, 12. https://doi.
org/10.1207/s15326934crj1204_8
Imran, R., Saeed, T., Anis-Ul-Haq, M., & Fatima, A.
(2010). Organizational climate as a predictor of inno- vative work behavior. African Journal of Business Ma- nagement, 4(15), 3337-3343. ISSN 1993-8233
Imran, R., & Anis-ul-Haque, M. (2011). Mediating effect of organizational climate between transformational leadership and innovative work behaviour. Pakistan Journal of Psychological Research, 26(2), 183.
İşcan, Ö.F. & Karabey, C.N. (2007). Örgüt iklimi ile yeniliğe destek algısı arasındaki ilişki. Gaziantep Üni- versitesi Sosyal Bilimler Dergisi,6(2),180-193.
Janssen, O. (2000), Job demands, perceptions of effort-re- ward fairness, and innovative work behavior, Journal of Occupational and organizational psychology, 73, 287-302. https://doi.org/10.1348/096317900167038 Janssen, O. (2001). Fairness perceptions as a moderator in the
curvilinear relationships between job demands, and job performance and job satisfaction. Academy of Management Journal, 44, 1039-1050. https://doi.org/10.5465/3069447 Janssen, O. (2003). Innovative behaviour and job invol-
vement at the price of conflict and less satisfaction with co-workers. Journal of Occupational and Or- ganizational Psychology, 76(3), 347-364. https://doi.
org/10.1348/096317903769647210
Janssen, O. (2005). The joint impact of perceived influ- ence and supervisor supportiveness on employee in- novative behavior. Journal of Occupational and Or- ganizational Psychology, 78(4), 573-580. https://doi.
org/10.1348/096317905X25823
Jung, D.I., Chow, C., & Wu, A. (2003). The role of trans- formational leadership in enhancing organizational innovation: hypotheses and some preliminary find- ings. Leadership Quarterly, 14, 525–544. https://doi.
org/10.1016/S1048-9843(03)00050-X
Kanter, R. (1988). When a thousand flowers bloom: Struc- tural, collective, and social conditions for innovation in organizations. In B. M. Staw & L. L. Cummings (Eds.), Research in organizational behavior, vol 10 (pp.169- 211). Greenwich, CT: JAI Press.
King N. & N. Anderson (2002). Managing innovation and chan- ge: a critical guide for organizations. London: Thomson.
King E.B., Chermont K., West M., Dawson J.F. & Hebl M.R. (2007). How innovation can alleviate negative consequences of demanding work contexts: The influ- ence of climate for innovation on organizational out- comes. Journal of Occupational and Organizational Psychology, 80, 631–645. The British Psychological Society. https://doi.org/10.1348/096317906X171145 Kwasniewska, J. & Necka, E. (2004). Perception of the
climate for creativity in the workplace: the role of the level in the organization and gender. Creativity and Innovation Management, 13(3), 187-196. https://doi.
org/10.1111/j.0963-1690.2004.00308.x
Miron, E., M. Erez & E. Naveh (2004). Do personal cha- racteristics and cultural values that promote innova- tion, quality, and efficiency compete or complement each other? Journal of Organisational Behavior, 25, 175–199. https://doi.org/10.1002/job.237
Mumford, M.D., & Gustafson, S.B. (1988). Creativity syndrome: Integration, application, and innovati- on. Psychological Bulletin, 103, 27–43. http://dx.doi.
org/10.1037/0033-2909.103.1.27
Nijhof, A., Krabbendam, K., Looise, J.K. (2002). Innova- tion through exemptions: Building upon the existing creativity of employees. Faculty of Technology & Ma- nagement University of Twente. https://doi.org/10.1016/
S0166-4972(01)00088-8
Özçer, N. (2005). Yönetimde Yaratıcılık ve Yenilikçilik.
İstanbul: Rota Yayınları, ss. 14-76.
Porter, M.E. (1991). Towards a dynamic theory of strategy.
Strategic Management Journal, 12, 95-117. https://doi.
org/10.1002/smj.4250121008
Sarros, J.C., Cooper, B.K. & Santora, J.C. (2008). Building a climate for innovation through transformational lead- ership and organizational culture. Journal of Leaders- hip and Organizational Studies, 15(2), 145-158. https://
doi.org/10.1177/1548051808324100
Scott, S.G. & R.A. Bruce (1994). Determinants of innova- tive behavior: A path model of individual innovation in the workplace. Academy of Management Journal, 38, 1442-1465. https://doi.org/10.5465/256701
Schneider, B. & Reichers, A. (1983). On the etiology of climates. Personnel Psychology, 36, 19-39. https://doi.
org/10.1111/j.1744-6570.1983.tb00500.x
Schneider, B., Ehrhart M.G., & Macey W.H. (2011).
Perspectives on organizational climate and cultu- re. In Zedeck, S. (Ed.), APA Handbook of Industri- al and Organizational Psychology, Vol. 1. Building and Developing the Organization (pp. 373–414).
Washington, DC: Am. Psychol. Assoc. http://dx.doi.
org/10.1037/12169-012
Schneider, B., Ehrhart, M.G., & Macey, W.H. (2013). Or- ganizational climate and culture. Annual Review of Psychology, 64, 361-388. https://doi.org/10.1146/annu- rev-psych-113011-143809
Shanker, R., Bhanugopan, R., Van der Heijden, B. I., &
Farrell, M. (2017). Organizational climate for innova- tion and organizational performance: The mediating effect of innovative work behavior. Journal of Voca- tional Behavior, 100, 67-77. http://dx.doi.org/10.1016/j.
jvb.2017.02.004
Siegel, S., & Kaemmerer, W. (1978). Measuring the per- ceived support for innovation in organizations. Jour- nal of Applied Psychology, 63, 553-562. http://dx.doi.
org/10.1037/0021-9010.63.5.553
West, M.A. (2002). Sparkling fountains or stagnant ponds:
An integrative model of creativity and innovation implementation in work groups. Applied Psychology:
An International Review, 51(3), 355-424. https://doi.
org/10.1111/1464-0597.00951
West, M.A., Hirst G., Richter A. & Shipton H. (2004).
Twelve steps to heaven: Successfully managing chan- ge through developing innovative teams. European Journal of Work and Organizational Psychology, 13(2), 269-299. https://doi.org/10.1080/13594320444000092 Yeoh K.K. & Mahmood R. (2013). The Relationship bet-
ween Pro-Innovation Organizational Climate, Leader- Member Exchange and Innovative Work Behavior: A Study among the Knowledge Workers of the Knowled- ge Intensive Business Services in Malaysia. Business Management Dynamics, 2(8), 15-30.
Yuan, F. & Woodman, R. W. (2010). Innovative behavior in the workplace: The role of performance and image out- come expectations. Academy of Management Journal, 53(2), 323-342. https://doi.org/10.5465/amj.2010.49388995 Yukl, G. (2009). Leadership in Organizations (7th ed.).
Englewood Cliffs, NJ: Prentice-Hall.
TURKSTAT “TUIK” (2015). Turkish Statistics Associa- tion, 2013 Annual Industry and Service Statistics Sur- vey, News Bulletin. 27th April 2015, No: 21501.
TURKISH official newspaper “RESMİ GAZETE” (2005).
Küçük ve Orta Büyüklükteki İşletmelerin Tanımı, Ni- telikleri ve Sınıflandırılması Hakkında Yönetmelik, Resmi Gazete, 18. Kasım.2005, No:25997.