Műhelytanulmányok Vállalatgazdaságtan Intézet
1093 Budapest, Fővám tér 8.
(+36 1) 482-5566
HONLAP
Hungarian firms’ innovation performance in international comparison
Kazainé dr. Ónodi Annamária
annamaria.kazaineonodi@uni-corvinus.hu)
Üzleti Gazdaságtan Tanszék
179. sz. Műhelytanulmány HU ISSN 1786-3031
2021. június
Budapesti Corvinus Egyetem Vállalatgazdaságtan Intézet
Fővám tér 8.
H-1093 Budapest Hungary
Hungarian firms’ innovation performance in international comparison
Abstract
Innovation is key to Hungary's convergence. We analyzed the database of the latest 2018 Community Innovation Survey. The visualization toolkit help to demonstrate in the study that the innovation performance of Hungarian companies lags significantly behind the EU average. The weakest point is the process innovation. The analysis of the CIS database did not explain the reasons for the poor innovation performance, so this issue needs further investigation. The study could be a starting point for further research.
Keywords:
innovation performance, innovation performance indicator, CIS, Hungary, Visegradian countries
Magyar vállalatok innovációs teljesítménye nemzetközi
összehasonlításban
Absztrakt
Az innováció kulcsfontosságú Magyarország felzárkózása szempontjából. A tanulmány a legutóbbi, 2018-as közösségi innovációs felvétel eredményeinek elemzése segítségével, a vizualizáció eszköztárát
Tartalom
Introduction _______________________________________________________________ 4 Measurement of innovation __________________________________________________ 4 Innovative enterprises _______________________________________________________ 6 Enterprises with research and development (R&D) activities _______________________ 12 European Innovation Scoreboard (EIS) _________________________________________ 13 Innovation barriers according CIS _____________________________________________ 16 Conclusion ________________________________________________________________ 22 References ________________________________________________________________ 23
Ábrajegyzék
Figure 1. Enterprises with innovation activities during 2016 and 2018 in Europe (%) ... 7
Figure 2. Enterprises with innovation activities during 2016 and 2018 by company size in V4 countries (%) ... 8
Figure 3. Product innovative enterprises that have introduced at least one new or significantly improved product in Europe in 2018 (%) ... 9
Figure 4. Product innovative enterprises that have introduced at least one new or significantly improved product in V4 countries by company size in 2018 (%) ... 9
Figure 5. Enterprises that introduced new or improved processes in Europe in 2018 (%) ... 10
Figure 6. Enterprises that introduced new or improved processes by company size in V4 countries ... 11
Figure 7. Enterprises that introduced new or improved processes by type of innovation in V4 countries (%) ... 12
Figure 8. Enterprises with research and development (R&D) activities during 2016 and 2018 (%) ... 13
Figure 9. Enterprises with research and development (R&D) activities during 2016 and 2018 by company size in V4 countries (%) ... 13
Figure 10. Summary Innovation Index relative to EU average in 2012 between 2017-2019 ... 14
Figure 11. Summary Innovation Index in 2019 relative to EU average in 2012 ... 14
Figure 12. SMEs with product or process innovations in 2019 relative to EU average in 2012 ... 15
Figure 13. SMEs with marketing or organisational innovations in 2019 relative to EU average in 2012 ... 15
Figure 14. SMEs innovating in-house in 2019 relative to EU average in 2012 ... 16
Figure 15. Rate of enterprises for which “Lack of internal finance” in not an innovation barrier ... 17
Figure 16. Rate of enterprises for which “Lack of external finance” in not an innovation barrier ... 17
Figure 17. Rate of enterprises for which “High costs” in not an innovation barrier ... 18
Figure 18. Rate of enterprises for which “Lack of qualified employees within enterprise” in not an innovation barrier ... 18
Figure 19. Rate of enterprises for which “Lack of collaboration partners” in not an innovation barrier ... 19
Figure 20. Rate of enterprises for which “Difficulties in obtaining public grants or subsidies” in not an innovation barrier ... 19
Figure 21. Rate of enterprises for which “Uncertain market demand” in not an innovation barrier ... 20
Figure 22. Rate of enterprises for which “High competition” in not an innovation barrier ... 20
Figure 23. Rate of enterprises for which “Lack of access to external knowledge” in not an innovation barrier ... 21
Figure 24. Rate of enterprises for which “Different priorities within the enterprise” in not an innovation barrier ... 21
Introduction
The World Economic Forum in The Global Competitiveness Report 2018 highlighted that innovation, flexibility, and adaptation to change are becoming key factors for growth and competitiveness. (Schwab, 2018) The first edition of the Oslo Manual was published in 1992, which supported guidance for the national statistical offices and other innovation data producers. The first Community Innovation Survey (CIS) was conducted in 1993 in the EU.
Since 1998, data were collected every two years. The primary basis of this study is an analysis of published data from the latest CIS survey in 2018. The study aims to analyze the innovation performance of Hungarian firms in an international comparison. Hámori-Szabó 2010 pointed the weak innovation performance of Hungarian companies. They concluded that one reason was that the companies’ relationships with the state and their institutions greatly influence their market chances and that annuity-seeking behavior hinders innovation. The study aims to present the innovation activities of Hungarian companies in an international context, primarily with the help of graphs and visuals. Following the European comparison, the more detailed analysis will focus only on the V4 countries. The study could be a starting point for further research.
Measurement of innovation
Until the late 1970s, only statistics on research and development (R&D) were available. The importance of innovation has brought to the fore the issue of measuring innovation. OECD organized a conference on this topic in 1980. In 1986, a working committee was set up to define innovation metrics and make international comparisons. The NESTI (National Experts on Science and Technology Indicators) work team, in cooperation with the OECD Secretariat and representatives of countries, prepared the Oslo Manual, which can be considered a methodological basis for innovation surveys. The first edition of the Oslo Manual was published in 1992. It dealt only with the measurement of technological-, product- and process- innovation in companies operating in the manufacturing industry. (Szunyogh, 2010) There
(product) or brought into use by the unit (process).” (OECD/Eurostat, 2018 p. 20) This general definition was further developed and operationalised. „Innovation activities include all developmental, financial, and commercial activities undertaken by a firm that are intended to result in an innovation for the firm. Business innovation is a new or improved product or business process (or a combination thereof) that differs significantly from the firm's previous products or business processes and that has been introduced on the market or brought into use by the firm.” (OECD/Eurostat, 2018 p. 20) The third edition of the Oslo Manual defined four types of innovations (product, process, organizational, and marketing).
The first Community Innovation Survey (CIS) was conducted in 1993 in the EU. The survey was carried out with a harmonized questionnaire for the same period in each country. Since 1998, data were collected every two years. Commission Regulation (EC) No 1450/2004 mandated the frequency and methodology of the innovation survey for the EU Member States.
The regulation stipulates the frequency of data collection every two years. A more detailed survey should needed every four years, which contains the circumstances, causes, and effects of innovation. In the intermediate period, “light” surveys are conducted. As the need for information has increased significantly, Member States are encouraged to base all their innovation surveys on a more detailed questionnaire. The Commission Regulation determines the scope of the statistical survey. It covers enterprises with more than ten employees. Member States have the autonomy to decide about carry out full, partial, or a combination of data collection. The regulation determines, what indicators they need to produce. (Szunyogh, 2010) The annual European Innovation Scoreboard (EIS) provides a comparative analysis of innovation performance in EU countries, it overviews the relative strengths and weaknesses of European countries' research and innovation systems. It examines trends and comparing European innovation performance with some Asian and American countries. The EIS measurement framework distinguishes between four main types of activities (framework conditions, investments, innovation activities, impacts) uses ten innovation dimensions (human resources, attractive research systems, innovation-friendly environment, finance and support, firm investments, innovators, linkages, intellectual assets, employment impacts, sales impacts), overall contains total 27 indicators. The Summary Innovation Index was calculated as the unweighted average of the 27 indicators. Member States fall into four different innovation performance groups based on the Summary Innovation Index. The group of countries with outstanding innovation performance is the “Innovation Leader”. These countries' performance was above 125% of the EU average. Denmark, Finland, Luxembourg, the Netherlands, and Sweden belong to this group. The second group is the „Strong Innovators” where the performance was between 95% and 125% of the EU average. Austria, Belgium, Estonia, France, Germany, Ireland, and Portugal are Strong Innovators. Most
Member States belonged to the group of „Moderate Innovators”, where performance was between 50% and 95% of the EU average. Croatia, Cyprus, Czechia, Greece, Hungary, Italy, Latvia, Lithuania, Malta, Poland, Slovakia, Slovenia, and Spain belong to this group. The fourth group of Modest Innovators included two countries (Bulgaria and Romania) where the performance level in this group was below 50% of the EU average. (European Commission, 2020)
Innovative enterprises
According to Oslo Manual, one of the most important mandatory indicators is the rate of innovative firms. The Oslo Manual defines an innovative firm as a firm that reports one or more innovations within the observation period. The key to this definition is what we mean by innovation. “A business innovation is a new or improved product or business process (or a combination thereof) that differs significantly from the firm's previous products or business processes and that has been introduced on the market or brought into use by the firm.”
(OECD/Eurostat, 2018 p. 20) We need to distinguish small change from significant innovation.
The Oslo Manual discusses changes in production or in the logistics that do not consider innovation. For example, minor aesthetic changes of the product, like changes in colour or minor changes in shape, do not meet the requirements of innovation. Routine changes or updates like maintenance, or software upgrades are not innovative changes. Some structural changes in the production, like outsourcing a business process or ceasing the outsourcing are not innovative either. Withdrawing a product from the market or widen the range of products (in case of retail, wholesale, transport companies) are not innovations themselves, only if the extension requires significant changes by the firm to its business processes or logistics.
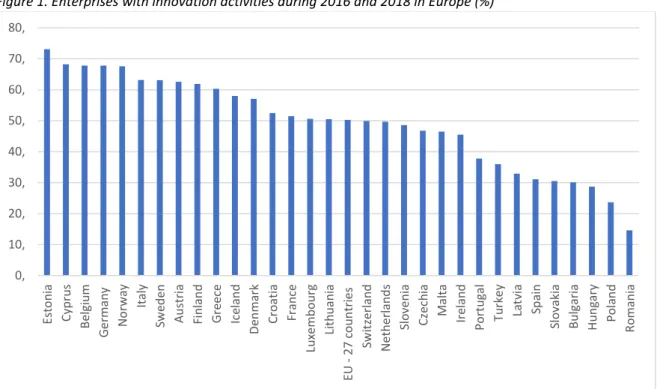
Investigating the 2016-2018 period, we can see that the rate of the innovative firms is one of the lowest (28,7%) in Hungary comparing European countries. (See Figure 1)
Figure 1. Enterprises with innovation activities during 2016 and 2018 in Europe (%)
Source: Own construction based on CIS database Database - Science, technology and innovation - Eurostat (europa.eu) Number of innovative enterprises in the EU: 366 758
There was a more detailed comparison among the V4 countries. The EU average was the benchmark. All the four Visegrad countries belong to “Moderate Innovators” according to European Innovation Scoreboard (EIS). The analysis by company size does not provide a better picture of the innovation performance of Hungarian companies either. In all company size categories, the proportion of innovative enterprises in Hungary is 30-40% lower than the average in the European Union. (See Figure 2)
0, 10, 20, 30, 40, 50, 60, 70, 80,
Estonia Cyprus Belgium Germany Norway Italy Sweden Austria Finland Greece Iceland Denmark Croatia France Luxembourg Lithuania EU - 27 countries Switzerland Netherlands Slovenia Czechia Malta Ireland Portugal Turkey Latvia Spain Slovakia Bulgaria Hungary Poland Romania
Figure 2. Enterprises with innovation activities during 2016 and 2018 by company size in V4 countries (%)
Source: Own construction based on CIS database Database - Science, technology and innovation - Eurostat (europa.eu)
The fourth edition of the Oslo Manual defines two main types of innovation: product innovation and business process innovation. „A product innovation is a new or improved good or service that differs significantly from the firm’s previous goods or services, and that has been introduced on the market.” (OECD/Eurostat, 2018 p. 70) Although the rates of enterprises with product innovation and the enterprises with process innovation were about 20% in Hungary in 2018, we did not achieve as bad a ranking in the ranking of companies as concerning process innovation. Based on the previous findings, we even surpassed Slovakia.
(See Figure 3.)
0 10 20 30 40 50 60 70 80 90
From 10 to 49 employees From 50 to 249 employees 250 employees or more
Poland Hungary Slovakia Czechia European Union - 27 countries
Figure 3. Product innovative enterprises that have introduced at least one new or significantly improved product in Europe in 2018 (%)
Source: Own construction based on CIS database Statistics | Eurostat (europa.eu)
Analysing company size, we found a smaller lag to the EU average in all categories than comparing to the innovative enterprises. (See Figure 4)
Figure 4. Product innovative enterprises that have introduced at least one new or significantly improved product in V4 countries by company size in 2018 (%)
Source: Own construction based on CIS database Statistics | Eurostat (europa.eu)
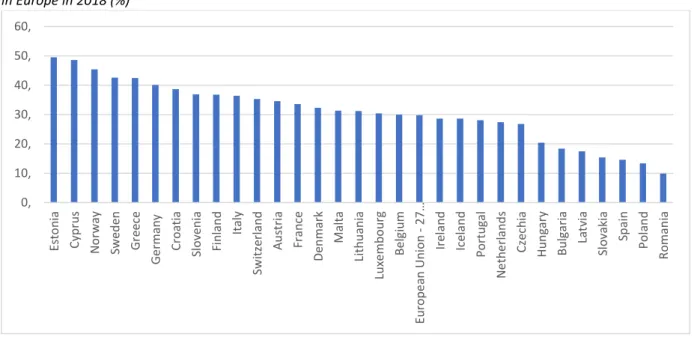
„A business process innovation is a new or improved business process for one or more business functions that differs significantly from the firm’s previous business processes and that has been brought into use in the firm.” (OECD/Eurostat, 2018 p. 72) According to the international survey, one of the weak points of Hungarian companies is process innovation. We are the third
0, 10, 20, 30, 40, 50, 60,
Estonia Cyprus Norway Sweden Greece Germany Croatia Slovenia Finland Italy Switzerland Austria France Denmark Malta Lithuania Luxembourg Belgium European Union - 27… Ireland Iceland Portugal Netherlands Czechia Hungary Bulgaria Latvia Slovakia Spain Poland Romania
0 10 20 30 40 50 60
From 10 to 49 employees From 50 to 249 employees 250 employees or more
Poland Hungary Slovakia Czechia European Union - 27 countries
from the bottom in the European rankings. Poland and Romania perform only worse than us.
(See Figure 5.)
Figure 5. Enterprises that introduced new or improved processes in Europe in 2018 (%)
Source: Own construction based on CIS database Statistics | Eurostat (europa.eu)
In Hungary, the proportion of companies with more than 250 employees who have business process innovation did not reach 40%. In our case, only Romania performed worse. The rate of large companies with process innovation in the EU was 65.5%. In the case of small and medium-sized companies, the Hungarian ratio was less than half of the European average. In the case of enterprises with 10 to 49 employees, Poland's performance was even worse than ours. In the case of medium-sized companies, we were again only ahead of the weakest performing Romania. (See Figure 6)
0, 10, 20, 30, 40, 50, 60, 70,
Cyprus Belgium Germany Greece Austria Italy Estonia Norway Sweden Finland Denmark Croatia Lithuania Iceland European Union - 27… Malta France Czechia Luxembourg Netherlands Ireland Slovenia Portugal Switzerland Latvia Spain Slovakia Bulgaria Hungary Poland Romania
Figure 6. Enterprises that introduced new or improved processes by company size in V4 countries
Source: Own construction based on CIS database Statistics | Eurostat (europa.eu)
The Community Innovation Survey (CIS) examined the different types besides the general questions of the innovation process. (See Figure 7.)
0 10 20 30 40 50 60 70
From 10 to 49 employees From 50 to 249 employees 250 employees or more
Poland Hungary Slovakia Czechia European Union - 27 countries
Figure 7. Enterprises that introduced new or improved processes by type of innovation in V4 countries (%)
Source: Own construction based on CIS database Statistics | Eurostat (europa.eu)
Enterprises with research and development (R&D) activities
The Community Innovation Survey (CIS) collects data about enterprises’ research and development (R&D) activities. Although Hungary (11.1%) lags behind the EU average (22.6%) regarding the rate of enterprises with in-house and contracted-out research and development,
0,0 5,0 10,0 15,0 20,0 25,0 30,0 35,0 40,0 45,0 Business process innovation
New or improved methods for producing goods or providing services
Innovations in logistics New business practices for organising procedures or
external relations
New methods of organising work responsibility, decision making or human resource management New or improved methods for information processing
or communication
New methods for accounting or other administrative operations
New marketing methods for promotion, packaging, pricing, product placement or after sales services
Slovakia Poland Hungary Czechia European Union - 27 countries
Figure 8. Enterprises with research and development (R&D) activities during 2016 and 2018 (%)
Source: Own construction based on CIS database Statistics | Eurostat (europa.eu)
Figure 9. Enterprises with research and development (R&D) activities during 2016 and 2018 by company size in V4 countries (%)
Source: Own construction based on CIS database Statistics | Eurostat (europa.eu)
European Innovation Scoreboard (EIS)
NKFI 2018 report found that Hungary made little progress in the EIS ranking compared to previous years. It showed more or less growth in more than half of the indicators. At the same time, Hungary's position in the innovation performance of SMEs between 2010 and 2017 compared to the EU changed unfavorably. The European Innovation Scoreboard 2020 report
0, 5, 10, 15, 20, 25, 30, 35, 40, 45, 50,
Finland Netherlands Belgium France Norway Italy Germany Ireland Iceland Greece Czechia Austria Switzerland EU_27 Estonia Slovenia Luxembourg Sweden Denmark Lithuania Portugal Croatia Slovakia Spain Hungary Malta Cyprus Bulgaria Poland Latvia Romania
In-house or contracted-out research and development (R&D)
0 10 20 30 40 50 60
From 10 to 49 employees From 50 to 249 employees 250 employees or more
Poland Hungary Slovakia Czechia European Union - 27 countries
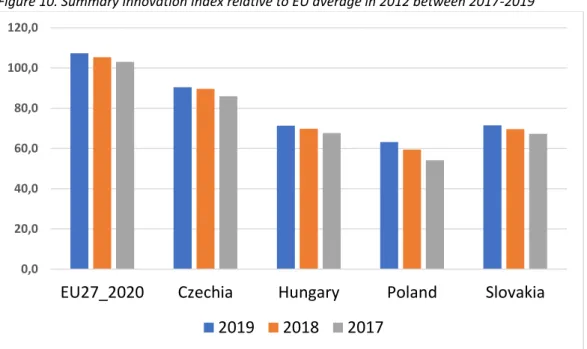
also found that Hungary's performance has increased relative to the EU average in 2012, particularly since 2017. Figure 10. shows this improving trend.
Figure 10. Summary Innovation Index relative to EU average in 2012 between 2017-2019
Source: Own construction based on European Innovation Scoreboard 2020 – Database DocsRoom - European Commission (europa.eu)
Despite a small improvement, Hungary is still lagging in international comparison. Figure 11 shows that the Visegrad countries lag behind the EU average. That is the reason for being in the “Moderate Innovators” group.
Figure 11. Summary Innovation Index in 2019 relative to EU average in 2012 0,0
20,0 40,0 60,0 80,0 100,0 120,0
EU27_2020 Czechia Hungary Poland Slovakia 2019 2018 2017
120,0 140,0 160,0 180,0 200,0
The European Innovation Scoreboard 2020 also points out that the two weakest points of Hungary’s innovation performance are: SMEs marketing/organizational innovations and SMEs innovating in-house. The Scoreboard consists of 27 indicators. This paper presents only three indicators of SMEs innovation performance. Figures 12-14 show that Hungary's innovation performance is weak in the examined factors.
Figure 12. SMEs with product or process innovations in 2019 relative to EU average in 2012
Source: Own construction based on European Innovation Scoreboard 2020 – Database DocsRoom - European Commission (europa.eu)
Figure 13. SMEs with marketing or organisational innovations in 2019 relative to EU average in 2012
Source: Own construction based on European Innovation Scoreboard 2020 – Database DocsRoom - European Commission (europa.eu)
0,0 20,0 40,0 60,0 80,0 100,0 120,0 140,0 160,0 180,0 200,0
PT FI NO ME NL BE AT CH IS EL TR EE DE IT LU SE UK FR LT IE EU RS DK Czechia HR CY MK SI MT IL Slovakia LV ES Hungary BG Poland UA RO
0,0 20,0 40,0 60,0 80,0 100,0 120,0 140,0 160,0 180,0
CH NO LU AT TR IE PT EL DE FR BE IL FI UK DK IS IT HR SE EU ME LT NL Czechia RS MK CY ES SI MT LV EE Slovakia Hungary BG UA Poland RO
Figure 14. SMEs innovating in-house in 2019 relative to EU average in 2012
Source: Own construction based on European Innovation Scoreboard 2020 – Database DocsRoom - European Commission (europa.eu)
Overall, the European Innovation Scoreboard also pointed out that one of the weakest points of Hungary's innovation performance is the innovation activities of small and medium-sized enterprises. In this respect, Hungary lags far behind in European comparison.
Innovation barriers according CIS
European statistics have shown that Hungary lags far behind in international comparison in terms of innovation. The question arises, what might be the reason for this. The CIS survey also addresses barriers to innovation. Respondents were asked to rate 9 factors based on how much they pull back innovation. Possible answers are: high, medium, low, none.
Figures 15-24 show the percentage of the surveyed firms who claimed that the investigated factor was not a barrier to their innovation. Our hypothesis that, due to the low rate of
0,0 20,0 40,0 60,0 80,0 100,0 120,0 140,0 160,0 180,0
PT FI NO TR BE EL IT EE AT CH DE LU NL IE FR SE LT Czechia RS EU CY HR UK DK SI IL MT UA Slovakia LV Hungary ES BG Poland RO
Figure 15. Rate of enterprises for which “Lack of internal finance” in not an innovation barrier
Source: Own construction based on CIS database Statistics | Eurostat (europa.eu)
Figure 16. Rate of enterprises for which “Lack of external finance” in not an innovation barrier
Source: Own construction based on CIS database Statistics | Eurostat (europa.eu)
0 10 20 30 40 50 60 70
Sw ed en M alt a Fin lan d B u lgaria Po lan d H u n gary Slo ven ia Lu xembou rg Au st ria Po rt u gal Sw it zer lan d Sp ain Irelan d Fra n ce Lat via Lit h u an ia Italy Est on ia Cy p ru s C zech ia R oman ia C ro at ia Slo vak ia Gree ce Turk ey D en mar k
0, 10, 20, 30, 40, 50, 60, 70, 80,
Finland Malta Sweden Slovenia Bulgaria Luxembourg Hungary Austria Poland Ireland Switzerland Spain Estonia Portugal Lithuania Latvia Italy France Czechia Cyprus Slovakia Croatia Romania Greece Turkey Denmark
Figure 17. Rate of enterprises for which “High costs” in not an innovation barrier
Source: Own construction based on CIS database Statistics | Eurostat (europa.eu)
Figure 18. Rate of enterprises for which “Lack of qualified employees within enterprise” in not an innovation barrier
0, 10, 20, 30, 40, 50, 60, 70,
Fin lan d B u lgaria M alt a Swed e n Po lan d H u n gary Lu xembou rg Slo ven ia Fra n ce Lit h u an ia Au st ria Irelan d Lat via Sp ain It aly Sw it zerlan d Po rt u gal R oman ia Croat ia Est on ia C yp ru s Slo vak ia Gree ce D en mar k
0, 10, 20, 30, 40, 50, 60,
a nd a en d ia rg nia d ain ia gal ce hia a rus ia ia d e nia k
Figure 19. Rate of enterprises for which “Lack of collaboration partners” in not an innovation barrier
Source: Own construction based on CIS database Statistics | Eurostat (europa.eu)
Figure 20. Rate of enterprises for which “Difficulties in obtaining public grants or subsidies” in not an innovation barrier
Source: Own construction based on CIS database Statistics | Eurostat (europa.eu)
0, 10, 20, 30, 40, 50, 60, 70, 80,
0, 10, 20, 30, 40, 50, 60, 70, 80,
Figure 21. Rate of enterprises for which “Uncertain market demand” in not an innovation barrier
Source: Own construction based on CIS database Statistics | Eurostat (europa.eu)
Figure 22. Rate of enterprises for which “High competition” in not an innovation barrier 0,
10, 20, 30, 40, 50, 60, 70,
0, 10, 20, 30, 40, 50, 60, 70,
Figure 23. Rate of enterprises for which “Lack of access to external knowledge” in not an innovation barrier
Source: Own construction based on CIS database Statistics | Eurostat (europa.eu)
Figure 24. Rate of enterprises for which “Different priorities within the enterprise” in not an innovation barrier
Source: Own construction based on CIS database Statistics | Eurostat (europa.eu)
0, 10, 20, 30, 40, 50, 60, 70, 80,
0, 10, 20, 30, 40, 50, 60, 70, 80,
Conclusion
Although NKFI 2018 and the European Innovation Scoreboard (EIS) 2020 pointed a small improvement in Hungarian innovation activity relative to the EU average, Hungary is still lagging in international comparison. Hungary and V4 countries belong to the „Moderate Innovators”, where performance was between 50% and 95% of the EU average. According to EIS 2020, SMEs innovation performance was one of the weakest points in Hungary.
We investigated Hungarian enterprises’ innovation performance based on Community Innovation Survey (CIS). The rate of innovative firms is one of the lowest (28,7%) in Hungary comparing European countries. The rates of enterprises with product innovation and the enterprises with process innovation were about 20%. In international comparison, the process innovation is where Hungary lags mostly behind. The rate of companies with more than 250 employees who have business process innovation did not reach 40%. The EU average was 65.5%. In the case of small and medium-sized companies, the Hungarian ratio was less than half of the European average.
The analysis of the CIS database did not explain the low proportion of innovative companies in Hungary. Although the rate of companies with R&D is low in Hungary (11.1%), there was no significant correlation between the rate of innovative enterprises and the rate of enterprises with R&D within the group of “Moderate Innovators”. We couldn’t conclude that the weak innovation performance of Hungarian companies is mainly, or not only, due to weak R&D activity. The analysis of innovation barriers in the CIS database did not help to understand the roots of the problem. In more than half of the surveyed Hungarian firms, the following factors did not hamper the innovation: lack of internal finance, lack of external finance (credit or private equity), lack of collaboration partners, difficulties in obtaining public grants or subsidies, uncertain market demand, high competition, lack of access to external knowledge.
The two most significant barriers: a high cost and a lack of qualified employees within the enterprise. Correlation analysis did not show a significant relationship between the examined barriers and the proportion of innovative enterprises, so this question needs further
References
Community Innovation Survey: Database - Science, technology and innovation - Eurostat (europa.eu)
European Commission (2020): European Innovation Scoreboard 2020 DocsRoom - European Commission (europa.eu)
Hámori B – Szabó K. (2010): A gyenge hazai innovációs teljesítmény intézményi magyarázatához. Közgazdasági Szemle 2010. október pp. 876-897.
NKFI (2018): Milyen a hazai innovációs teljesítmény az EU 2018-ban kiadott innovációs rangsorának adatai szerint? Nemzeti Kutatási, Fejlesztési és Innovációs Hivatal | Milyen a hazai innovációs teljesítmény az EU 2018-ban kiadott innovációs rangsorának adatai szerint?
(gov.hu)
OECD/Eurostat (2018), Oslo Manual 2018: Guidelines for Collecting, Reporting and Using Data on Innovation, 4th Edition, The Measurement of Scientific, Technological and Innovation Activities, OECD Publishing, Paris/Eurostat, Luxembourg
Szunyogh Zs. (2010): Az innováció mérésének módszertani kérdései Statisztikai Szemle, 88.
évfolyam 5. szám, pp. 493-507. Microsoft Word - szunyogh.doc (ksh.hu)
Schwab K. ed. (2018): The Global Competitiveness Report 2018 http://www3.weforum.org/docs/GCR2018/05FullReport/TheGlobalCompetitivenessReport 2018.pdf