Hameed Khan, Muhammad Asif Khan, Masood Ahmed, József Popp and Judit Oláh / Montenegrin Journal of Economics, Vol. 17, No. 2 (2021), 121-134
121
‘
The Nexus between Export Diversification and Foreign Direct Investment: Empirical Evidence from China
HAMEED KHAN
1,2, MUHAMMAD ASIF KHAN (
Correspondent author)
3, MASOOD AHMED
4, JÓZSEF POPP
5,6and JUDIT OLÁH
7,81 School of Economics, Jilin University, Changchun 130012, Jilin, China
2 Department of Economics, Kohat University of Science & Technology, Kohat 26000, Pakistan;
e-mail: hameed.qec@gmail.com
3Faculty of Management Sciences, University of Kotli, Azad Jammu and Kashmir, 11100, Pakistan;
e-mail: khanasif82@uokajk.edu.pk
4Faculty of Management Sciences, University of Kotli, Azad Jammu and Kashmir, 11100, Pakistan;
e-mail: mrmasoodamalik@gmail.com
5 Faculty of Economics and Social Sciences, SzentIstván University, Gödöllő, Hungary;
e-mail: popp.jozsef@gtk.szie.hu
6 TRADE Research Entity, North-West University, Vanderbijlpark 1900, South Africa
7 Institute of Applied Informatics and Logistics, Faculty of Economics and Business, University of Debrecen, Debrecen, Hungary; e-mail: olah.judit@econ.unideb.hu
8 TRADE Research Entity, North-West University, Vanderbijlpark 1900, South Africa
A R T I C L E I N F O A B S T R A C T
Received July 29, 2020 Revised from August 27, 2020 Accepted September 29, 2020 Available online June 15, 2021
The transformation of the Chinese economy into a high-tech manu- facturing hub spurred a heated debate among policymakers and academia. The large-scale market-friendly reforms have resulted in massive FDI inflows and high export diversification along with the extensive as well as intensive margins. By using the ARDL and VECM approaches, this paper revisits the theoretical and empirical con- nection between export diversification and FDI inflows in the frame- work of the Melitz model. The cointegration outcomes indicate a long-run relationship between export diversification and FDI, where the later has a diversifying effect on Chinese exports. The estimated coefficients show that export concentration has negatively related to FDI in China. Conversely, the results validate the presence of a positive spillover effect on export diversification. The reverse effect also holds, and the results indicate that export concentration has a negative effect on FDI or in other words, export diversification can attract foreign capital. It means that the diversifying capabilities of firms’ allure FDI inflows. Further, the granger causality analysis confirms the short- and long-run bidirectional causalities between the variables of interest. Overall, the results confirm the validity of the Melitz model and spillover theory. The inclusion of control varia- bles is robust to our analysis. The study advocates several policy implications for the stakeholders.
JEL classification: F21, F10, O14 DOI: ...
Keywords:
Export Diversification, FDI,
ARDL, China
ELIT
Economic Laboratory Transition Research Podgorica
Montenegrin Journal of Economics
Vol. 17, No. 2 (2021), 121-134
Hameed Khan, Muhammad Asif Khan, Masood Ahmed, József Popp and Judit Oláh / Montenegrin Journal of Economics, Vol. 17, No. 2 (2021), 121-134
122
INTRODUCTION
During the past couple of decades, China has experienced unprecedented economic develop- ment, which in turn favored a substantial amount of foreign direct investment (FDI) and, thus, it became the world's second-largest FDI destination after the United States in 2017 with remarkable inflows of $136 billion (UNCTAD, 2018). Being the leading export-oriented economy, China has also made significant progress in export diversification and product differentiation.
Hausmann et al. (2019) reported that China exports 540 products which make it comparatively a well-diversified economy. The recent increasing trends in export diversification and FDI in China gain the attention of the policymakers and academicians and trigger the debate regarding the FDI and export diversification nexus.
Recently, economic literature increasingly focuses on knowledge capital and its role in enhanc- ing the quality of manufactured products (Niţescu et al., 2019). Literature evidenced that countries with over-dependence on the export of primary goods fail to attain sustainable economic growth (Majerova et al., 2020). The Prebish–Singer thesis noted that the declining terms of trade in prima- ry goods might be useful for the vertical export diversification. Similarly, the dependence on ex- ports of primary goods may entail both long as well as short-term vulnerabilities to the economy. To reduce such vulnerabilities, the best strategy is the horizontal diversification in exports across markets and products (Harrison and Rodríguez-Clare, 2010). Various factors can help in export diversification and offer considerable developmental benefits of export diversification.
China has made phenomenal progress in export diversification in recent years through various industrial reforms and opening-up policies, which transformed its economy into a manufacturing hub; thus, it attained a huge production capacity in the major fields of energy, metallurgy, chemical industry, building materials, manufacturing of machinery and communication equipment, manufac- turing of transportation equipment, and various consumer goods. The main industrial products comprise coal, iron and steel, power generation, crude oil, cement, chemical fertilizers, chemical fibers, cotton, sugar, and televisions.
Our review of the literature has identified the dearth of studies on FDI and export diversifica- tion. Most of the previous literature focuses on the growth-enhancing effects of FDI and export diversification (Vasa and Angeloska, 2020; Yiew and Lau, 2018). For example, Kabaklari et al.
(2018) state that the export structure has played an important role in the economic growth theo- ries of many countries since the 1960s, as export growth has been associated with faster produc- tivity and GDP growth. However, there is scarce literature on the spillover effect of MNEs on the export pattern of host countries. On these lines, the diversifying impacts of FDI in a cross-country analysis (Tadesse and Shukralla, 2013) portrays a blurred picture of the true FDI and export diver- sification relationship. Moreover, the cross-country analysis involves the issues of cross-sectional dependence and heterogeneity (Majerova, 2014); therefore, the results may be biased and mis- leading. Similarly, another study (Banga, 2006)on the firm-level dynamics seems to ignore some crucial sectors of the economy. Therefore, we contribute to the existing literature by examining the interrelationship of FDI and export diversification at the macro level by providing evidence from China. Similarly, one should expect FDI inflows to be higher as export diversification rises. Hence, to the best of our knowledge, this is the first effort that explores the bidirectional relationship be- tween export diversification and FDI inflows in the context of the world's largest export economy.
The remaining study is organized as follows. Section 2 highlights the stylized facts about the export diversification and FDI inflows to China. Model construction and data are documented in Section 3, followed by methods and results in Section 4. Concluding remarks and policy implications are provided in the last section.
Hameed Khan, Muhammad Asif Khan, Masood Ahmed, József Popp and Judit Oláh / Montenegrin Journal of Economics, Vol. 17, No. 2 (2021), 121-134
123
1. EXPORT DIVERSIFICATION AND FDI INFLOWS TO CHINA
1.1 Export Diversification
The leading export performance of China is a well-established fact. China relied on primary goods before the economic reforms. During the 1990s, China’s merchandise exports raised due to the introduction of market-friendly reforms. China reaped the benefits of comparative advantage by producing and exporting labor-intensive products due to the abundance of labor. The products mainly consist of travel goods, textiles, toys, footwear, and sporting goods (National Bureau of Statistics of China, 2018). Chinese exports were relatively less diversified and more concentrated in the early 1990s. However, its position is quite good compared to the other developing countries and transition economies (being the fact that China is also one of the developing countries).
The leading export performance of China is a well-established fact. China mainly relied on pri- mary goods before economic reform. During the 1990s, China’s merchandise exports raised due to the introduction of market-friendly reforms. In those times, China reaped the benefits of compara- tive advantage by producing and exporting labor-intensive products due to the abundance of labor.
The products mainly consist of travel goods, textiles, toys, footwear, and sporting goods. In the 2000s, due to a significant structural transformation and integration in the world market by joining the WTO in 2001, the Chinese cheaper manufactured and more diversified exports flooded the world markets. The Chinese economy graduated from labor‐intensive products’ exporter to more sophisticated and technology-intensive products like electric machinery, telecommunication equipment, and office machines, etc. China has been broadly successful in transforming its export sectors towards hi-tech, higher added‐value goods, and made it more diversified. As a result, China has become a world leader in the exports of office and telecom equipment (Bieliński, 2016). The reform process led China to become a major exporting country with a socialist market economy and today her exports are quite diversified.
In 2001, China acceded to the World Trade Organization (WTO). The integration into the world market allowed China to flood the world market with cheaper manufactured and diversified ex- ports. The Chinese economy gradually shifted from labor‐intensive products to the more sophisti- cated as well as the technology-intensive products, e.g., electric machinery, telecommunication equipment, and office machines. After 2001, China has been successful in transforming its export sectors towards hi-tech, higher added‐value goods, and made it more diversified. The opening up reforms led China to become a major exporting country with a socialist market economy, and today her exports are well diversified. The report of the 19th National Congress of the Communist Party of China pointed out that it is necessary to "cultivate world-class enterprises with global competitive- ness" and then "promote the establishment of a strong country through trade." After the rapid de- velopment of foreign trade in the past 40 years of reform and opening-up, China has now grown into a world-renowned trading country with the products spread all over the world with the label of
"Made in China." However, a large trading country does not necessarily mean a strong trading country. The efficiency and profitability of Chinese export companies are far less than those of de- veloped countries. With the rapid expansion in the scale of China's exports, the transformation and up-gradation of the export structure has become an important strategic tool to achieve the status of the strong trading nation and the promotion and formation of more efficient and capable export enterprises.
1.2 FDI Inflows to China
The open-door policy and reform of China to achieve economic growth through the active in- troduction of foreign capital and technology led the huge amount of FDI inflow in the early 1990s.
Hameed Khan, Muhammad Asif Khan, Masood Ahmed, József Popp and Judit Oláh / Montenegrin Journal of Economics, Vol. 17, No. 2 (2021), 121-134
124
The opening-up policies enable China to reap the benefit of foreign experience and boost economic development. The annual GDP growth rate increased from 3.9% in 1990 to the highest level of 14.23% in 2007, and the per capita GDP rise from 730.77 USD up to the level of 7329 USD in the year 2017(World Bank, 2018). The FDI inflows in China expanded from $3.49 billion in 1990 to
$136 billion in 2017. In 2017, the tertiary sector (services) portion in total FDI was 68%, second- ary sector (manufacturing) portion is 30%, and the primary sector (agriculture, fishing & mining) counted for only 2%. According to UNCTAD (2018), China is ranked the world's second-largest FDI recipient after the United States, with record inflows of $136 billion in 2017. In 2017, Hong Kong was the largest investor in China, with a 72% share in total FDI inflows. Other notable investors are from the USA (2%), Europe (7%), Singapore (4%), South Korea (3%), and Japan (2%). On the outset of reforms, the first thing that happened is the Deng Xiaoping came to power and normalized rela- tions with the USA. Deng took a trip to the USA and immediately announced the joint venture law designed to encourage foreign technologies to come to China. He mainly aims to bring technology to help to Chinese economy advance. When Deng visited the USA, he very specifically went to Hi- tech cities like including Houston to see signal what China wants to collaborate with high technolo- gy firms. The joint venture law carried many specific provisions regarding taxation etc. designed to entice foreign firms to invest in China.
There are several characteristics of FDI in China. Firstly, before 2001, foreign firms invested heavily in the manufacturing sector, e.g., property development, utilities, and manufacturing. The proportion of foreign investment in the service sector significantly increased industry due to Chi- na’s accession to the WTO in 2001. The accession enabled China to relax restrictions on foreign investment in the service industry. The measure enhanced the level of FDI in the services sector by 24.7% in 2005 to 68% in 2017 (National Bureau of Statistics of China, 2018). Secondly, foreign capital flows mainly from Asian countries. Thirdly, the provinces in China are officially classified into three regions: The Western, the Central, and the Eastern or Coastal. FDI is unevenly distributed across provinces. From 1985 to 1998, the Central and the Western regions together only received less than 15 percent, while the Eastern region received the lion's share of the total FDI amount, more than 85 percent. In 2016, the eastern provinces' share in total FDI is 82.31%, while western and central provinces together received 17.69%.
2. MODEL CONSTRUCTION AND DATA 2.1 Theoretical model
Diversification is the strategy of international trade and economic development that countries try to put in place to continue the growth and development of their countries through product inno- vation (Maier et al., 2019; Mura and Rozsa, 2013). The key idea of diversification is the diversifica- tion in exports. The major problem of the developing countries is the over-dependence on the ex- port of primary commodities (South Centre, 2010). The primary commodities are volatile because the prices of such commodities are inelastic. Moreover, the developing countries are pushed to- wards the development of manufactured goods by increasing the technology and skills of their workers. Classical and comparative advantage theories explain the trade pattern in a perfectly competitive market and constant returns to scale; therefore, these theories did not explain the situation in which similar nations trade in similar but differentiated products (Krugman, 1980).
Based on Krugman’s model, Melitz (2003) presented a trade model. The Melitz model discusses the monopolistic competition and heterogeneous firms. The firms engaged in the production of differentiated products by considering their productivity, fixed costs, and efficiency. Unlike the Krugman or Lancaster models, a company entering a sector does not know the productivity of its technology; it is only after paying the entry costs that a company discovers its level of productivity, where the level of productivity is determined by knowledge, gained through internal and external
sources (Mijatoví et al., 2019).
Hameed Khan, Muhammad Asif Khan, Masood Ahmed, József Popp and Judit Oláh / Montenegrin Journal of Economics, Vol. 17, No. 2 (2021), 121-134
125 In this regard, we have intensive (volume of exports per firm) and extensive margins (probabil- ity of the firm of being an exporter) concept. The intensive margin framework, a firm chooses to decide how much to export, while in the extensive margin is featured by a situation where by sunk costs of exporting firms generate a threshold level, and only firms that are productive enough may export. Hence, the least productive companies will not stay in business, while the most productive companies will export (Mura et al., 2018). Firms with less productivity will only serve the domestic market, while exporters will also serve the domestic as well as foreign market. In the end, this model makes it possible to reproduce the dynamics observed at the empirical level during epi- sodes of trade liberalization. The rising trade costs push out the least productive firms out of the market; therefore, the most productive firms can export. Because it eliminates the least productive companies and gives more weight to high productivity firms in each sector, trade liberalization in- creases the average productivity of the latter. Several authors then took up and developed the Melitz model to measure the gains from trade when a sector or a country open to foreign competi- tion. Next, we turn towards FDI that affects the drivers of export diversification. There are two channels through which FDI affects the level of export Niţescu et al. (2019) and its diversification.
Through the direct channel, FDI engages in the production and the export of high-quality products (Javorcik, 2008). Indirectly, foreign firms transfer technologies to the local industries through the backward and forward linkages, thereby encourage indigenous production to be sophisticated and diversified. Therefore, FDI may enable the host firms to produce a wider variety of more sophisti- cated products (Hausmann et al., 2019; Javorcik, 2008). FDI directly adds to employment, capital, exports, and new technology in the host country. Besides, local businesses can benefit from the indirect effects of improved productivity through demonstration effects and labor mobility. Besides the direct economic benefits, the developing countries strive to attract FDI to diversify their ex- ports. Countries attract FDI to upgrade and diversify the products. Tadesse and Shukralla (2013) noted that an increase in FDI enhances the diversification of exports; however, the magnitude of the effect varies greatly across countries depending on the stage of diversification.
Figure 1. Horizontal and vertical linkages between MNEs and domestic firms
Hameed Khan, Muhammad Asif Khan, Masood Ahmed, József Popp and Judit Oláh / Montenegrin Journal of Economics, Vol. 17, No. 2 (2021), 121-134
126
Moreover, foreign firms engage in the host economies, transfer technologies, and know-how through forward- and backward linkages (Islam et al., 2020; Javorcik, 2008). MNEs (multinational enterprises) are engaged in transferring the technology and knowledge to their affiliates in host countries, where foreign affiliates are more likely to introduce new products than their indigenous counterparts (Guadalupe et al., 2012). The FDI-related literature has found that it is linked to tech- nology spillover, assisting domestic firms through forwarding and backward linkages, and it indirect and directly impact economic performance. The spillover linkage is classified into two categories, e.g., horizontal, and vertical. Within the sector, spillover is the horizontal dimension. It passes from foreign affiliates to local competitors. Vertical (between sectors) spillover is further classified into two categories, i.e., upstream (forward: from FDI to local buyers) and downstream (backward: from FDI to local suppliers). The presence of MNEs in host economies enables the host firms to capture the cost discovery mechanism and knowledge in the same industry or in upstream (input provid- ing)/downstream (input sourcing) sectors (Javorcik, 2008) (Figure 1).
The following framework is given for the spillover effect of FDI:
iεj it it
jt
iεj it L
jt ljt lt
l K
jt jkt kt
k
Foreign Y Horizontal
Y
Vertical Forward γ Horizontal Vertical Backward α Horizontal
1
1
(2)
* (1)
K
jt jkt kt
k
Demand α Y
1
(3) (4)
In Eq. (1), the terms j, t, Yit, and i represent industry, year, output, and firm respectively. This is called the horizontal spillovers from FDI. Eq. (2) and (3) denote the vertical spillovers. Forwardjt
(Backwardjt) addresses the spillover effects from the foreign firms to the downstream (upstream) indigenous industries and firms. Horizontal is the horizontal spillover mentioned in Eq. (1). γljt is the share of total inputs sourced from sector l to sector j while αjkt is the share of industry j’s output supplied to industry k (to produce one unit of industry k’s output).This implies that the MNEs’ pres- ence can determine a strong inter-industry linkage. Ekholm et al. (2007) argue that FDI locate in the countries not just for serving the host- and home-markets, but they also engage in exporting to the third country. Therefore, FDI contributes to the export growth of the host economies. The au- thors presented a platform through FDI may directly affect the export growth, export diversification, and the formation of differentiated products. MNEs establish foreign affiliates as much as they can cover the cost of doing business and have an advantage over the domestic firms in respect of
‘knowledge capital. The knowledge-capital is in the form of human capital, better technology, blue- prints, and patents.
H1: The presence of MNEs in china is positively related to the export diversification.
H2: The export diversification is positively related to the FDI in China.
2.2 Measurement of export diversification and export concentration indices
The diversification index is computed by measuring the absolute deviation of the trade struc- ture of a country from world structure:
(5) 2
ij i
j i
h h S
Hameed Khan, Muhammad Asif Khan, Masood Ahmed, József Popp and Judit Oláh / Montenegrin Journal of Economics, Vol. 17, No. 2 (2021), 121-134
127 where hij = share of product i in total exports or imports of country or country group j hi = share of product i in total world exports or imports.
The diversification index takes values between 0 and 1. A value closer to 1 indicates a greater di- vergence from the world pattern.1
Concentration index, also named Herfindahl-Hirschmann Index (Product HHI), is a measure of the degree of product concentration. The following normalized HHI is used to obtain values be- tween 0 and 1:
2
1
1
(6) 1 1
n
i j
ij n
H j
n
x X
where Hj = country or country group index xij = value of export for country j and product i
1
(7)
n
j ij
i
X x
and n = number of products (SITC Revision 3 at 3-digit group level).
An index value closer to 1 indicates a country's export or importhighly concentrates on a few products. On the contrary, values closer to 0 reflect exports or imports are more homogeneously distributed among a series of products.
2.3 Data
Following Ouedraogo et al. (2018), our study consist of export concentration, FDI as a share of GDP, institutional quality, ICT, domestic investment, exchange rate, and GDP growth rate. The study period is dictated by data availability and spans 1987–2017. The data about export concen- tration comes from the UNCTAD (2018), while we extract FDI data from the World Bank (2018).
Culture and institutions have a significant impact on trade and economic development (Khan et al., 2020); therefore, we incorporate institutional quality in the empirical analysis. The data about insti- tutional quality is obtained from the International Country Risk Guide (ICRG) database developed by the Political Risk Service Group. The dataset contains several indices (bureaucratic quality, democratic accountability, the rule of law, investment profile, corruption, and government stability) prepared from the multidimensional sub-datasets. Some dataset contains time-invariant indica- tors, so the indices are prepared to make it feasible. A single indicator may produce misleading results for policy considerations; therefore, we use PCA (Principal Component Analysis) to devise an index that may cover all the aspects of institutional quality.
Information and communication technology (ICT) has a favorable influence on the export and economic development (Onete et al., 2018); hence we include ICT as a control variable in our anal- ysis. Following the methodology of Donaubauer et al. (2016), we develop an ICT index, which is composed of several indicators, e.g., number of internet users, the number of personal computer users, the number of ISDN subscriptions, mobile cellular telephone subscriptions, and the number of fixed telephone lines. We use gross fixed capital formation as a proxy for domestic investment.
The data about domestic investment and annual growth rate of GDP is extracted from the World
1 This index is a modified Finger-Kreinin measure of similarity in trade. For more information, please consult the article of Finger, J. M. and M. E. Kreinin (1979), “A measure of ‘export similarity’ and its possible uses” in the Economic Journal, 89: 905-12.
Hameed Khan, Muhammad Asif Khan, Masood Ahmed, József Popp and Judit Oláh / Montenegrin Journal of Economics, Vol. 17, No. 2 (2021), 121-134
128
Bank. Previous literature shows that export has a significant and positive relationship with econom- ic growth (Postelnicu et al., 2015). Following the method of Dai et al., (2017), we develop a real exchange misalignment index for our study.
2.4 Methods and results
To establish the relationship between FDI and EC, we rely on the econometric methodology de- veloped by (Pesaran et al., 2001). The Engle and Granger’s methodology is suitable and useful in the case of two variables. However, in the case of more than two variables, the useful methodology is the Johansen cointegration test. The Johansen cointegration method requires a large sample size and a similar order of integration of all variables. On the other hand, the ARDL method has several relative advantages. It is more appropriate in the case of small samples (Khan et al., 2019). It is also applicable if the stationarity occurs at the first difference I(1) or I(0) or the mixed order I(0) and I(1), where the F-statistics is not invalid in case the variables are I(2) or above (Pesaran et al., 2001). Moreover, the unrestricted error correction model (UECM) seems to take satisfactory lags that captures the data generating process in a general-to-specific frame- work of specification. In Table 1, the results show that the variables are I(0) or I(1), but none of them are I(2); therefore, the criteria paved the way for the ARDL technique. Here we apply Aug- mented Dicky Fuller and Phillips-Perron tests to identify the unit root in our datasets. Next, we ap- ply the ARDL bound-testing technique to investigate the cointegration between underlying study variables. The ARDL bounds testing approach test the null hypothesis of no cointegration among the underlying variables in contrast to an alternative hypothesis of the existence of cointegration among variables. These hypotheses are tested based on the F-test proposed by Pesaran et al.
(2001). They give critical bound values at various significance levels. In this regard, if the comput- ed F-statistic is below the lower bound value, then it indicates no cointegration among the varia- bles. If the F-statistic value is higher than upper-bound, then it depicts cointegration between vari- ables. Finally, if the test statistics lie between the upper and lower bound critical values, the result will be inconclusive for which other cointegration tests could be used.
Table 1. Unit-root results
ADF Test Phillips- Perron
Variable Intercept intercept and trend intercept intercept and trend
t-Statistics t-Statistics Adj. t-Statistics Adj. t-Statistics Unit-root test at level
FDI -1.930 -1.778 -2.073 -1.378
EC -0.871 -2.558 -0.938 -1.797
IQ -1.767 -2.960 -2.156 -2.140
ICT -0.473 -2.281 -0.473 -2.348
Gr -2.83* -2.503 -2.463 -2.320
DI -1.505 -4.768*** -0.960 -2.051
ERM -0.33 -2.136 -0.637 -1.564
Unit-root test at first difference
ΔFDI -4.229*** -4.474*** -4.127*** -5.445***
ΔEC -4.205*** -4.131** -4.151*** -4.071**
ΔIQ -5.709*** -3.743** -5.683*** -5.585***
ΔICT -5.211*** -5.111*** -5.211*** -5.110***
Hameed Khan, Muhammad Asif Khan, Masood Ahmed, József Popp and Judit Oláh / Montenegrin Journal of Economics, Vol. 17, No. 2 (2021), 121-134
129 To establish the cointegration among the underlying variables of the study, we specify the fol- lowing unrestricted error correction models (ECMs);
0
1 1 1 1 1
1 1 2 1 3 1 4 1 5 1
1 1
6 1 7 1 1
p p p p p
t ec iec t i iec t i iec t i iec t i iec t i
i i i i i
p p
iec t i iec t i ec t ec t ec t ec t ec t
i i
ec t ec t t
EC EC FDI IQ CI DI
ERM Gr EC FDI IQ CI DI
ERM Gr (8)
0
1 1 1 1 1
1 1 2 1 3 1 4 1 5 1
1 1
6 1
p p p p p
t fdi ifdi t i ifdi t i ifdi t i ifdi t i ifdi t i
i i i i i
p p
ifdi t i ifdi t i fdi t fdi t fdi t fdi t fdi t
i i
fdi t
FDI FDI EC IQ CI DI
ERM Gr FDI EC IQ CI DI
ERM 7fdiGrt12t (9)
In Eq. 8-9, the variables EC, FDI, IQ, CI, DI, ERM, and Gr represent the export concentration, foreign direct investment, institutional quality, ICT, domestic investment, exchange rate misalign- ment, an annual growth rate, respectively. The subscript t is the time dimension. ARDL technique will be applied to identify the long-run and short-run dynamics of the relationship. We include DI, ERM, and Gr in our baseline model for the in-depth analysis of the mechanism and robustness of the results. The long-run results are presented in Table 2. The estimated F-statistics’ values are above the upper bound critical values at 1%, 5% and 10% level of significance. We compare the estimated F-statistics with the values provided by Narayan (2005). Estimated F-statistics shows that there is a stable long-run relationship between FDI and EC. The hypothesis of no cointegration between the variables is rejected.
Table 2. ARDL bounds test results
Specifications Max
lag F-statistics
Critical values
1% 5% 10%
I(0) I(1) I(0) I(1) I(0) I(1)
Panel A. FDI to EC
EC/(FDI, IQ, CI) 4 3.691* 4.61 5.97 3.27 4.31 2.68 3.59
EC/(FDI, IQ, CI, DI) 4 7.187*** 4.28 5.84 3.06 4.22 2.53 3.56
EC/(FDI, IQ, CI, DI, ERM) 3 10.44*** 4.13 5.76 2.91 4.19 2.41 3.52
EC/(FDI, IQ, CI, DI, ERM, Gr) 3 33.18*** 3.98 5.69 2.79 4.15 2.33 3.52
Panel B. EC to FDI
FDI/(EC, IQ, CI) 4 4.655** 4.61 5.97 3.27 4.31 2.68 3.59
FDI/(EC, IQ, CI, DI) 4 4.391** 4.28 5.84 3.06 4.22 2.53 3.56
FDI/(EC, IQ, CI, DI, ERM) 3 4.576** 4.13 5.76 2.91 4.19 2.41 3.52
FDI/(EC, IQ, CI, DI, ERM, Gr) 2 4.821** 3.98 5.69 2.79 4.15 2.33 3.52
Notes. * p<0.10, ** p<0.05, *** p<0.01. Dependent variables are outside the brackets. Lag selection is based on the AIC. Computed F-statistics are compared with Narayan (2005) critical values for case II: restricted intercept and no trend.
ΔGr -4.1320*** -4.055** -6.066*** -5.907***
ΔDI -3.835*** -3.764*** -4.501*** -4.360***
ΔERM -4.1438*** -4.209*** -4.122*** -4.209***
Note. * p<0.10, ** p<0.05, *** p<0.01. ADF and PP tests include intercept and trend. Lag selection is based on AIC (Akaike information criterion).
Hameed Khan, Muhammad Asif Khan, Masood Ahmed, József Popp and Judit Oláh / Montenegrin Journal of Economics, Vol. 17, No. 2 (2021), 121-134
130
The next step is the estimation of long-run coefficients to study the long-run relationship be- tween the underlying variables. For this purpose, we specify the ARDL framework as follows;
1 0 1 1 1
1 1 1 3
(1 ... ) (1 ... ) (1 ... ) (1 ... )
(1 ... ) (1 ... ) (1 ... ) (10)
r s u v
r t s u v
w x y
w x y t
L L EC L L FDI L L IQ L L CI
L L DI L L ERM L L Gr
1 0 1 1 1
1 1 1 3
(1 ... ) (1 ... ) (1 ... ) (1 ... )
(1 ... ) (1 ... ) (1 ... ) (11)
r s u v
r t s u v
w x y
w x y t
L L FDI L L EC L L IQ L L CI
L L DI L L ERM L L Gr
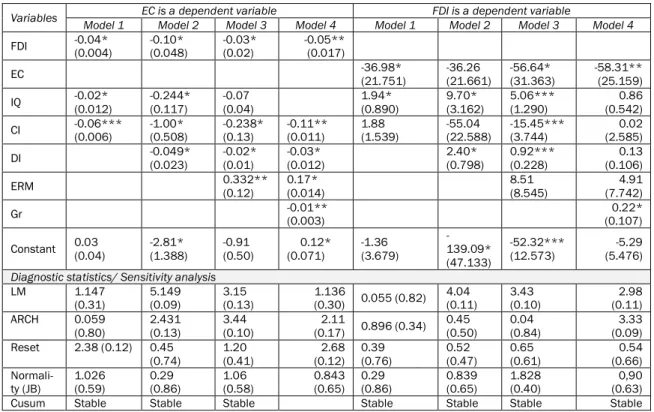
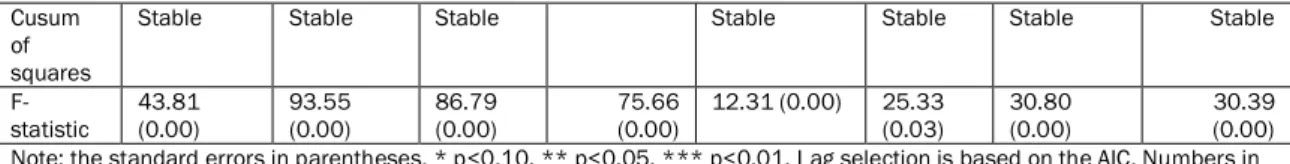
In this step, we only consider models that show cointegration. We reparametrize the Eq. 10 and 11. The step is done to obtain long-run coefficient estimates by including those equations that depict cointegration. Table 3 shows the results of the long-run coefficients. The left-hand portion of the table reports the results when EC is used as a dependent variable. The right-hand portion shows the results of the models when we used FDI as a dependent variable. Moreover, DI, ERM, GR. are used as control variables in these models. The results of EC reveal that FDI adversely af- fects the export concentration. It means that through the spillover effect, an increase in FDI inflows reduces export concentration. Conversely, FDI has a diversifying impact on the export commodities.
The results of the control variables are in line with our expectations and extant literature. The lower panel of the table reports the diagnostic statistics. The diagnostics’ statistics reveal that our mod- els are correctly specified. LM (Lagrange Multiplier) test identifies that our models are not suffering from autocorrelation problem. ARCH (Autoregressive Conditional Heteroskedasticity) test indicates that the residuals are homoskedastic. Ramsey's RESET (regression specification error test) sug- gests that our models do not suffer from omitted variables’ bias and functional misspecification.
The diagnostic statistics obtained by the Jarque–Bera test show that residuals are normally dis- tributed. Cumulative sum (CUSUM) and CUSUM of squares (CUSUMSQ) tests suggest that the es- timated models are stable.
Table 3. Long-run effects
Variables EC is a dependent variable FDI is a dependent variable
Model 1 Model 2 Model 3 Model 4 Model 1 Model 2 Model 3 Model 4
FDI -0.04*
(0.004) -0.10*
(0.048) -0.03*
(0.02) -0.05**
(0.017)
EC -36.98*
(21.751)
-36.26 (21.661)
-56.64*
(31.363)
-58.31**
(25.159) IQ -0.02*
(0.012)
-0.244*
(0.117)
-0.07 (0.04)
1.94*
(0.890)
9.70*
(3.162)
5.06***
(1.290)
0.86 (0.542)
CI -0.06***
(0.006)
-1.00*
(0.508)
-0.238*
(0.13)
-0.11**
(0.011)
1.88 (1.539)
-55.04 (22.588)
-15.45***
(3.744)
0.02 (2.585)
DI -0.049*
(0.023)
-0.02*
(0.01)
-0.03*
(0.012)
2.40*
(0.798)
0.92***
(0.228)
0.13 (0.106)
ERM 0.332**
(0.12)
0.17*
(0.014)
8.51 (8.545)
4.91 (7.742)
Gr -0.01**
(0.003)
0.22*
(0.107) Constant 0.03
(0.04)
-2.81*
(1.388)
-0.91 (0.50)
0.12*
(0.071)
-1.36 (3.679)
- 139.09*
(47.133)
-52.32***
(12.573)
-5.29 (5.476) Diagnostic statistics/ Sensitivity analysis
LM 1.147
(0.31)
5.149 (0.09)
3.15 (0.13)
1.136
(0.30) 0.055 (0.82) 4.04 (0.11)
3.43 (0.10)
2.98 (0.11) ARCH 0.059
(0.80)
2.431 (0.13)
3.44 (0.10)
2.11
(0.17) 0.896 (0.34) 0.45 (0.50)
0.04 (0.84)
3.33 (0.09) Reset 2.38 (0.12) 0.45
(0.74)
1.20 (0.41)
2.68 (0.12)
0.39 (0.76)
0.52 (0.47)
0.65 (0.61)
0.54 (0.66) Normali-
ty (JB) 1.026
(0.59) 0.29
(0.86) 1.06
(0.58) 0.843
(0.65) 0.29
(0.86) 0.839
(0.65) 1.828
(0.40) 0,90
(0.63)
Cusum Stable Stable Stable Stable Stable Stable Stable
Hameed Khan, Muhammad Asif Khan, Masood Ahmed, József Popp and Judit Oláh / Montenegrin Journal of Economics, Vol. 17, No. 2 (2021), 121-134
131
Cusum of squares
Stable Stable Stable Stable Stable Stable Stable
F-
statistic 43.81
(0.00) 93.55
(0.00) 86.79
(0.00) 75.66
(0.00) 12.31 (0.00) 25.33
(0.03) 30.80
(0.00) 30.39
(0.00) Note: the standard errors in parentheses. * p<0.10, ** p<0.05, *** p<0.01. Lag selection is based on the AIC. Numbers in parenthesis are the p-values corresponding to the diagnostic tests.
However, the long-run relationship is necessary but not a sufficient condition for causal rela- tionships among the variables. Evidence of the long-run relationship between variables implies that there should be at least unidirectional causality between underling variables without showing the direction of causality (Narayan, 2005). Therefore, under the VECM environment, the granger cau- sality test identifies the long-run and short-run causality. The ARDL representation of error correc- tion term takes the following form;
0
1 1 1 1 1
1
1 5
1 1
(12)
p p p p p
t ec iec t i iec t i iec t i iec t i iec t i
i i i i i
p p
iec t i iec t i t t
i i
EC EC FDI IQ CI DI
ERM Gr ECT
0
1 1 1 1 1
1 6
1 1
2 (13)
p p p p p
t fdi ifdi t i ifdi t i ifdi t i ifdi t i ifdi t i
i i i i i
p p
ifdi t i ifdi t i t t
i i
FDI FDI EC IQ CI DI
ERM Gr ECT
ECTt-1 is the speed of adjustment of the disequilibrium correction in reaching long-run equilib- rium. The results of the VECM are reported in Table 4. The upper panel of the table reports the results of the export concentration equation. We document the results of the FDI equation in the lower panel. The results document the joint significance of individual explanatory variables. The significant F-statistics show that, in the short-run, both FDI and EC cause each other. Similarly, ECT is significant. The significant F-statistics verify our cointegration results. The control variables also show a causal relationship with the dependent variables. The results are in line with the findings of Banga (2006) and Tadesse and Shukralla (2013).
Table 4. Granger causality results
Causality from FDI to EC
Dependent variable Short-run causality (F-stat) Long-run ECTt-
ΔFDI ΔIQ ΔCI ΔDI ΔERM ΔGr 1
ΔEC 6.64** 1.11 0.10 -0.519***
ΔEC 16.42*** 12.73** 10.20** 18.85*** -0.310**
ΔEC 10.11*** 24.65*** 6.29** 19.75*** 3.56* -0.387*
ΔEC 15.33*** 26.84* 10.02** 29.02** 11.91** 5.10* -0.33**
Reverse causality from EC to FDI
Dependent variable ΔECI ΔIQ ΔCI ΔDI ΔERM ΔGr
ΔFDI 2.26 1.35 7.55** -0.75***
ΔFDI 4.66 5.96* 5.20 14.18* -0.55*
ΔFDI 6.06** 6.49** 4.16* 5.00** 1.88 -0.87***
ΔFDI 4.31** 1.63 1.58 1.60 5.32** 1.44 -0.60***
Note. * p<0.10, ** p<0.05, *** p<0.01.
Overall the results are consistent with the view that FDI inflowsin various sectors of China carry export diversifying impact on Chinese exports. The opening-up policies help MNEs to over-
Hameed Khan, Muhammad Asif Khan, Masood Ahmed, József Popp and Judit Oláh / Montenegrin Journal of Economics, Vol. 17, No. 2 (2021), 121-134
132
come trade costs and promote export growth and export diversification. MNEs invest in various sectors of the economy; therefore, these firms encourage technological spillover, labor mobility, and bring better management practices. (Javorcik, 2008) noted that FDI can help diversify and upgrade the value‐added component of exports by raising productivity, promoting the transfer of knowledge, creating better-paid jobs, and higher-skilled workforce. Therefore, FDI inflows may en- courage countries to participate in global value through the above-cited factors. The reverse also holds. MNEs are the developed world's most important source of corporate research. So, MNEs have a natural advantage for their foreign experience, better management skills, and a large amount of capital. The monopolistic competitions with heterogeneous firms allow consum- ers to make multiple purchases of the same but differentiated products, which may attract MNEs to invest. Our results are similar to the findings of Ekholm, et al. (2007). The authors reported that FDI locates in the countries not just for serving the host- and home-markets, but they also engage in exporting to the third country.
The structure of the Chinese economy has completely realized the transition from an agricul- tural economy to an industrial economy. China has become a large industrial foreign trade country.
The manufactured products have the lion's share in total exports, and the international competi- tiveness of industrial products has been significantly improved. Due to the immense competition and to survive in the global market, the Chinese SOEs and the private enterprises strive hard to opt for cost-minimization and product differentiation strategies. In this regard, we have technology giants like Huawei, Alibaba, ZTE, Alibaba, Baidu, and Tencent. To compete with foreign firms, en- courage these tech-giants to introduce new features in their products and opt strategy for cost- minimization and product differentiation. On the same lines, Haier introduced air conditioner, household heater, and air purifier, which are examples of horizontal export diversification and ap- peal to consumers in these markets. Similarly, FDI inflow brings technology and innovation in products that also contribute to export diversification. On the other hand, the improved perfor- mance of export in various sectors attracts more and more FDI towards China.
CONCLUSION AND POLICY RECOMMENDATIONS
The miraculous transformation of the Chinese economy during the past several decades trig- gered academic research and policymakers to investigate the possible drivers of its industrial revo- lution in the form of export growth and export diversification. The massive FDI inflows in China may be attributed to market-friendly reforms. This study revisits the causal relationship between export diversification and FDI inflows in the context of China.
The extant literature on FDI and export diversification is based on cross-countries and firm- level analysis. The potential endogeneity, heterogeneity, and cross-sectional dependence may mask the true dynamics of the relationship. Therefore, our study is based on the macro-level anal- ysis in the context of the largest exporting country in the world, e.g., China. Using the ARDL and VECM techniques, the findings indicate that both variables are negatively related in the long-run and as well as in the short-run. FDI inflows reduce the level of export concentration. Conversely speaking, FDI has a diversifying impact on Chinese exports. The reverse also holds. The transfor- mation of the Chinese economy in the form of quality and export diversification largely explains FDI inflows. The results of the control variables are consistent with the existing literature.
Therefore, the priority of the policymakers should be to consider and ensure such measures that could attract more FDI and improve export performance. The investment promotion policies should be in place to attract foreign capital and technology. As China faces fierce competition with the neighboring countries and to cope with this tax holidays and preferential tariff should be intro- duced to attract foreign capital. Similarly,MNEs bring with them the fruits of efficient marketing and management know-how, advanced physical equipment, R&D, as well as other assets across na- tional borders. The technology and research will result in more sophistication as well as diversifica-
tion in exports and production through the spillover effect on domestic industries.
Hameed Khan, Muhammad Asif Khan, Masood Ahmed, József Popp and Judit Oláh / Montenegrin Journal of Economics, Vol. 17, No. 2 (2021), 121-134
133 Since firms can purchase their inputs at competitive prices, therefore, cost-based strategy in export markets is important. In this regard, policies should be adopted to foster competition in the input markets. Moreover, policies should be well in-place that allow the firms for vertical and hori- zontal differentiation of products and attenuate the negative effects of higher export prices on ex- port revenues.
This study is not the only explanation of the determinants of export diversification and FDI.
Other factors may also influence FDI and export diversification. The other factors may consist of macroeconomic stability, efficiency-seeking, market seeking, infrastructure, trade openness, tech- nology, and human capital. This study aimed to highlight the importance of export diversification and FDI, which are the key drivers for the economy to achieve a comparative edge in the globalized world and builds the investors’ confidence. The study is limited to the aggregate FDI. For in-depth analysis and policy implications, future research should be conducted to investigate the relation- ship between FDI and export diversification on provincial and sectoral levels.
References
Banga, R. (2006), “The export-diversifying impact of Japanese and US foreign direct investments in the Indian manufacturing sector”, Journal of International Business Studies, Vol. 37, No. 4, pp. 558–568.
Dai, P. Van, Delpachitra, S. Cottrell, S. (2017), “Real exchange rate and economic growth in east asian countries: The role of financial integration”, Singapore Economic Review, Vol. 62, No. 1, pp. 163–177.
Donaubauer, J., Meyer, B.E., Nunnenkamp, P. (2016), “A New Global Index of Infrastructure:
Construction, Rankings and Applications”, World Economy, Vol. 39, No. 2, pp. 236–259.
Ekholm, K., Forslid, R., Markusen, J.R. (2007), “Export-platform foreign direct investment”, Journal of the European Economic Association, Vol. 5, No. 4, pp. 776–795.
Guadalupe, M., Kuzmina, O. and Thomas, C. (2012), “Innovation and foreign ownership”, American Economic Review, Vol. 102, No. 7, pp. 3594–3627.
Harrison, A., Rodríguez-Clare, A. (2010), “Trade, foreign investment, and industrial policy for developing countries”, Handbook of Development Economics, Vol. 5, No. C, pp. 4039–4214.
Hausmann, R., Hidalgo, C.A., Bustos, S., Coscia, M., Simoes, A., Yildirim, M.A. (2019), The Atlas of Economic Complexity, The Atlas of Economic Complexity, available at:https://doi.org/
10.7551/mitpress/9647.001.0001.
Islam, M.A., Khan, M.A., Popp, J., Sroka, W., Oláh, J. (2020), “Financial Development and Foreign Direct Investment—The Moderating Role of Quality Institutions”, Sustainability, Vol. 12, No. 9, p. 3556.
Javorcik, B.S. (2008), “Can survey evidence shed light on spillovers from foreign direct investment?”, World Bank Research Observer, Vol. 23, No. 2, pp. 139–159.
Kabaklari, E., Duran, M.S., Üçler, Y. (2018), “Hgh-technology exports and economic growth: Panel data analysis for selected OECD countries”, Forum Scientiae Oeconomia, Vol. 6, No. 2, pp.
47–60.
Khan, M.A., Khan, M.A., Abdulahi, M.E., Liaqat, I., Shah, S.S.H. (2019), “Institutional quality and financial development: The United States perspective”, Journal of Multinational Financial Management, Vol. 49, pp. 67–80.
Khan, M.A., Khan, M.A., Ali, K., Popp, J., Oláh, J. (2020), “Natural Resource Rent and Finance: The Moderation Role of Institutions”, Sustainability, Vol. 12, No. 9, pp. 3897-????.
Krugman, P. (1980), “Scale economies, product differentiation, and the pattern of trade.”, American Economic Review, Vol. 70, No. 5, pp. 950–959.
Maier, D., Maftei, M., Maier, A., Bitan, G.E. (2019), “A Review of Product Innovation Management Literature in the Context of Organization Sustainable Development”, Amfiteatru Economic, Vol. 21, No. Special 13, pp. 816- ???.