The final version of this paper was published in
International Journal of Production Economics Vol. 131, No. 1, pp. 215-223 (2011)
http://dx.doi.org/10.1016/j.ijpe.2010.11.003
Labour productivity change: drivers, business impact and macroeconomic moderators
Krisztina Demeter1, Attila Chikán and Zsolt Matyusz
Corvinus University of Budapest, Fıvám tér 8., Budapest, H-1093, Hungary
Abstract
This paper focuses on the operational drivers of labour productivity changes. We consider two sets of drivers: a) current working practices b) changes in working practices through management programs.
The relationship between these two sets of drivers and productivity changes are analysed. We also investigate the importance of productivity growth by looking at the impact of labour productivity changes on business performance changes. Finally, the moderating effects of industry and country on the use of drivers of productivity changes are examined. Data from an international survey, IMSS-IV, are used for the analysis.
Keywords: labour productivity, business performance, industry, national context
Introduction
Productivity is a key performance indicator in all levels of the economy, from the shop floor through business enterprises to the national economy. In the most general terms, it measures output relative to input. It is a core factor of economic growth (OECD, 2001) and an enabler of ensuring strategic advantage (Porter, 1980).
Irrespective of the importance of productivity at both the macro and the micro level, there are very few studies that approach it from an operational perspective (Wacker et al. 2006, Neely, 2005). Because macro productivity is logically kind of an aggregate measure of micro productivity, there is a natural need to understand the relationship between the two.
To achieve this understanding, we believe that an important step can be made if we study those productivity drivers, which influence micro- (firm-) level productivity. According to our view, the most important drivers can be found at the operational level.
If we want to explain the relationships between various levels of productivity, we have to disclose very complex causes and effects. In this paper, we have chosen to study the following issues:
• What are the drivers of productivity at the operational level?
• What is the influence of labour productivity growth on company-level business success?
• How do industry- and country-specific factors influence the effectiveness of various productivity drivers?
Literature review
There are several input resources in a transformation process: labour (at different levels of skills and experience) work on materials; machines operate unattended or facilitate labour’s work; and they use energy, information, and other services to produce outputs. Among the types of input resources (labour, capital and intermediate, see OECD, 2001) labour
1 Corresponding author: Krisztina Demeter, e-mail: krisztina.demeter@uni-corvinus.hu; phone: +36-14825824;
fax: +36-14825567
productivity plays a particular role. Although the level of capital invested in businesses has increased heavily in the last decades, first in the US and later in other industrialised countries, like Germany or Japan (Van Ark – Pilat, 1993), labour productivity shows even more dynamics. From our point of view, it is particularly important that labour productivity growth absorbs a large part of capital productivity growth. A good example is the high impact of ICT investments on labour productivity growth (Pilat et al., 2002; Brynjolfsson – Hitt, 2003). Gust and Marguez (2004) examined international macro data to discover relationships between productivity growth and other measures. As they conclude, the more intense use of information technology and a less regulated labour market can lead to higher increase in productivity growth. The OECD productivity book says (OECD, 2001) that although capital productivity can be measured separately, labour productivity measures incorporate some effects of capital productivity. Others also call attention to the strong relationship between total factor productivity and labour productivity (Bartelsman et al., 2009). Based on these results, we focus our attention exclusively on labour productivity.
As for the relationship between the various levels of labour productivity that we wish to examine (operational, business, macro), we have found the following in the literature:
a.) There are some papers that analyse the micro sources of labour productivity change, or even productivity change in general, in the operations management literature (Wacker, 2006;
Hayes – Clark, 1986; Haasen, 1996; Gunasekaran et al., 1994; Siebers et al., 2008). Although there are some elements investigated in greater detail, their total contribution to labour productivity has not yet been researched. For example, the effect of team size, the incentive system, including wages and other payments (Conti, 2005; FitzRoy – Kraft, 1995), training (Conti, 2005) and employee participation (Zwick 2004) come up as typical issues.
A previous study (Hoegl, 2005) found that a smaller team size increases productive capacity.
As the team size increases, individuals have less of an opportunity to contribute, and communication becomes more complex. Although Hoegl could not identify an optimal size, his results show that more than ten people in a group is definitely less productive than smaller teams. Tohidi and Tarokh (2006) performed quantitative analysis on this issue and supported the idea of smaller teams. However, they added that technological improvements (e.g., the more intense use of ICT, which improves communication) can result in larger, still-productive teams.
The evergreen statement that we do what we measure is true for productivity, as well.
Petersen and Snartland (2004) examined 6.000 establishments and 165.000 employees in Norway. They found that the piece-rate wage system increases productivity by 29% as compared with time-based systems. However, as Millea and Fuess Jr. (2005) pointed out, piece-rate systems or other rewards can be paid not only for existing productivity gains but also as an incentive to improve labour efficiency. They showed that “pay is both driven by productivity and drives productivity in US manufacturing” (p. 803).
There are other not directly human-related programs at the operational level, however, that can drive labour productivity (Siebers et al., 2008). These programs usually target operational issues, which directly or indirectly also affect how workers have to move, work or think, all of which can influence their productivity.
For example, lean production – with U-shaped streamlined cells, pull production, fewer levels in organisational hierarchy, higher worker autonomy, worker involvement in problem solving and through suggestions systems – can be an important source of labour productivity growth (Crawford et al., 1988; Cua et al., 2001). It improves the way of work and the information flows, as well as direct human matters.
Similar things can be told about quality programs. Total quality management, continuous improvement programs build on worker involvement and on their ideas to improve the way of
work as well as applied resources. Although these programs primarily focus on quality, their side effect on labour productivity through better processes, resources and systems as well as through higher worker motivation can be dramatic (Siebers et al., 2008).
And as we already discussed, technology developments, such as automation and IT developments, can also have a positive impact on labour productivity (Pilat et al., 2002; and Brynjolfsson – Hitt, 2003).
There are papers that seek explanations for productivity differences through case studies.
Hayes and Clark (1986) compared 12 factories in three companies. They identified the following factors that affect total factor productivity the most: i) capital investment (connected with labour learning), ii) waste reduction (due to less rejects), iii) reduction of work-in-process (due to faster product cycle times, or faster feedback about product failures) and iv) the reduction of confusion stemming from i-iii. These results can be easily connected to the manufacturing programs, such as technology development, lean production or quality improvement programs.
b.) The relationship between labour productivity growth and business growth is less clear (Siebers et al., 2008). As total productivity growth means the use of fewer inputs compared to output, theoretically it can be an important factor in change in business success. We assume that labour productivity might be also a good predictor of business growth and leads to success in the long run. This is supported by Haltiwanger et al. (2008) who directly compared revenue-based productivity measures with measures of physical efficiency and found that they are highly correlated. This allows us to investigate the relationship between productivity and the business performance of the company.
However, we cannot forget that an increase in internal productivity is only one side of business success. The other side is that how customers think about products might overrate the effect of productivity achievements. It is enough to think about the effect of the economic world crisis: we can be very productive and competitive if customers do not have money to pay for products or simply do not need it. Therefore, even if the productivity gains are clear, for example when implementing a lean program, its impact on business-level performance is fuzzy (Demeter et al., 2009). Nevertheless, depending on how some contingency factors (e.g.
market dynamics, size, resource flexibility) work out, the relationship between productivity and business performance exits.
c.) Labour productivity can depend on several contingency factors; we will address country and industry effects here.
Bartelsman et al. (2009) showed significant cross-country differences in firm characteristics.
The average size of firms, for example, varied widely across sectors and countries. They found that new entrants in high-technology industries have a stronger contribution to productivity growth than new entrants in low-technology industries, leading to industrial differences between any observed countries. Nonetheless the authors also found that the differences between these two groups (firms in high-tech vs. low-tech industries) vary even more significantly across countries.
Following this line of thought, there are several international surveys that aim to compare operations management practices and strategies in various countries. Among them, Wacker et al. (2006) studied productivity issues in 16 countries and found that the productivity of resources varies. In some countries, production labour was the most productive resource, whereas in others, non-production labour or capital was. It shows that the drivers of productivity can be very different in various countries.
An important question is what kind of industries we investigate. In Wacker et al. (2006), the small machine tool and non-fashion textile industries were used for the analysis, and researchers did not find significant differences between industries. Whybark (1997) also drew
the conclusion that in the production area, country differences seem to be greater than industrial ones. He used the same classification of industries as Wacker (small machine tool and non-fashion textile) to make his statement. According to Pagell et al. (2005), national culture is an important predictive factor of labour productivity. They examined how national culture (for example uncertainty avoidance or individuality, see Hofstede, 1980) affects some typical operations decisions, such as supplier per parts, or ratio of export. Based on these results country-wise differences seem to be more important than industry-wise differences.
The problem and the research model
Business productivity has always been in the forefront of interest from both a macro and a micro point of view, as can be seen from the above literature review. However, this interest has been greatly inherited by the spread of the concept of competitiveness. While productivity was previously a kind of “internal” matter of an economy or a firm and was examined first as part of the profitability measures, it has become one of the central factors of comparison of the performance of competitors under the ever-increasing competition of the end of the 20th century. Competitiveness became a keyword in government offices, boardrooms and job shops alike, and productivity appeared as a main enabler of achieving long-term competitiveness.
This well-known fact of a relationship between productivity and competitiveness has increased interest in exploring the relationship of productivity at different levels of the economy. As can be tracked in the literature cited above, the productivity of higher levels is mostly measured by the aggregates of productivity of lower entities: macro productivity comes from firm productivity, and firm productivity can be derived from process productivity within the firm, of course always considering the effects of both the entity-wise and the structural changes.
In this paper, we address this issue from the lowest level: we examine how starting out from operational level characteristics one can draw conclusions regarding business and country- level productivity. This bottom-up approach is rather novel, and we hope it leads to interesting conclusions.
Based on the literature review and the above reasoning, we formulate the following hypotheses:
H1: The impact of implemented operations improvement programs on labour productivity change is greater than the impact of actual working practices.
H2: Higher labour productivity change on the operational level leads to increased company- level business performance.
H3: Industrial effects influence the effectiveness of labour productivity change drivers to a lesser extent than country-specific effects.
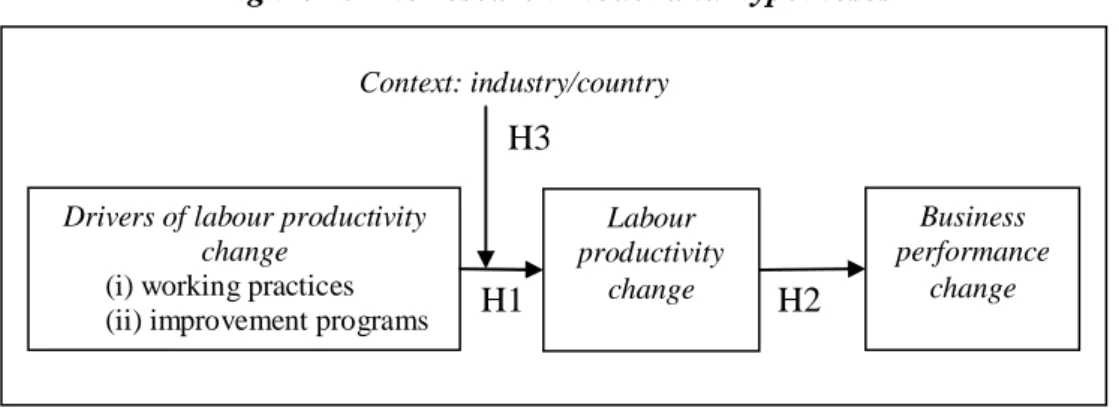
According to our research model (Figure 1), we first (H1) examine (i) actual working practices and (ii) implemented operations improvement programs as drivers of labour productivity change. Next, the relationship between labour productivity change and business performance change is analysed (H2). Finally, the context is examined to see to what extent the industry and/or the country (cultural, social, legal environment) affects (or more precisely related to) the drivers of labour productivity change. (H3).
Figure 1: The research model and hypotheses
H2 H1
Drivers of labour productivity change
(i) working practices (ii) improvement programs
Context: industry/country
Business performance
change H3
Labour productivity
change
Survey data
We used IMSS (International Manufacturing Strategy Survey) data for our analyses. IMSS is a global network of researchers with the objective of studying international manufacturing strategies, their implementation and resulting performances in operations and related areas, such as supply chain management and new product development. IMSS was initiated by Chris Voss (London Business School, UK) and Per Lindberg (Chalmers University of Technology, Sweden) in 1992. Since that time, four rounds of the survey have been completed.
IMSS data are collected by national research groups using a standard questionnaire developed by a panel of experts, exploiting the previous editions of the research. The questionnaire is translated, if needed, to local languages by OM professors. Although there is a suggested method of collecting data (focus on better companies, search companies by mail and/or phone, send out the questionnaire to contact person, one per company, usually a plant or manufacturing manager in printed form, follow up to help and inspire the contact person to fill in the questionnaire), it is up to the national research team to make decisions on this procedure. However, research teams have to provide data about the sampling procedure to the global network.
For further details of the survey, see the summary book of IMSS-I (Lindberg et al., 1998) or some articles which used previous rounds of the survey (e.g., Frohlich and Westbrook, 2001; Acur et. al., 2003; Husseini and O’Brien, 2004; Laugen et al., 2005, Cagliano et al., 2006).
The IMSS-IV data bank, the one that we use in this paper, extends to 711 valid observations from 23 countries (mainly from Europe but also from all other continents but Africa) for the time period between 2005 February and 2006 March. Altogether, we sent out questionnaires to 4251 companies which means a response rate of 17% on valid answers.
In our paper, we use the data of 12 countries, where the number of observations is 30 or above. Table 1 contains the structure of the data.
Table 1.: Distribution of companies by country and industry
Industry ISIC code Country Metal Machine Office
Elec- tronic
Communi- cation
Ins- trument
Auto- motive
other vehicle
Mis- sing Total
(28) (29) (30) (31) (32) (33) (34) (35)
Argentina 24 6 1 5 1 1 5 1 0 44
Belgium 16 4 0 4 4 0 1 3 0 32
China 7 10 2 13 2 1 3 0 0 38
Denmark 10 8 1 7 2 5 1 1 1 36
Hungary 22 9 0 4 6 1 9 3 0 54
Italy 8 19 0 4 7 1 2 4 0 45
New Zealand 12 13 0 4 0 0 0 1 0 30
The Netherlands 20 13 4 13 0 5 3 5 0 63
Sweden 26 20 0 9 4 5 12 5 1 82
Turkey 5 13 0 2 1 0 9 5 0 35
USA 13 0 3 1 1 2 4 8 4 36
Venezuela 20 0 0 3 0 0 6 0 1 30
Total 183 115 11 69 28 21 55 36 7 525
Operationalisation
Two sets of variables were used to find the drivers of labour productivity change. One group of variables relates to everyday working practices, such as team size, multi-skilling, training, incentives, suggestion systems, and autonomy. The other group contains management programs implemented in the last three years to improve manufacturing performance (1-5 Likert scale). This latter group involves wider operational programs, which have an impact on how people work. Examples are streamlining, pull production, various quality programs, the use of IT and automation, and human-related programs. The full list of questions can be found in Appendix 1. Certainly, the two groups are not independent of each other. While management programs are usually for initiating change in operating systems, everyday working practices are the results of implemented programs. Therefore, management programs are more dynamic in nature.
We measured labour productivity change by comparing the current performance to that of three years ago. A five-point scale was used with the following content: 1 = deteriorated more than 10%; 2 = stayed about the same; 3 = improved by 10-30%; 4 = improved by 30-50%; 5 = improved by more than 50%.
Four variables were used for measuring business performance change: change in gross output, market share, return on sales, (ROS) and return on investment (ROI). The scale in each case was the same as for labour productivity change (see above).
Analysis and discussion
Drivers of labour productivity change
To find the drivers of labour productivity, we divided the sample into three groups on the basis of labour productivity change. Group 1 includes companies where managers reported more than 10% decrease or the same level of labour productivity in the last three years (1 or 2 on the scale). Group 2 contains companies where the change of labour productivity has moderately increased (score of 3). Group 3 consists of companies with high level of labour productivity change (4 or 5 scores). We compared the effects of everyday working practices (Appendix 2) and management programs (Appendix 3) on labour productivity for Group 1 and 3 (called low and high productivity companies).
The more intense use of teamwork (both functional and cross-functional), the higher level of training and the higher self-dependence are characteristic in dynamically improving (high productivity change) companies. Each of these practices refers to the higher autonomy and motivation of people who have the required knowledge. People want and are allowed and able to make changes to improve their own performance.
The rest of the working practices – workers involvement through suggestions, the use of incentives, multi-skilled workers and rotation – are not significantly different between the two groups. It can mean that these practices are not so important in increasing productivity or that they are not used heavily enough to have the same level of impact as former practices.
Suggestion systems as a part of lean management are difficult to implement in some countries (and in some companies) where the culture is very different from that in Japan. Also, incentives can have different effects on workers. They are negatively correlated with productivity change in the US (–0.382, p = 0.034), which means that it actually counters increases in productivity. Workers might understood that if they fasten their pace than next time that the faster pace would be the standard, leading them to have to work harder than ever to reach the same bonus. Hungarian data are also not very far from being significant, but the use of incentives seems to have a positive effect on productivity there. As the living standard is relatively low compared to developed countries, people can be motivated to work better if they can earn more. Anyway, the opposite directions of the US and Hungary findings suggest that the various practices can evoke quite different reactions from people. It also supports the remark by Millea and Fuess Jr. (2005): incentives seem to be the result of productivity in the US, while they can be the drivers of productivity in Hungary.
Looking at management programs, the use of all but one program, technological integration, is significantly more characteristic for the high-productivity group. It means that companies usually use several management programs in parallel. If they try one program, they become hungry to implement other programs, and they have more and more knowledge on how to implement them.
The large differences between almost each management program between the two groups also mean that programs targeting changes can increase productivity more radically than the usual working practices themselves. On the one hand, this can be explained by considering that while working practices are established characteristics of companies, management programs cause more dynamic effects. Therefore, the former can have great influence on the level of productivity, while its change, which we examine, can be caused more by the latter. The method of work (static view, what we have now) is thus less relevant in higher productivity change than the management programs or changes themselves (dynamic view). The current method of work, even if it includes such practices as continuous improvement, can result in minor, incremental improvements. A radical increase in productivity usually requires more radical changes in everyday working practices.
On the other hand, another explanation can also be valid. Operations improvement programs, due to their more complex effect on workers’ work, such as the resources, the materials, the machines, the information they use, the different approaches they follow can impact labour productivity more than human-related programs alone. The changing conditions can motivate workers and lead to increased productivity. And if one change is followed by the next very soon, people learn that nothing is more stable than the change itself: their organisational resistance against change is reduced, and program implementations can be more successful.
On the basis of our results we can accept Hypothesis 1: the impact of management program implementations on labour productivity is larger than using up-to-date working practices.
Relationship between labour productivity change and business performance change
Productivity is an important factor of business success. If the amount of inputs decreases for the same level of output, that can mean a reduction in cost levels (if wages remain stable or increase more slowly than productivity). This automatically leads to a profit increase.
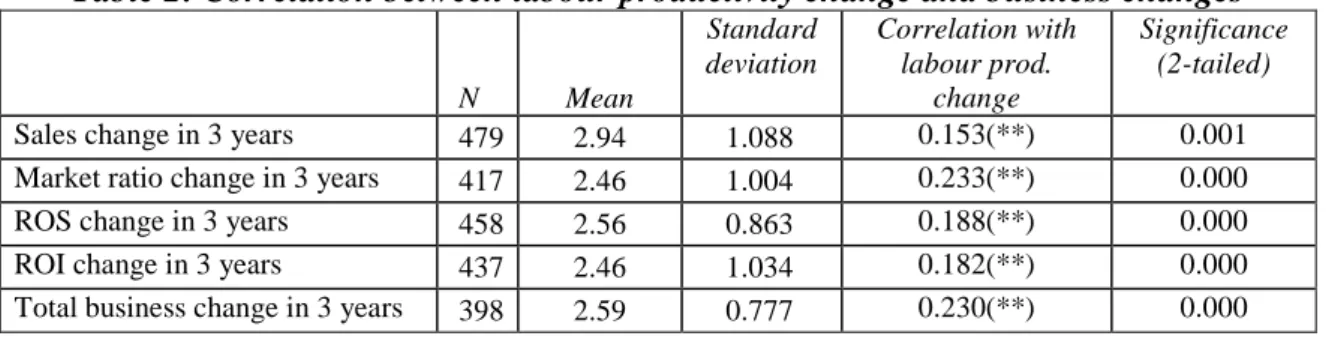
Looking at the data (Table 2), we can see highly significant correlations between labour productivity changes and business performance changes. Companies with higher labour productivity could increase their business success as measured by sales, market share, ROS or ROI, or, alternatively, successful companies could invest in increasing labour productivity.
Consequently, the relation between business performance improvement and labour
productivity is more direct than the relationship between lean management and business performance (Demeter et al., 2009). The results can be seen in Table 3.
Table 2: Correlation between labour productivity change and business changes
N Mean
Standard deviation
Correlation with labour prod.
change
Significance (2-tailed)
Sales change in 3 years 479 2.94 1.088 0.153(**) 0.001
Market ratio change in 3 years 417 2.46 1.004 0.233(**) 0.000
ROS change in 3 years 458 2.56 0.863 0.188(**) 0.000
ROI change in 3 years 437 2.46 1.034 0.182(**) 0.000
Total business change in 3 years 398 2.59 0.777 0.230(**) 0.000
** Correlation is significant at the 0.01 level (2-tailed).
Table 3: Business change statistics (1-5 scale)1
Low productivity High productivity
N Mean N Mean F
Sign.
(p) Labour productivity change in 3 years 140 1.94 102 4.12 3546.77 0.000
Sales change in 3 years 131 2.78 91 3.26 9.85 0.002
Market share change in 3 years 124 2.33 86 2.97 28.28 0.000
ROS change in 3 years 122 2.15 85 2.69 15.70 0.000
ROI change in 3 years 114 2.17 81 2.72 14.97 0.000
Total business change in 3 years2 111 2.34 76 2.86 22.38 0.000
1 Meaning of scale: 1= deteriorated more than 10%; 2 = stayed about the same; 3= improved 10%-30%;
4 = improved 30%-50%; 5 = improved more than 50%
2 The „Total business change in 3 years” variable was created by taking average of the sales, market share, ROS, ROI changes for each company.
The most significant correlation is with the market share change, which suggests that labour productivity can provide an important source of market competitiveness, probably through price reductions. However, there might be an opposite relation as well: increased market share requires higher productivity from labour to satisfy the increased demand. Furthermore, larger volumes can have a positive impact on labour productivity through scale economies.
Each measures of business success change have high correlation, but they reflect different angles of company performances. We made a composite index of the four measures by calculating their average. (Cronbach’s alpha is 0.79 for the four variables.) The correlation of this index with labour productivity is significant (see the last row in Table 2). Therefore, we can accept Hypothesis 2, that change in labour productivity is closely and positively related to change in business performance.
Country-wise and industry-wise differences
We used multidimensional scaling to see how country- and industry-wise differences are related to one another. Due to the complexity of the procedure and the overall results we obtained before for the relationship between labour productivity growth and its drivers, we focused our attention only on management programs.
Multidimensional scaling is an explorative statistical tool. The main assumption behind the tool is the idea that every observation has an exact set of coordinates in space and more similar observations are closer to each other. When we use multidimensional scaling, we do not have to build a model or assume a causal relationship or test a hypothesis. We use the
distances between the observations to create a map of them in a reduced space (usually in two or three dimensions) to reveal their hidden structure. The aim is similar to the objective of principal component analysis (Cox and Cox, 1994).
In our paper, we mapped the differences among countries and industries in two dimensions.
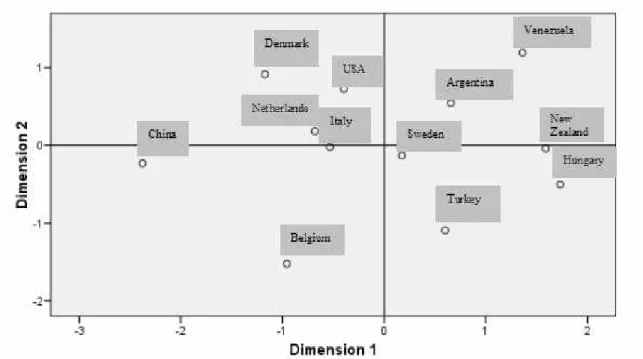
Our objective was to identify which contingency factor causes larger differences in the efficiency of labour productivity drivers. As a starting point, we used the correlation matrices (see Appendices 4 and 5). In case of the countries, separately for each country we calculated the correlations between labour productivity change and each management program. Our data matrix consisted of these country-specific correlations (i.e., in the rows, we had the countries, and, in the columns, the countries). Next, we used multidimensional scaling (ALSCAL method) with SPSS. The procedure was the same for industries. Figure 2 shows the result for the countries. The S-stress value is 0.1855, which represents an acceptable fit (values under 0.2 are acceptable). The RSQ (squared correlation) value is 0.82, which means that the resulting 2D map in Figure 2 explains 82% of the initial distances between the countries.
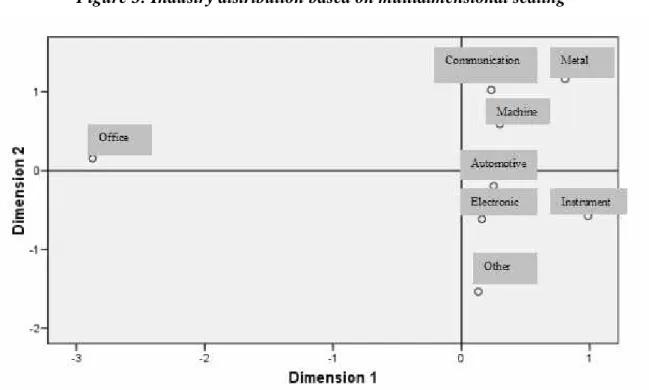
According to the map, the countries are distributed more or less evenly along the two dimensions. Unfortunately, the multidimensional scaling does not tell us the exact meanings of the dimensions. The researcher has to figure them out by investigating the initial data thoroughly, but now we are just focusing on the distribution of the countries and the industries. Figure 3 shows the result for the industries. The S-stress value is 0.1451, which indicates an acceptable fit. The RSQ (squared correlation) value is 0.919; that is, the resulting 2D-map in Figure 3 explains 92% of the initial distances between the countries. According to the map, the industries are grouped together more tightly and are primarily different from each other along Dimension 2. The only exception is the Office industry, which lies far away from the others along Dimension 1.
The distribution of countries and industries on the 2D maps is the first indirect evidence that country-wise differences are greater than industry-wise differences. Countries are spreading all over the four quadrants, while industries can be found in only two quadrants, if we do not count the outlier, the Office industry. A second indirect evidence comes from the values of the coordinates. If we compare the mean absolute values of both dimensions for countries and industries (i.e., if we sum up all the absolute values of the coordinates and calculate their average), we find that in the case of the countries the mean absolute value is 0.764. This value in the case of the industries is 0.724 (which drops to 0.535 without the Office industry).
This also implies that industries are less scattered along the two dimensions than countries are, which indicates that differences among industries are smaller than among countries.
We made some further analysis to uncover the reasons behind the differences and it seemed natural to start with the Office industry. We analysed the correlation matrix that served as the starting point for multidimensional scaling by focusing on correlations that are 1) quite strong, and 2) these correlations in the Office industry between labour productivity change and certain management programs are stronger than the same correlations in other industries. (We have to add here that the low number of observations in this industry resulted in no significant correlations between various programs and labour productivity change.) According to these criteria, the Office industry differs from the other industries in the following: i) process focus (r=-0.538; all other industrial correlations are positive); ii) machine productivity (r=0.724; the second strongest correlation is r = 0.344 in the Automotive industry); iii) automation (r=0.567; the second strongest correlation is r = 0.254 in the Electronic industry); iv) delegation and training (r=0.682, the second strongest correlation is r = 0.263 in the Electronic industry); v) continuous improvement (r=0.750, the second strongest correlation is r = 0.543 in the Other vehicle industry). This means that for the Office industry, machine productivity, automation, delegation and continuous improvement are much more important than other management programs as drivers of productivity improvement. This also means
that Dimension 1 on Figure 3 can be interpreted as a technology-improvement axis. The Office industry clearly stands out in terms of technology and improvement, while the other industries are much more similar to each other in this respect. This finding is in line with the results of Girma and Görg (2006). They decomposed the productivity advantage of foreign multinationals into two components, the technology and scale effect, and they investigated several industries. In case of the office machinery and data processing equipment sector (which is analogous to our office, accounting and computing machinery industry), they observed significant average productivity growth over time, where technical progress was responsible for the majority of this growth.
These results support Hypothesis 3 and give additional support to previous studies made by Bartelsman et al. (2009), Wacker et al (2006) or Whybark (1997). We have to add, though, that more rigorous statistical methods are needed to see whether these differences are significant between countries and industries, which, given the limitations of this paper, should be part of further research. If these differences happen to be significant, an interesting research topic could be also the investigation of the exact nature of the differences among countries and industries.
Figure 2: Country distribution based on multidimensional scaling
Figure 3: Industry distribution based on multidimensional scaling
Conclusions
Our research was based on the hypothesis that operations-level characteristics have a significant effect on labour productivity changes, which influence business success. Also, we assumed that these effects can differ by country and by industry. We found rather scarce literature both on the subject of relationship between productivity at various levels of the economy and on the differences that the environment of operations (industry-specific and country-specific ones) brings to productivity growth. We used the International Manufacturing Strategy Survey questionnaire data for the analysis.
The following main conclusions result from our analysis:
- There is a far higher correlation between management programs (programs that change the way or method of working) and productivity growth than between the latter and everyday working practices. This can be explained by the more dynamic influence of management programs. It also means that if companies have already applied the majority of modern working practices and achieved great results in the beginning, their productivity improvement necessarily slows down later if they do not make another radical and successful change.
- There is a high degree of correlation between labour productivity change and business performance change, measured by sales, market share, ROS, ROI or by a composite index of the four. It means that productivity usually can be a relevant source of business success.
- It is very general, and we believe the important conclusion that country differences in production practices are larger than industry differences. This calls attention to the limits of globalisation of production and the importance of differences in culture, habits and social circumstances.
The above results provide important lessons for both company executives and economic policy makers. It calls attention of the former to the importance of the continuous renewal of
efficiency by radical improvement: if they do not improve their OM processes, they can hardly maintain their competitive advantage in the long run. On the other hand, this innovation pays off; it is an important factor of business success. On the other hand, our analysis shows to economists and economic policy makers that, despite the sometimes overestimated global effects, country-wise success can be achieved by applying measures that correspond to national cultures and other local circumstances.
References
Acur, N. – Gertsen, F. – Sun, H. – Frick, J. (2003). The Formalisation of Manufacturing Strategy and Its Influence on the Relationship between Competitive Objectives, Improvement Goals, and Action Plans. International Journal of Operations Production Management, Vol. 23, No. 10, pp. 1114-1141.
Bartelsman, E. − Haltiwanger, J. − Scarpetta, S. (2009): Cross Country Differences in Productivity: The Role of Allocative Efficiency. DFH Working Paper, Department of Economics, University of Maryland, July, 2008
Brynjolfsson, E. − Hitt, L. M. (2003): Computing Productivity: Firm–Level Evidence. Review of Economics and Statistics, Vol. 85, No. 4, pp. 793-808.
Cagliano, R. – Caniato, F. – Spina, G. (2006): The linkage between supply chain integration and manufacturing improvement programs. International Journal of Operations and Production Management, Vol. 26, No. 3, pp. 282-299.
Conti, G. (2005): Training, productivity and wages in Italy. Labour Economics, Vol. 12, pp.
557-576.
Cox, T. F. – Cox, M. A. A. (1994): Multidimensional scaling. Monographs on Statistics and Applied Probability 59. Chapman & Hall, London, UK
Crawford, K. M. – Blackstoe, J. H. – Cox, J. M. Jr. (1988): A study of JIT implementation and operating problems. International Journal of Production Research, Vol. 26, No.
9, pp. 1561-1568.
Cua, K.O. – McKone, K.E. – Schroeder, R.G. (2001): Relationships between implementation of TQM, JIT, and TPM and manufacturing performance. Journal of Operations Management, Vol. 19, No. 6, pp. 675–694.
Demeter, K. – Losonci, D. – Matyusz, Zs. (2009): Lean management and competitiveness – international empirical results, paper presented at EurOMA Annual Conference, 2009, Gothenburg
FitzRoy, F. R. – Kraft, K. (1995): On the choice of incentives in firms. Journal of Economic Behavior & Organization, Vol. 26, pp. 145-160.
Frohlich, M. T. – Westbrook, R. (2001): Arc of integration: an international study of supply chain strategies. Journal of Operations Management, Vol. 19, pp. 185-200.
Galindo-Ruerda, F. − Haskel, J. (2005): Skills, workforce characteristics and firm-level productivity. IZA Discussion paper, No. 1542.
Girma, S. – Görg, H. (2006): Multinationals’ productivity advantage: Scale or technology?
Economic Inquiry, Vol. 45, No. 2, pp. 350-362.
Gunasekaran, A. − Korukonda, A. R. − Virtanen, I. − Yli-Olli, P. (1994): Improving Productivity and Quality in Manufacturing Organization. International Journal of Production Economics, Vol. 36, No. 2, pp. 169-183.
Gust, C. – Marquez, J. (2004): International comparison of productivity growth: the role of information technology and regulatory practices. Labour Economics, Vol. 11, pp. 33- 58.
Haasen, A. (1996): Opel Eisenach GMBH – Creating a high-productivity workplace.
Organizational Dynamics, Spring, pp. 80-85.
Haltiwanger, J. C. − Foster, L. − Syverson, C. (2008): Reallocation, Firm Turnower and Efficiency: Selection on Productivity or Profitability? The American Economic Review, Vol. 98, No. 1, pp. 394-425.
Hayes, R. H. – Clark, K. B. (1986): Why some factories are more productive than others.
Harvard Business Review, September-October, pp. 66-73.
Hoegl, M. (2005): Smaller teams – better teamwork: How to keep project teams small.
Business Horizons, Vol. 48, pp. 209-214.
Hofstede, G. (1980): Culture’s Consequences: International Differences in Work-Related Values. Sage Publications, Beverly Hills, CA
Husseini, S. M. M. – O’Brien, C. (2004): Strategic Implications of manufacturing performance comparisons for newly industrialising countries. International Journal of Operations and Production Management, Vol. 24, No. 4, pp. 1126-1148.
Laugen, B. T. – Acur, N. – Boer, H. – Frick, J. (2005): Best manufacturing practices. What do the best-performing companies do? International Journal of Operations and Production Management, Vol. 25. No. 2, pp. 131-150.
Lindberg, P. – Voss, C. – Blackmon, K. (eds) (1998): International Manufacturing Strategies - Context, Content and Change, Kluwer Academic Publishers
Millea, M. – Fuess Jr., S. M. (2005): Does pay affect productivity or react to it? Examination of US manufacturing. The Quarterly Review of Economics and Finance, Vol. 45, pp.
796-807.
Neely, A. (2005): What has 25 years of P/OM research taught us about productivity? In:
Demeter, K.: Operations and Global Competitiveness, Proceedings of the 12th EurOMA conference, Budapest
OECD (2001): Measuring productivity: Measurement of aggregate and industry-level productivity growth, OECD Manual, www.SourceOECD.org
Pagell, M. – Katz, J. P. – Sheu, C. (2005): The importance of national culture in operations management research. International Journal of Operations and Production Management, Vol. 25, No. 3/4, pp. 371-394.
Petersen, T. – Snartland, V. (2004): Firms, wages, and incentives: incentive systems and their impact on wages, productivity and risks. Research in Social Stratification and Mobility, Vol. 21, pp. 253-286.
Pilat, D. – Lee, F. – van Ark, B. (2002): Production and use of ICT: A sectoral perspective on productivity growth in the OECD area. OECD Economic Studies, No. 35, 2002/2, pp.
47-78.
Porter, M. E. (1980): Competitive Strategy: Techniques for Analyzing Industries and Competitors, The Free Press, New York
Siebers, P-O. – Aickelin, U. – Battisti, G. – Celia, H. – Clegg, C. – Fu, X. – De Hoyos, R. – Iona, A. – Petrescu, A. – Peixoto, A. (2008): Enhancing productivity: the role of management practices. AIM Working Paper Series – 062 – February 2008
Tohidi, H. – Tarokh, M. J. (2006): Productivity outcomes of teamwork as an effect of information technology and team size. International Journal of Production Economics, Vol. 103, pp. 610-615.
Van Ark, B. – Pilat, D. (1993): Productivity levels in Germany, Japan, and the United States:
differences and causes. Brookings Papers: Microeconomics, Vol. 2, pp. 1-69.
Wacker, J. G. – Yang, C-L. – Sheu, C. (2006): Productivity of production labor, non- production labor, and capital: An international study. International Journal of Production Economics, Vol. 103, pp. 863-872.
Whybark, D. C. (1997): GMRG survey research in operations management. International Journal of Operations and Production Management, Vol. 17, No. 7, pp. 690-700.
Zwick, T. (2004): Employee participation and productivity. Labour Economics, Vol. 11, pp.
715-740.
Appendix 1: Questions used for the analysis:
Working practices
1. What proportion of your direct employees’ compensation is based on incentives? _ % of compensation 2. What proportion of your total work force work in teams?:
In functional teams _____ % In cross-functional teams ____ %
3. How many hours of training per year are given to regular workforce? __________ hours per employee 4. How many of your production workers do you consider to be multi-skilled? ______ % of total number
of production workers.
5. To what extent do employees give suggestions for product and process improvement (number of suggestions per employee per year, 1- no suggestion, 3-few, about five, 5-many, more than ten)?
6. How frequently do your production workers rotate between jobs or tasks? (1-never, 5-frequently) 7. To what extent is your workforce autonomous in performing tasks? (1-no autonomy, 5 - high)
Management programs
Indicate degree of the following action programs undertaken in the last three years: Effort in the last three years (1 – none, 5 – high)
1. Expanding manufacturing capacity
2. Restructuring manufacturing processes and layout to obtain process focus and streamlining 3. Undertaking actions to implement pull production
4. Undertaking programs for quality improvement and control
5. Undertaking programs for the improvement of your equipment productivity
6. Undertaking programs to improve environmental performance of processes and products
7. Increasing performance of product development and manufacturing through, e.g., platform design, standardisation and modularisation
8. Increasing the organisational integration between product development and manufacturing 9. Increasing the technological integration between product development and manufacturing 10. Engaging in process automation programs
11. Implementing Information and Communication Technologies and/or Enterprise Resource Planning software
12. Implementing actions to increase the level of delegation and knowledge of your workforce
13. Implementing the Lean Organisation Model by, e.g., reducing the number of levels and broadening the span of control.
14. Implementing Continuous Improvement Programs through systematic initiatives
15. Increasing the level of workforce flexibility following your business unit’s competitive strategy
Performance measures
How has your Sales/market share/ROI/ROS/labour productivity changed over the last three years? Compared to three years ago the indicator has
1 - deteriorated by more than 10%, 2 - stayed about the same -5%/+5%
3 - improved by 10%-30%
4 - improved by 30%-50%
5 - improved by more than 50%
Appendix 2: Use of working practices in low- and high-productivity groups
Low productivity High productivity
Working practices N Mean N Mean F
Significance (p)
Direct incentives (% of workers) 129 12.20 93 18.34 2.97 0.086
Functional teamwork (% of workers) 125 44.13 92 57.68 8.03 0.005
Cross-func. Teamwork (% of workers) 117 13.56 87 26.89 15.96 0.000
Hours of training/year 125 24.28 91 35.07 4.60 0.033
Multi-skilled (% of prod. Workers) 132 54.67 98 49.37 1.86 0.174
Worker suggestion (1-5)* 137 2.66 99 2.89 3.20 0.075
Rotation of prod. Workers (1-5)* 138 3.07 100 3.23 1.55 0.215
Self dependence (1-5)* 134 2.90 101 3.22 6.55 0.011
* Meaning of scale: 1= not characteristic, 5 = highly characteristic ** Significance level for SMEs within the low- versus high-productivity group
Appendix 3: Use of management programs in low- and high- productivity groups (1-5 scale)*
Low productivity High productivity
Management programs N Mean N Mean F
Sign.
(p)
Capacity expansion 138 2.99 99 3.57 15.08 0.000
Process focus 137 3.01 99 3.66 18.81 0.000
Pull production 136 2.54 98 3.33 28.68 0.000
Quality programs 136 2.82 101 3.43 20.32 0.000
Machine productivity 136 2.46 101 3.38 54.56 0.000
Environment 134 2.39 97 3.15 22.77 0.000
Product development improvement 135 2.81 99 3.17 7.59 0.006
Organizational integration 135 2.68 99 3.09 9.51 0.002
Technological integration 134 2.96 99 3.23 3.59 0.059
Automation 135 2.46 98 2.93 10.47 0.001
ICT and/or ERP 133 2.94 99 3.28 4.90 0.028
Delegation and training 136 2.70 101 3.00 5.77 0.017
Lean model 137 2.53 99 3.09 16.87 0.000
Continuous improvement 136 2.65 100 3.20 13.88 0.000
Worker flexibility 136 2.85 100 3.25 8.60 0.004
* Meaning of scale: 1= deteriorated more than 10%; 2 = stayed about the same; 3= improved 10%-30%; 4 = improved 30%-50%; 5 = improved more than 50%
** Significance level for SMEs within the low- versus high- productivity group
Appendix 4: Correlations between labour productivity and management programs by country (grey cells are significant at p = 0.05 level)*
Management programs Arg Bel Chi Den Hun Ita N Z Net Swe Tur USA Ven
Capacity expansion Correlation 0.141 0.166 0.183 0.472 0.022 0.032 0.068 0.331 -0.038 -0.276 0.342 0.231
Significance 0.400 0.419 0.324 0.013 0.901 0.859 0.774 0.015 0.769 0.147 0.081 0.301
Process focus Correlation 0.225 -0.035 0.199 0.465 -0.044 0.299 0.049 0.311 0.167 -0.069 0.079 0.431
Significance 0.175 0.864 0.284 0.015 0.804 0.091 0.837 0.022 0.191 0.723 0.693 0.045
Pull production Correlation -0.097 0.180 0.199 0.251 0.126 0.472 0.241 0.324 0.197 0.052 0.378 0.132
Significance 0.564 0.380 0.282 0.207 0.470 0.006 0.306 0.017 0.122 0.789 0.052 0.559
Quality programs Correlation 0.094 0.466 0.568 0290 0.016 -0.078 0.079 0.170 0.072 0.232 -0.194 -0.246
Significance 0.575 0.016 0.001 0.142 0.929 0.668 0.741 0.219 0.577 0.226 0.333 0.270
Machine productivity Correlation -0.124 0.100 0.568 0.376 0.039 0.088 0.168 0.375 0.281 0.181 0.287 0.157
Significance 0.423 0.628 0.001 0.053 0.823 0.627 0.478 0.005 0.026 0.349 0.146 0.485
Environment Correlation 0.312 -0.061 0.483 0.339 -0.073 0.185 0.451 0.389 -0.028 0.137 0.301 -0.132
Significance 0.056 0.766 0.006 0.083 0.679 0.303 0.046 0.004 0.830 0.479 0.127 0.557
Product development improv Correlation 0.002 0.441 0.370 -0.209 0.010 0.193 0.090 0.067 -0.035 -0.176 0.113 0.074
Significance 0.988 0.024 0.041 0.296 0.954 0.281 0.707 0.630 0.787 0.362 0.573 0.743
Organisational integration Correlation 0.295 0.210 0.491 -0.028 -0.111 0.186 -0.194 0.086 0.048 -0.044 0.302 0.325
Significance 0.072 0.304 0.005 0.888 0.527 0.301 0.413 0.535 0.708 0.820 0.126 0.140
Technological integration Correlation 0.118 0.206 0.025 0.133 -0.206 0.118 -0.350 0.251 0.024 0.055 0.129 0.093
Significance 0.479 0.313 0.894 0.509 0.236 0.513 0.130 0.067 0.853 0.775 0.520 0.679
Automation Correlation -0.093 0.475 0.364 0.319 -0.386 0.460 -0.148 0.224 0.218 0.115 0.004 -0.025
Significance 0.578 0.014 0.044 0.105 0.022 0.007 0.535 0.103 0.086 0.553 0.983 0.912
ICT and/or ERP Correlation 0.213 -0.077 0.226 -0.207 -0.071 -0.009 -0.095 0.112 -0.031 0.146 0.129 0.123
Significance 0.198 0.707 0.222 0.300 0.687 0.961 0.691 0.418 0.808 0.451 0.520 0.586
Delegation and training Correlation 0.099 0.228 0.441 0.093 0.112 0.073 -0.266 0.219 -0.020 -0.085 0.281 -0.162
Significance 0.554 0.263 0.013 0.645 0.521 0.688 0.256 0.112 0.875 0.660 0.155 0.473
Lean model Correlation 0.057 0.192 0.183 0.277 0.158 0.180 0.095 0.113 0.152 0.350 0.085 -0.082
Significance 0.735 0.347 0.325 0.161 0.364 0.316 0.689 0.418 0.234 0.063 0.673 0.717
Continuous improvement Correlation 0.144 -0.191 0.326 0.341 -0.076 0.124 0.083 0.112 0.164 0.087 0.291 -0.120
Significance 0.389 0.350 0.073 0.082 0.665 0.490 0.727 0.422 0.199 0.653 0.141 0.593
Worker flexibility Correlation -0.063 0.296 0.255 0.245 0.078 0.289 -0.058 0.221 0.166 0.217 0.273 -0.218
Significance 0.706 0.142 0.166 0.218 0.655 0.103 0809 0.108 0.194 0.259 0.168 0.329
* Correlations are controlled by industry and size (number of employees)