Conference on Modelling Fluid Flow (CMFF’18) The 17th International Conference on Fluid Flow Technologies Budapest, Hungary, September 4-7, 2018
C OOLING J ACKET D EVELOPMENT FOR E LECTRIC M OTORS USED IN
A LL ELECTRIC AIRCRAFT (AEA)
Szabolcs SANTA
1, Zoltan PETRO
2, Viktor SZENTE
3, Janos DOROGI
4, Gergely Gy. BALAZS
51 Corresponding Author. Student at Budapest University of Technology and Economics, Faculty of Mechanical Engineering, E-mail:
santaszabolcs13@gmail.com
2,4,5 Siemens Zrt., Gizella ut 4 – 6, 1143 Budapest, Hungary, E-mails: zoltan.petro@siemens.com, janos.dorogi@siemens.com, gergely.balazs@siemens.com
3 Department of Fluid Mechanics, Faculty of Mechanical Engineering, Budapest University of Technology and Economics. Bertalan Lajos u. 4 – 6, H-1111 Budapest, Hungary. Tel.: +36 1 463 3187, E-mail: szente@ara.bme.hu
ABSTRACT
Most modern airplanes are powered with IC engines because electrical propulsion was not feasible at the dawn of powered flight. It became viable only recently due to advancements made on electric propulsion systems.
Weight and space are key factors for airplanes.
Increasing the power density of the engine can enable the design of more efficient and more powerful planes. One way to achieve this is to increase the power level of the electric motor which also increases the power loss. In this case more efficient cooling is needed to remove the excess heat.
The aim of this paper is to determine the optimal cooling solution for the stator of a radial flux permanent magnet (PM) electric motor which is installed in an electric airplane. Computational fluid dynamics (CFD) is used for the comparison of the developed concepts and their sub-concepts. The results are detailed for every initial concept and then the three best designs are chosen for further optimisation.
Keywords: CFD, electric motor cooling, electric airplane, heat exchanger, water cooling, AEA NOMENCLATURE
m [kg] mass
T [°C] temperature Δp [bar] pressure difference Subscripts and Superscripts avg average
in inlet j jacket max maximum out outlet
w water
hs heat source js jacket outer surface 1. INTRODUCTION
Today it is not uncommon to see electric vehicles on the road and car companies are offering more electrical options to their customers. According to a study done in the US in 2015 [1], the cost of electrical vehicles (EV) were similar to economical petrol cars. This is mostly due to their higher purchase price. However electricity costs were 1/3 compared to fuel cost. This can also benefit aircrafts.
Smaller two seater planes that are used for shorter flights can use an electrical propulsion system (EPS).
Since aviation fuel can be twice the price of regular petrol [2], more electric aircraft (MEA) would be 5 times cheaper to operate. Swapping the engine of an older aircraft can drastically reduce purchasing costs, thus eliminating the least desirable part of EVs.
To be able to fit an electric motor into an airplane, higher power density is required. This can be achieved by various ways detailed in following studies [3,4]. According to the papers high power and speed result in more heat generation. This is due to larger copper and iron losses within the motor and could lead to the demagnetisation of the PM [5]. The dissipation of this heat is crucial for the reliable operation of the motor.
In this paper a number of cooling concepts are developed and tested for optimal performance. The study focuses on the water cooling of the stator part.
Different cooling channel geometries are developed and compared. Cooling performance and pressure loss are the most important parameters for the evaluation.
2. SIMULATIONS
The simulations were done with ANSYS Fluent v18.2. The input values are based on a theoretical worst case scenario at high power where electrical propulsion (EP) would still have to operate.
Total heat loss was obtained for a 55 kW electric motor. It is the sum of resistive loss, eddy current loss and magnetic hysteresis loss, within the motor’s stator. The simulations doesn’t ac-count for the internal heat transfer between motor components. A homogeneous heat flux was assumed on the contact surface between the winding core and the housing.
Heat radiation is completely neglected, but ambient air’s cooling ability is also considered in the study.
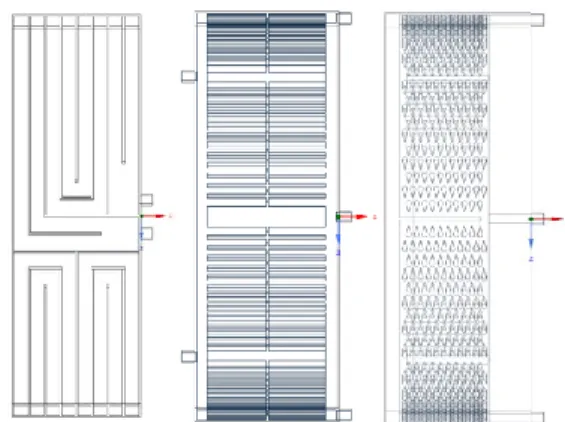
The CAD geometry of this motor, can be seen on Figure 1. It consists of the cooling jacket (transparent), water (blue), winding heads (grey and silver) and the copper winding (brown).
Figure 1. Modell of the stator part with the cooling jacket
2.1 Designs
This paper contains the concept research, where various designs are compared based on their overall performance. Later on further studies are planned for the refinement and optimization of the best geometries, which is not part of this paper. Designs are divided into main and sub concepts. These sub concepts can be applied to several main concepts which are fundamentally different from each other.
These will be detailed later.
The material of the coolant is liquid water and the material of the cooling jacket is aluminium.
2.1.1 Concept 1
The first design has one inlet and one outlet close to each other on the same side of the jacket as seen on Figure 5. Water goes around withdrawing heat continuously, so cooling is expected to be less efficient closer to the outlet. The interior was designed with a number of flow directing fins, so cooling would be more even along the length on the motor. Concept 1 was taken as a baseline for comparisons since it is a common solution, due to its
cheap manufacturing costs and robust design. It was also the basis for the sub-concept simulations since it was the most convenient to modify.
2.1.2 Concept 2
This design uses the same number of in-, outlets in the same arrangement as concept 1. However water is guided through the jacket in one channel separated with a thin wall for extra heat convection.
The streamline render of this can be seen on Figure 6.
Figure 2. Geometries of concept 2, 3, 5 from left to right
2.1.3 Concept 3
The idea behind this concept was to have an axial flow direction for a more even temperature distribution over the perimeter of the motor. For this, the inlet and outlet were placed on opposite sides of the cooling jacket. Flow restrictions were introduced in order to have similar volume flow between the cooling fins. The effects of these restrictions on pressure drop and fluid movement were tested in simulations, which will be detailed later.
Calculations determining the diameter of the flow restriction resulted in an unworkable value. In order to increase this, more in- and outlets were placed on the geometry. Four inlets on one side 90° from each other and four outlets similarly, but 45° offset from the inlets on the other side. The design has 8 wider fins in front of the connections to direct the flow in circumferential direction when it enters the jacket.
2.1.4 Concept 4
This design is a circumferential layout of concept 3. Instead of water flowing axially it goes around similarly to concept 1. Similarly, restrictors are used to achieve equal volume flow in the different channels. The effects of the restrictions were tested on this design.
2.1.5 Concept 5
There are a number of studies on pin fins both experimental and CFD [6-9]. Their positive effects on heat transfer efficiency are well known. The use
of pin fins raises the effective contact surface for heat transfer, but it also means that the wall friction loss will be greater thus pressure drop of the jacket will be higher. In paper [7] the relation between heat transfer and flow characteristics were studied. Their conclusion was that a drop shaped pin fin is more advantages to a circular or an elliptic one. Therefor concept 5 uses drop shaped pin fin in order to help with heat transfer. The geometry has four plate fins between the pins for flow direction change and better mixing. This design requires higher element number, because of the increased number of narrow spaces.
In order to reduce simulation time a symmetrical geometry was chosen. It has 2 inlets and 2 outlets 180° from each other on the same side as seen on Figure 11. For comparison a similar geometry concept 1 was also simulated as a sub-concept (Concept 1.2).
2.1.6 Concept 6
Weight and space are key factors. Concept 6 is a less conventional solution for cooling which reduces both the required space and the weight. It is inspired by a study done at the Karlsruhe Institute of Technology [10]. Empty space between the winding can be used to create cooling channels to directly cool the stator. A solution like this could replace the traditional cooling jacket. A thin cover could be used to reduce the diameter of the motor. Weight is also reduced to 1/3 of the original. A single inlet/outlet version of this design was tested and compared with the other concepts.
2.1.7 Sub-concepts of concept 1
As mentioned before all sub-concepts were created from concept 1. These modifications could be applied to many of the created designs, only one was modified and tested.
Sub-concepts modifications include:
Number of in/outlets
Position of in/outlets
Axial length of the cooling channel
Number of fins, pins or cooling channels For this study certain configurations were chosen for simulation. Special attention was paid to inlet and outlet placement. Three different geometries were made to test the effects of water connection configurations. First connections were placed as far apart from each other as possible (Concept 1.1), a more equal temperature distribution was expected. Secondly by splitting the water loop before, and combining it after the cooling jacket the number of in/outlet were increased (Concepts 1.2, 1.3). This was expected to reduce pressure drop significantly. To make sense, it would also require the analysis of the losses on the splitter, which cannot be greater than the gains achieved on the jacket.
Lastly a shorter radial cooling length can reduce the
weight of the jacket (Concept 1.4), the contact surface for heat transfer is much narrower than the whole width of the jacket. Thus it would not affect the performance of the cooling. To fit the inlet and outlets on the desired places a second version of concept 1 was created with 15 fins instead of the original 11 (Concept 1.5)
2.2 Mesh
Considering the number of simulations needed, flexibility for re-meshing geometries with the same settings was important. With a big highly customized mesh, the element number and the simulation time would be lower, but changes to the geometry would be harder to adapt to. Since unstructured tetra mesh is the most flexible it was the best options for both domains. For the fluid part two advanced sizing functions were used. Proximity function set the minimum number of elements to 4 for narrow spaces, the other defined the number of elements around curvatures. For the solid only the proximity and a 1 cell thick mesh was used.
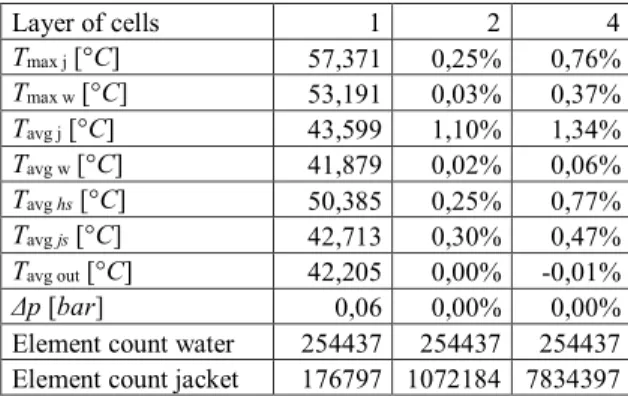
The accuracy of the solid domains meshing was verified by calculations with 2 and 4 cell thicknesses.
Table 1. shows the relative difference from the original case of 1 layer. It can be seen that the average jacket temperature has the biggest difference, 1%, while having almost 2 order of magnitude fewer elements. This study was done on concept 1.3.
Table 1. Results of the solid domain’s layer study
Layer of cells 1 2 4
Tmax j [°C] 57,371 0,25% 0,76%
Tmax w [°C] 53,191 0,03% 0,37%
Tavg j [°C] 43,599 1,10% 1,34%
Tavg w [°C] 41,879 0,02% 0,06%
Tavg hs [°C] 50,385 0,25% 0,77%
Tavg js [°C] 42,713 0,30% 0,47%
Tavg out [°C] 42,205 0,00% -0,01%
Δp [bar] 0,06 0,00% 0,00%
Element count water 254437 254437 254437 Element count jacket 176797 1072184 7834397 A mesh dependency study was also done on concept 1.3 to ensure effectiveness of the meshing.
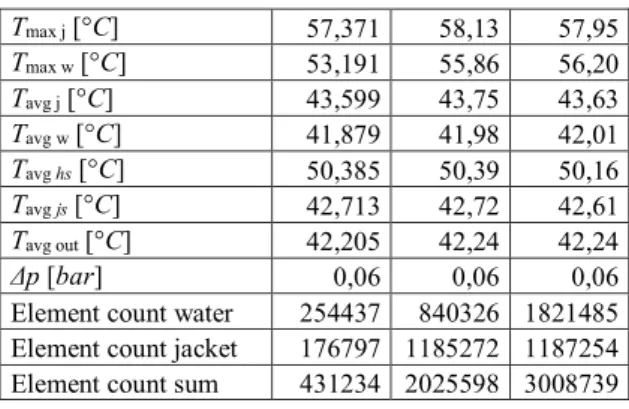
Since the previous results showed that the wall could be modelled as a 1 cell thin layer, this was mostly concentrated on the fluid part. The results can be seen in Table 2. Only maximum water temperature shows a 5% difference, the rest is not significant. As mentioned before this paper focuses on the initial comparison of the designs, for which this precision was sufficient.
Unfortunately the boundary layer produced by the two domain meshing reduced the quality so much that no solution could be obtained. This was unfortunate, because all simulations were run without a boundary layer for easier adaptation between geometries. Many of the designs rely on
turbulence for increased heat transfer, so this reduced accuracy near the walls significantly
To create a working inflation layer the 3D model of the geometry first has to be separated into primitive geometries or blocks, which can be manually meshed for better accuracy. The meshing of such, fragmented body is much harder and time consuming thus the authors decided that for the initial concepts this will be acceptable. Accuracy will be enhanced later with a boundary layer in a future study.
Table 2. Results of mesh dependency study
Tmax j [°C] 57,371 58,13 57,95
Tmax w [°C] 53,191 55,86 56,20
Tavg j [°C] 43,599 43,75 43,63
Tavg w [°C] 41,879 41,98 42,01
Tavg hs [°C] 50,385 50,39 50,16
Tavg js [°C] 42,713 42,72 42,61
Tavg out [°C] 42,205 42,24 42,24
Δp [bar] 0,06 0,06 0,06
Element count water 254437 840326 1821485 Element count jacket 176797 1185272 1187254 Element count sum 431234 2025598 3008739
2.3 CFD setup
Table 3, contains the list of the initial parameters and Figure 3, shows the boundary conditions. Total heat loss was introduced into the system as wall heat flux on the jackets contact surface, with the stator parts (orange). The cooling of the ambient air around the motor was also taken into effect and it was set for the rest of the outside wall surfaces. Inlets (green) and outlets (red) vary on each concept. They were set up as mass flow inlet and pressure outlet. Symmetry (dark scarlet) was used in some cases to reduce computation time.
Table 3. List of input parameters
Flow rate of water 10 [litre/min]
Inlet water temperature 40 [°C]
Ambient air temperature 40 [°C]
Heat transfer coefficient of air 20 [W/m2K]
Total heat loss of the motor 1540 [W]
Pressure at outlet 1 [bar]
Figure 3. Boundary conditions
Since the results were only used for initial comparisons between the concepts, double precision was not needed thus, realizable k-ε model with enhanced wall treatment and thermal effects was chosen for turbulence modelling. Solution scheme was second order on every equation.
Convergence of 6 different parameters were checked. Maximum temperature of the jacket, heated surface and water, average of outlet water temperature, inlet and maximum water pressure.
3 RESULTS
3.1 Main concepts
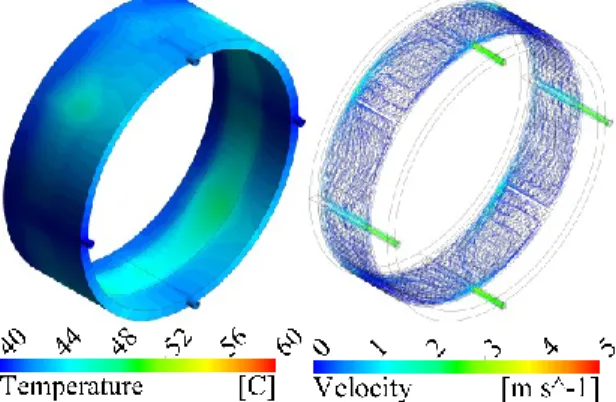
Maximum jacket temperature and pressure drop can be seen on Figure 4. Concept 3, 4 and 5 have similar temperatures and concept 1 is the worst out of all geometries. Figure 5 shows the streamline and outside surface temperature of concept 1. The hotter area overlaps with the swirls in the jacket. This concept’s high temperatures are caused by these swirls.
Figure 4. Main concepts temperature and pressure results
Figure 5. Concept 1 outer surface temperature, streamline plot
40 45 50 55 60 65
0 0,1 0,2 0,3 0,4 0,5
Tmax j [°C]
Δp [bar]
Pressure drop [bar]
Max jacket temperature [C]
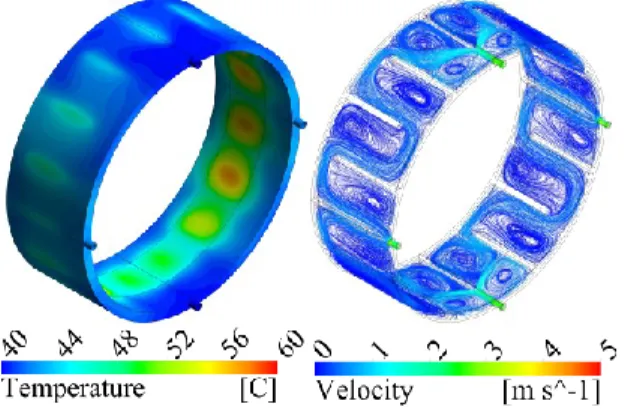
Figure 6. Concept 2 outer surface temperature, streamline plot
It is noticeable that concept 2 has one of the best temperature results out of the main concepts. This is most likely due to higher flow speed, less separation and swirling. Figure 6. shows the temperature distribution on the jacket surface. It can be seen that the distribution of cooling is unequal.
Figure 7. Concept 3 outer surface temperature, streamline plot
Concept 3 has the lowest pressure drop (0,026 bar), due to the number of inlets. Its cooling performance is more equal tangentially, but it is also significantly worse than concept 2 because of the slow flow speed between its cooling channels. Heat exchange around the wider fins is less effective.
Removing them from the geometry should yield better results.
Results of Concept 4 are similar to 3, 5. A separate CFD examination was conducted on a 5 channel version of this geometry to verify the effect of the flow restrictors. It was found that by increasing the diameter of the restrictions, flow will be unequal between channels. Therefore cooling performance will be similarly unequal. This method looked promising to decrease the pressure drop, and thus it was further investigated.
Figure 8. Volume flow difference of channels with different restrictor diameters
Figure 9. Temperature and pressure difference with different restrictor diameters
From Figure 8 and Figure 9 it can be seen that raising the diameter of the restrictor can help in decreasing the pressure significantly, but it also raises the operating temperature. In the case of no flow restrictor there is even, reversed flow in channel 1, which is the closest to the inlet. A different solution to uniform flow between channels would be preferable, but using a wider diameter is also desirable.
Figure 10. Concept 4 outer surface temperature, streamline plot
-4 -2 0 2 4 6 8
3 3,4 4 5 6 No
flow res Volume
flow [l/min]
Restriction diameter [mm]
CH1 CH2
CH3 CH4
CH5
40 45 50 55 60 65
0 0,1 0,2 0,3 0,4 0,5
3 3,4 4 5 6 No
flow res
Tmax j [°C]
Δp [bar]
Restriction diameter [mm]
Pressure drop [bar]
Max jacket temperature [C]
Comparing concept 5 to other main concepts, the pressure drop is significantly better than in most cases while cooling performance is similar to most designs. This is because of the in/outlet configuration. Compared to concept 1.2 which has the same number of water connections, temperatures are 15% better even though Δp is only 0,02 bar higher. On Figure 11 results show that pin fins prevent the fluid from swirling. They work very well in spreading the flow and directing water. The losses are also reasonable on the fins. The geometry has hot spots around the directing fins because of unequal flow distribution.
Figure 11. Concept 5 outer surface temperature, streamline plot
Table 4. shows the mass of each geometry.
Unsurprisingly concept 6 has approximately 1/3 the weight of the other designs. It’s smaller and temperature results show that its cooling performance is superior to other concepts. Because of space constrains, the model has a lot of narrow sections and sharp edges with flow separation, which result in an order of magnitude higher pressure drop on the cooler (9,6 bar). These need to be optimised or redesigned for a useable geometry.
Figure 12. Concept 6 outer surface temperature, streamline plot
Table 4. Main concepts results
Concept 1 2 3 4 5 6
mj [kg] 1,21 1,34 1,84 1,47 2,18 0,41 mw [kg] 0,72 0,67 0,49 0,62 0,36 0,30 msum [kg] 1,93 2,01 2,33 2,09 2,54 0,71
Tmax j [°C] 55 45 49 50 49 44
Tmax w [°C] 54 44 48 47 48 43
Tavg j [°C] 42 42 44 43 43 42
Tavg w [°C] 42 41 42 41 42 41
Tavg hs [°C] 47 44 46 47 45 42
Tavg out [°C] 42 42 42 42 42 42
Δp [bar] 0,36 0,33 0,03 0,40 0,08 9,63
3.2 Sub-concepts
Since all sub-concepts are based on concept 1, they share its flaws, but it was an easy geometry to modify and gives a good overview of what qualities are beneficial.
Figure 13. Sub-concepts temperature and pressure results
Figure 14. Concept 1.1 outer surface temperature, streamline plot
Concept 1.1 is most similar to concept 1.5. It has the same fin configuration (15 fins), but a symmetrical geometry. This helps to achieve a lower pressure drop, but the division of the flow results in slower velocities reducing cooling efficiency.
40 45 50 55 60 65
0 0,1 0,2 0,3 0,4 0,5
Tmax j [°C]
Δp [bar]
Pressure drop [bar]
Max jacket temperature [C]
Figure 15. Concept 1.2 outer surface temperature, streamline plot
Like concept 1.1, 1.2 has 15 fins, a similar configuration to 1.5. By increasing the number of inlets and outlets it was expected that designs will have a more equal temperature tangentially and a lower pressure drop. Figure 13 shows a steady improvement in pressure drop from 1.5 to 1.1 to 1.2, but maximum temperatures increase. It can be seen on the surface plots, that warm areas around the outlets have similar temperatures, which meet the initial expectations were incorrect.
Concept 1.3 aimed to test the effects of having the outlets on the back of the jacket. A version of 1.2 with outlets on the back would have been the best for the comparison, but such a design is not possible because of the fins. Concept 1.3’s 11 fins are arranged in the same way as concept 1’s. That is the reason it has the best pressure drop values, however the worst cooling performance out of the sub- concepts. Placing outlets on a different side from the inlets doesn’t affect any parameters significantly.
Figure 16. Concept 1.3 outer surface temperature, streamline plot
The main benefit of a concentrated cooling channel is weight reduction. Its 20% (0,42 kg) lighter than concept 1. In 1.4’s case a slight increase can be seen on Figure 13. in cooling performance and pressure drop also. It is believed that this modification can produce even more benefits in concept 2 and 4’s case.
Figure 17. Concept 1.4 outer surface temperature, streamline plot
Comparing concept 1 and 1.5 shows that by increasing the number of fins a better cooling performance can be achieved for the cost of a higher pressure drop.
Figure 18. Concept 1.5 outer surface temperature, streamline plot 4 SUMMARY
The comparison of concept 1.2 and 1.5 shows that by increasing the number of in/outlet on the jacket the pressure drop is reduced greatly. This also worsens cooling efficiency.
Comparing concept 1 to 1.5 shows that by increasing the number of fins the pressure drop will also increase, but temperature will decrease.
Narrowing the cooling channel width doesn’t significantly affect the pressure and temperatures, but reduces the weight by 1/3.
Swirling can create unwanted hotspots in the cooling jacket. Pin fins are great for increasing cooling efficiency and reducing swirling in the geometry. Their use is desirable even with increased losses.
Concept 2 has very good temperature results, 18% (10°C) better than the worst, concept 1. This was due to its higher flow velocity. It’s the best out of the conventional cooling jacket geometries.
Concept 3 has the most uniform temperature distribution, but it requires too many connections. It
also has the lowest pressure drop, because of this reason.
The pressure drop of concept 4 can be significantly reduced by increasing the diameter of the flow restrictions with a minor increase in temperatures.
Concept 6 is the most unconventional design. It has the best temperature results with the smallest size and lightest design, but also the worst pressure losses. More optimization is required to decrease the pressure drop before it can be used for cooling.
In conclusion, most designs have their own advantages, but also their disadvantages. A superior jacket can be made by combining the advantages of different concepts. Multiple inlets and outlets, a narrower cooling width, pin fins and smaller channel cross section for increased flow velocity. These can be applied to either concept 2 or 4.
Concept 6 also shows promising results and with further optimization this design could even outperform the two previously suggested.
ACKNOWLEDGEMENTS
The authors are very grateful to Dr. Frank Anton for providing research and development directions of electric machines.
This work is related to the National Research, Development and Innovation Fund of Hungary in the frame of FIEK_16-1-2016-0007 (Higher Education and Industrial Cooperation Center) project.
REFERENCES
[1] Jiang, J., Blank, A., Maier, F., Bharthepudi, A., and Kumar, P., 2015, “Financial Analysis and Comparison of Compact Electric and Gasoline Cars”, Proc. Portland International Conference on Management of Engineering and Technology, Portland, OR, U.S.A., pp. 511-518.
[2] “Fuel price list from 2nd of FEB 2018, Debrecen
Airport” [Online] Available:
http://www.debrecenairport.com/downloads/av gas_deb_02_2018.pdf
[3] Hu, X., Guo, H., Qian, H., Ding, X., and Yang, Y., 2017, “Development of a high-power- density motor for Formula SAE electric race car”, Proc. IECON 2017 - 43rd Annual Conference of the IEEE Industrial Electronics Society, Beijing, China, pp. 6618-6622.
[4] Mekhiche, M., Nichols, S., Kirtley, J. L., Young, J., Boudreau, D., and Jodoin, R., 2001, “High- speed, high-power density PMSM drive for fuel cell powered HEV application”, Proc.
International Electric Machines and Drives Conference 2001, Cambridge, MA, U.S.A., pp.
658-663.
[5] Zhang, L., Wen, X., and Wang, Y., 2010,
“Research of Permanent Magnets Failure for
High Power-Density Interior PM Synchronous Motor Used in Electric Vehicles”, Proc. 2010 International Conference on Electrical Machines and Systems, Incheon, South Korea, pp. 1098-1102.
[6] Pandit, J., Thompson, M., Ekkad, S. V., and Huxtable, S. T., 2014, “Effect of pin fin to channel height ratio and pin fin geometry on heat transfer performance for flow in rectangular channels”, International Journal of Heat and Mass Transfer, Vol. 77, pp. 359-368.
[7] Wang, F., Zhang, J., and Wang, S., 2012,
“Investigation on flow and heat transfer characteristics in rectangular channel with drop- shaped pin fins”, International Journal of Propulsion and Power Research, Vol. 1, pp. 64- 70.
[8] Jin, Z., Sun, Y., Luo, J., and Ding, G., 2017,
“Simulations on the Effective Thermal Dissipation of the Microchannel Heat Sink with Different Pin Fins”, Proc. 18th International Conference on Electronic Packaging Technology, Harbin, China, pp. 313-317.
[9] Arefin, A. E., 2016, “Thermal Analysis of Modified Pin Fin Heat Sink for Natural Convection”, Proc. 5th International Conference on Informatics, Electronics and Vision, Dhaka, Bangladesh, pp. 1-5.
[10] Schiefer, M., and Doppelbauer, M., 2015,
“Indirect slot cooling for high-power-density machines with concentrated winding”, Proc.
International Electric Machines & Drives Conference, Coeur d’Alene, ID, U.S.A., pp.
1820-1825.
![Figure 10. Concept 4 outer surface temperature, streamline plot -4-2024683 3,4 4 5 6 No flowresVolume flow [l/min]Restriction diameter [mm]CH1CH2CH3CH4CH5 40455055606500,10,20,30,40,533,4456NoflowresTmax j[°C]Δp[bar]Restriction diameter [mm]](https://thumb-eu.123doks.com/thumbv2/9dokorg/1428372.121311/5.893.475.783.896.1101/concept-temperature-streamline-flowresvolume-restriction-diameter-noflowrestmax-restriction.webp)