Contents lists available atScienceDirect
Ecological Indicators
journal homepage:www.elsevier.com/locate/ecolind
Discussion
Key criteria for developing ecosystem service indicators to inform decision making
Alexander P.E. van Oudenhoven
a,⁎, Matthias Schröter
b,c, Evangelia G. Drakou
d,
Ilse R. Geijzendor ff er
e, Sander Jacobs
f,g, Peter M. van Bodegom
a, Laurent Chazee
e, Bálint Czúcz
h,i, Karsten Grunewald
j, Ana I. Lillebø
k, Laura Mononen
l,m, António J.A. Nogueira
k,
Manuel Pacheco-Romero
n, Christian Perennou
e, Roy P. Remme
o, Silvia Rova
p, Ralf-Uwe Syrbe
j, Jamie A. Tratalos
q, María Vallejos
r, Christian Albert
saInstitute of Environmental Sciences CML, Leiden University, Einsteinweg 2, 2333 CC Leiden, The Netherlands
bUFZ–Helmholtz Centre for Environmental Research, Department of Ecosystem Services, Department of Computational Landscape Ecology, Permoserstr. 15, 04318 Leipzig, Germany
cGerman Centre for Integrative Biodiversity Research (iDiv) Halle-Jena-Leipzig, Deutscher Platz 5e, 04103 Leipzig, Germany
dFaculty of Geo-Information Science and Earth Observation (ITC), University of Twente, P.O. Box 6, 7500 AA Enschede, The Netherlands
eTour du Valat, Research Institute for the Conservation of Mediterranean Wetlands, Le Sambuc, 13200 Arles, France
fResearch Institute of Nature and Forest INBO, Havenlaan 88 bus 73, 1000 Brussels, Belgium
gBelgian Biodiversity Platform BBPF, Av. Louise 231, 1050 Brussels, Belgium
hEuropean Topic Centre on Biological Diversity, Muséum national d’Histoire naturelle, 57 rue Cuvier, FR-75231 Paris, Paris Cedex 05, France
iMTA Centre for Ecological Research, Institute of Ecology and Botany, Klebelsberg K. u. 3, H-8237 Tihany, Hungary
jLeibniz Institute of Ecological Urban and Regional Development, Weberplatz 1, 01217 Dresden, Germany
kDepartment of Biology & CESAM–Centre for Environmental and Marine Studies, University of Aveiro, Campus Universitário de Santiago, 3810-193 Aveiro, Portugal
lFinnish Environment Institute, Natural Environment Centre, P.O. Box 111, 80101 Joensuu, Finland
mUniversity of Eastern Finland, Department of Geographical and Historical Studies, P.O. Box 111, 80101 Joensuu, Finland
nAndalusian Center for the Assessment and Monitoring of Global Change (CAESCG), Department of Biology and Geology, University of Almería, Carretera Sacramento, s/
n, 04120 La Cañada de San Urbano, Almería, Spain
oNational Institute of Public Health and the Environment (RIVM), Postbus 1, 3720 BA Bilthoven, The Netherlands
pEnvironmental Sciences, Informatics and Statistics Dept., University Ca' Foscari of Venice, Via Torino 155, 30170 Venice, Italy
qUCD Centre for Veterinary Epidemiology and Risk Analysis, UCD School of Veterinary Medicine, University College Dublin, Belfield, Dublin 4, Ireland
rRegional Analysis and Remote Sensing Laboratory (LART), Faculty of Agronomy, University of Buenos Aires, Av. San Martín, 4453 C1417DSE, Buenos Aires, Argentina
sLeibniz Universität Hannover, Institute of Environmental Planning, Herrenhaeuser Str. 2, 30419 Hannover, Germany
A R T I C L E I N F O
Keywords:
Science-policy interface CSL
Credibility Salience Legitimacy Feasibility
A B S T R A C T
Decision makers are increasingly interested in information from ecosystem services (ES) assessments. Scientists have for long recognised the importance of selecting appropriate indicators. Yet, while the amount and variety of indicators developed by scientists seems to increase continuously, the extent to which the indicators truly inform decision makers is often unknown and questioned. In this viewpoint paper, we reflect and provide guidance on how to develop appropriate ES indicators for informing decision making, building on scientific literature and practical experience collected from researchers involved in seven case studies. We synthesized 16 criteria for ES indicator selection and organized them according to the widely used categories of credibility, salience, legiti- macy (CSL). We propose to consider additional criteria related to feasibility (F), as CSL criteria alone often seem to produce indicators which are unachievable in practice. Considering CSLF together requires a combination of scientific knowledge, communication skills, policy and governance insights and on-field experience. In con- clusion, we present a checklist to evaluate CSLF of your ES indicators. This checklist helps to detect and mitigate critical shortcomings in an early phase of the development process, and aids the development of effective in- dicators to inform actual policy decisions.
https://doi.org/10.1016/j.ecolind.2018.06.020
Received 16 January 2018; Received in revised form 6 June 2018; Accepted 7 June 2018
⁎Corresponding author.
E-mail addresses:a.p.e.van.oudenhoven@cml.leidenuniv.nl,alexander.vanoudenhoven@gmail.com(A.P.E. van Oudenhoven).
Available online 14 August 2018
1470-160X/ © 2018 The Authors. Published by Elsevier Ltd. This is an open access article under the CC BY-NC-ND license (http://creativecommons.org/licenses/BY-NC-ND/4.0/).
T
1. Introduction
Research on ecosystem services (ES), the contribution of ecosystems to human wellbeing (TEEB, 2010), is often claimed to inform policy and decisions in various contexts such as biodiversity conservation, natural resource management, and spatial planning (Daily et al., 2009; Laurans and Mermet, 2014; Martinez-Harms et al., 2015). Decision makers are increasingly interested in ES assessments (Maes et al., 2016; Pascual et al., 2017). Indicators to track and communicate trends in the quan- tity and quality of ES form a crucial foundation for these assessments (Ash et al., 2010; Layke et al., 2012). From the onset of ES assessments, the importance of developing appropriate indicators has been re- cognised, and many ES indicators and corresponding datasets have been developed, applied, tested and reviewed. This has been done for different purposes and in different contexts, be it methodological (van Oudenhoven et al., 2012; Böhnke-Henrichs et al., 2013) or policy-or- iented (Albert et al., 2016b; Maes et al., 2016; Geijzendorffer et al., 2017).
At the same time, there is an increasing uneasiness in the scientific and decision-making community as to whether the proposed ES in- dicators truly inform decision making (Laurans and Mermet 2014).
Apparently, many ES indicators are not considered appropriate for a specific purpose and are simply not used for decision making. Discus- sion on the suitability of indicators has remained mainly academic and the main criteria discussed have been their scientific credibility or precision (e.g. Layke et al., 2012; van Oudenhoven et al., 2012;
Geijzendorffer et al., 2015). Discussions on the usability of ES research outputs by decision makers, and what this application depends on, have only recently emerged in the scientific literature (Caliman et al., 2010;
Martinez-Harms et al., 2015; Wright et al., 2017). For instance,Palomo et al. (2018)identified the lack of user-centred design of ES assessments to be one of the major gaps in the usability of ES. Similarly,Drakou et al. (2017) identified lack of engagement of specific stakeholder groups and difficulty of some ES indicators to account for complexity, to be among the key issues that hinder the usability of ES information by decision makers. In the cases where user-centred design was applied, ES assessments were linked to the development of specific decision- making web platforms or tools for a specific group of stakeholders (e.g.
Klein et al., 2016; Wissen Hayek et al., 2016).
Cash et al. (2003)published a seminal and widely cited paper on the conditions under which information on sustainability, science and technology is likely to be used by relevant stakeholders. According to them, the probability of scientific information uptake increases if re- searchers take demands of users for that information as a starting point;
i.e. the question what information should be produced and what it should contain to instigate policy action. More specifically,Cash et al.
(2003)argue that scientific information is likely to be effective in in- fluencing decision making if the relevant stakeholders perceive the presented information to be not only credible, but also salient and le- gitimate. Credibility refers to whether the evidence and arguments are perceived as scientifically adequate. Salience indicates whether the assessment that resulted in the information is relevant to the needs of decision makers. Legitimacy relates to the question whether the gen- eration of information has been unbiased, and has been respectful of the decision makers’diverse values. The usefulness of considering cred- ibility, salience and legitimacy (CSL from here on) has been recognised for the design of environmental and ecosystem assessments (Ash et al., 2010; Posner et al., 2016; Wright et al., 2017). However, this does not automatically imply that such criteria are applied. To the best of our knowledge, studies have yet to apply CSL criteria in the process of developing ES indicators in existing ES assessments.
Considering the above, this viewpoint paper evaluates relevant lit- erature and personal experiences of researchers involved in seven case studies under the growing‘ES indicator umbrella’, in order to achieve more effective permeation of ES information into decision making. The
paper aims to provide guidance on how to develop (i.e. to generate and select) more appropriate ES indicators for informing decision making.
To achieve this, we identify criteria for ES indicator development from the scientific literature and test their alignment with the CSL categories put forward byCash et al. (2003). In addition, we reflect on the ES indicator development processes embedded in seven (inter)national and regional ES assessment projects aiming to inform decision making, thereby taking the perspective of scientists at the science-policy inter- face. We evaluate which criteria were used and whether these can be placed in the CSL or other categories. We reflect on how the criteria were tested in different case studies, as well as on the lessons learned.
Finally, we propose a checklist to consider when developing ES in- dicators.
2. Synthesising criteria for ES indicator development
We synthesized criteria for ES indicator selection and generation, and organized them according to the broad categories of CSL. We ex- plored relevant literature and selected case studies (i) to identify cri- teria for‘appropriate’ES indicators, (ii) to cluster the proposed criteria into distinctive categories, and (iii) to assign and map these criteria to the CSL categories proposed byCash et al. (2003).
We explored the relevant literature in Web of Science on ES in- dicators based on the terms“ecosystem service”AND“indicator”. Using the‘sort by relevance’option within Web of Science, we explored the ten most relevant research papers, the ten most relevant review papers, and the ten most highly cited papers overall. Out of these three cate- gories, we only considered papers that discuss, propose or use criteria for ES indicator selection and generation in the context of informing decision making. Furthermore, adopting a ‘snowballing’ approach, several citing and cited studies were also considered to identify criteria for ES indicator development for decision making. We complemented the obtained paper selection with a consultation of technical reports by Brown et al. (2014)andMaes et al. (2014), which explicitly deal with selecting and quantifying indicators to support decision making in the context of ecosystem assessments. An overview of the 22 key sources considered can be found inAppendix 1.
In addition to the literature search, we collected information on first-hand experiences by researchers involved in ES assessments at the science-policy interface. This was done through a targeted dialogue with researchers, during a workshop facilitated by the working group of the Ecosystem Services Partnership on ES Indicators (https://www.es- partnership.org/community/workings-groups/thematic-working-groups/
twg-3-es-indicators/). The workshop was set up during the European Ecosystem Services Conference in Antwerp (19–23 September 2016;
https://www.esconference2016.eu/86157/part_program#.Wzx7C- 6WS9J) and included participants from a wide range of European coun- tries who used ES indicators in different decision-making contexts. For this paper, we selected case studies with a clear link to decision making.
For each case study we extracted information on its purpose, the associated project, the policy question assessed and, if applicable, the mandate (Table 1). In addition, the contributing researchers provided information on the applied criteria for appropriate indicators as well as the approach followed to assess the criteria. Contributing researchers were asked to name criteria that they perceived to correspond with CSL, but were also requested to list additional criteria.Appendix 2provides an overview of all questions asked to contributing researchers.
The criteria emerging from the literature and the cases were as- signed to the CSL categories. The criteria were aligned to each category and we assessed potential synergies or conflicts between the different categories. Finally, with a robust list of criteria generated (Table 2) and after consultation with participating researchers, we reflected on the relevance of the different clusters of criteria for indicator development in the different cases.
Table1 Overviewofcasestudiesconsideredinthispaper,theirdecision-makingcontext,thephaseintheindicatorgeneration/selection/useprocessandinformationontheESindicators. Case,timespanandkeyreferencesMandateTargetedquestion(s)Indicator generation, selectionorusing GeneralinformationaboutindicatorsExamplesofindicatorsgeneratedorselected.If applicable,theindicandumandunitareprovided betweenparentheses. 1.AQUACROSS:2015–2018 (Lillebøetal.,2016;Nogueira etal.,2016)
AQUACROSSrespondstotheEUCallonProtection oftheenvironment,sustainablemanagementof naturalresources,water,biodiversityand ecosystems(H2020-EU.3.5.2.).Casestudyin cooperationwithadepartmentofthePortuguese EnvironmentAgencyascooperatingorganization.
SupportthetimelyachievementoftheEU 2020BiodiversityStrategyandother internationalconservationtargets(e.g.WFD, HabitatsDirective,MSFD)inNatura2000 aquaticsystems.Thiswasconsideredessential foranecosystem-basedmanagement approach.
Generation, selectionMAESandEScase-specificindicators forsupplyanddemand.Indicators wereselectedforESandfor biodiversity.
Coastalandfreshwaterwetlandscoverage Bluecarbonsequestration(MgC) Shellfishlandings(ton) Numberofobservers(birdwatching) 2.MediterraneanWetlandsOutlook (MWO):2009–2012(MWO 2012)
TheMWOwasarequestfromdecisionmakersof theMediterraneancountries,whicharemembersof theMedWetregionalinitiativeoftheRamsar convention.
Informnationaldecisionmakersonthestate andtrendsofMediterraneanwetlands,their biodiversityandecosystemservices.Thiswas consideredessentialforinfluencingthe decision-makingprocesstowardsbetter conservation.
Generation, selection17indicators,includingbutnot limitedtoES(4directESindicators)Waterqualityandriverflow(stateofsurfacewater andgroundwater) Wateruse(exploitationofrenewablewaterresources, in%ofannualrenewableresource) Waterdemandbyeconomicsector(in%) Abundanceofwetlandvertebratepopulations(habitat service,%ofindexvaluefrombaselineyear) 3.NEAFinland:2013–2015 (Mononenetal.,2016)Nodirectmandate.Thiswasanexperimentfor developingastructuredframeworkforecosystem serviceindicatorstomonitorthestateandtrendsof ESatnationalscale.Expertgroupswereinvolved duringtheindicatordevelopmentprocessand stakeholdercommentswererequestedina workshop.
CreatingindicatorsfortheNEAFinland,tobe abletomonitorchangesinES.GenerationFourindicatorsperESdescribing structure,function,benefit,and values.Altogether28ES.Intotal112 indicators. Numericalindicatorscouldnotbe generatedforalltitles.Proxieshadto beusedinsomeofthecases.
Exampleforcleanwater: Structure:undisturbedhabitatsandaquifers(shareof pristinemires(%),annualsoilpreparationsinforests (ha),groundwaterareas) Function:stateofsurfacewaterandgroundwater (ecologicalstateoflakesandrivers,changesin ecologicalstate) Benefit:useofrawwater(proxy:communalwater supply) Value:economic,health,socialandintrinsicvaluesof cleanwater(currentlyonlydescriptive) 4.UKNEACulturalES:2012–2014 (Tratalosetal.,2016)ThiswaspartoftheFollow-ontotheUK’sNEA assessment,whichhighlightedaneedtodevelop indicatorsofCESfortheU.K.
Thefocuswasoncalculatingquantitative indicatorsofsupplyanddemandforCES, basedonreadilyavailabledata,and particularlywithregardtophysicalaccessto CESanditsspatialdistribution.
Generation48indicatorsforculturalES;28 supplysideindicators,16accessibility indicators,4demandsideindicators.
Percentageofareaconsistingof‘openaccess’ countryside(supplyside) NumberofTreePreservationOrders(supplyside) Numberoflandmarksrelatingtoculturalheritage (supplyside) Averagedistancetonaturereserveslargerthan100ha (accessibility) Averagedistancetoareasof‘ancientwoodland’large than500ha(accessibility) Probabilityofwildlifewatchinginagivenweek (demandside) 5.MAESGermany:2012–2016 (Marzellietal.,2014,Albert etal.,2016a;Grunewaldetal., 2017)
TheMAESprocessinGermanyhasanational environmentalpolicymandateduetoitsfunding throughtheFederalMinistryfortheEnvironment, NatureProtectionandNuclearSafetyand administeredbytheFederalAgencyforNature Conservation.
OngoingprocessinGermany(firstfinished studiesarereferredhere)torespondtotheEU biodiversitystrategytarget5tomapand assessecosystemsandtheirservices, implementedinseveralprojectsandby differentinstitutions.
Generation50indicatorsonsupplyanddemand fortwentyES,withfourteenindicators furtherconcretizedforfourESclasses (Grunewaldetal.,2017).
Extentofbuilt-upareainthecurrentfloodplain(%per km2) Areaavailableforfloodretention(ha) Avoidedsoilerosionbywater(t.ha−1.a−1) Annualusablewoodaccrual(m3.ha−1.a−1) Inhabitantswithaccesstopublicurbangreen(%) 6.FlandersREA:2009–2014(Jacobs etal.,2016,https://geo.inbo.be/ ecosysteemdiensten/)
TheFlanders’governmentResearchInstituteof NatureandForest(INBO)ismandatedwiththe evaluationofthestateofnature,andresearchonits conservationandsustainableuse.TheEUBiodiversity Target2action5alsoprovidedamandatetobroaden thisassessmenttoanESassessment Regionalecosystemassessment:Statusand trendsofESinFlanders.Generation, selection,usingBiophysicalpotential,actualpotential, useanddemandfor16ESindicators. Over50mappedindicators.
Theindicatorforwaterpurificationsupplywas potentialdenitrificationbasedonsoil,landuseand groundwaterconditions.Thiswasusedtoallocate optimallocationsforwetlandcreationinalocal participatoryrivervalleyscenarioplaninFlanders. 7.Niraj-MAES:2015–2017(Vári etal.,2017)fundedbytheGovernmentofRomania(“RO02 ProgrammeonBiodiversityandEcosystem Services”),expectingstudiesthat“address ecosystemservicesdegradationenhancethe knowledgeoftheireconomiccontributionand contributetohaltingthelossofbiodiversityin Romania.” Theleadpartner(alocalNGO)wantedabroadly inclusiveproject,withemphasisonlocalawareness andcapacityraising.
Identify,assessandmapallmajorESsupplied bytheNatura2000areasoftworivervalleys inCentralRomania,thusperformaregional casestudyforthenationalMAESassessment. Keypolicyquestionsaddressingthevalueof protectedareasforthelocal/national economy,optimizingnon-marketeconomic benefits,governanceofregionalESconflicts Generation, selectionEcosystemcondition(3spatial indicators),ecosystemservicecapacity (“supply”:7spatialindicators), ecosystemservicesactualuse (“demand”:6aggregatedmonetary indicators) Livestocksustainment(naturalforageandfodder,in LU.ha−1) Timberandfirewoodprovision(m3.ha−1.y−1) Honeyprovision(kg.ha−1.y−1) NetCO2sequestered(t.ha−1.y−1) Berry,medicinalandmushroomprovisionscores (stakeholderscores(1–5)foreachproduct)
3. A comprehensive list of criteria for developing ES indicators
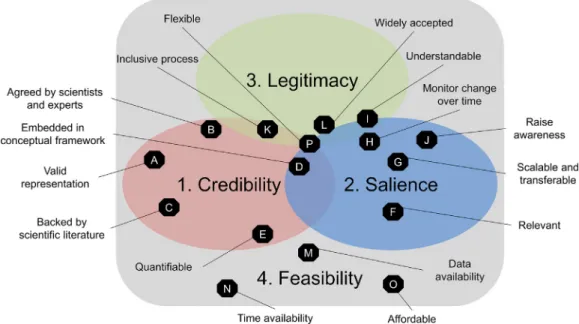
We identified a wide range of criteria for developing (i.e. selecting and generating) ES indicators to inform decision making, based on the literature and practical experiences from the seven case studies. While most of the criteria clearly related to categories of CSL, a new category related to feasibility (F, see description below and overview inTable 2) emerged from this inventory. However, the identified criteria usually cannot be clearly associated to just one category.Fig. 1illustrates this overlap by conceptually sketching the criteria on the CSLF spectrum based on the judgement of the scientists involved in the cases.
3.1. Credibility
Credibility of ES indicators refers to the perceived scientific ade- quacy of the information and advice that they provide. Involving re- putable scientists in the criteria development process, founding the indicator development process on a review of existing literature, and implementing a rigorous external review system (i.e. expert validation) can help in ensuring the credibility of ES indicators (Cash et al., 2003;
Ash et al., 2010). Scientists involved in the case studies considered criteria relating to credibility the easiest to evaluate. Considerable challenges remain, however, to objectively evaluate this. The various aspects related to credibility are described in this section.
Validityrelates to the extent to which an indicator represents the indicandum (subject to be indicated) and is considered as a crucial part of the scientific credibility (Müller and Burkhard 2012; Hauck et al., 2016; Heink et al., 2016). An indicator is valid when it actually mea- sures what it claims to measure. Applying the validity criterion implies the existence of a linkage between the indicator and its purpose, with agreement that change in the indicator reveals change in the issue of concern (Brown et al., 2014). Validity was ensured in Niraj-MAES through meticulous ES and indicator definitions, which were empha- sized in all expert and stakeholder consultations and refined iteratively.
Taking the perspective of decision makers, and their (supposed) per- ception of valid indicators might help to evaluate and improve this validity (NEA Finland).
The only criterion that was used by all case studies was that the indicators had to be agreed on by the scientific community or backed by expert judgment. Adapting and further developing the indicators can be attained through expert review. This was either
ensured through (external) peer review and/or interaction in the form of expert panels and workshops (AQUACROSS, MWO, Flanders REA).
Because only few assessments combined these methods, opinions might be divided on what constitutes‘expertise’and who the consulted ex- perts should be. Credibility is improved when an indicator can be verified objectively, i.e. when different researchers are able to come up with similar information when using a given indicator (Hernández- Morcillo et al., 2013). In the case of the Flanders REA, the scientists involved assumed that this criterion could be interpreted as agreement across scientific disciplines on the usefulness and validity of the in- dicator, which increases perceived scientific coherence. Such involve- ment is often desired by funding agencies, such as in the Niraj-MAES case study. The involvement of local experts can be considered to assist in gaining a systems understanding, when available literature is in- sufficient (Niraj-MAES). A particular challenge with regard to this cri- terion are indicators for cultural ES, which are so far not consistently defined and assessed (UK NEA cultural ES).
One can also increase credibility by ensuring that the indicator is backed by the scientific literature. Credible indicators adhere to agreed scientific methods and available data sets where possible (Layke et al., 2012) and make an assessment reproducible and reliable (La Rosa et al., 2016). Although a relatively simple literature review can con- tribute to ensuring this criterion is met, many case studies employed a combination of literature review and expert elicitation. This finding suggests that the scientists involved found literature reviews alone to be insufficient (MWO, Niraj-MAES), as ES indicators need to be specifically attuned to the case study conditions and assessment objectives (see Section 3.2).
Because assessing ES involves inherent complexities,embedding the indicator in a conceptual frameworkcan contribute to ensuring credibility. It can help to define the objects studied as well as relations between them (Santos-Martín et al., 2013; La Rosa et al., 2016).
Hernández-Morcillo et al. (2013)found that clear definitions as well as the development of conceptual frameworks to define rationales for the indicators were lacking in most of the cases reviewed by them. As was done in the MWO, NEA Finland and AQUACROSS considered here, the Spanish NEA (Santos-Martín et al., 2013) also made sure that the se- lected indicators would clearly express information on and sensitivities to other components of the DPSIR framework (driving forces, pressures, states, impacts, responses). This also ensures a comprehensive set of indicators and helps with communicating complex, interrelated topics.
Fig. 1.The criteria for developing ecosystem service indicators, as mentioned inTable 2andSection 3, sketched on the CSLF spectrum, based on the judgement of the scientists involved in the cases andfindings from the literature.
Table 2
Criteria for developing ES indicators clustered according to the categories Credibility, Salience, Legitimacy and Feasibility. Capital letters (A-P) refer to individual criteria and are also referred to inFig. 1. The numbers in thefinal column (between parentheses) refer to the case studies, as mentioned inTable 1; 1 - AQUACROSS, 2 - MWO, 3 - NEA Finland, 4 - UK NEA Cultural ES, 5 - MAES Germany, 6 - Flanders REA, 7 - Niraj-MAES.
Criteria Short description, and overview of
included criteria
Further explanation and reference to relevant cases and literature
1. Credibility(Indicators and information that they provide are perceived as scientifically adequate.)
A. Valid representation of subject The indicator represents the subject to be indicated.
The indicator should be sensitive and show response to changes (Breckenridge et al., 1995). If the value of a valid indicator changes, then so will the issue of concern (Brown et al., 2014).
B. Agreed by scientific community or experts The indicator has been backed by expert judgment and agreed on by the scientific community. It has been objectively verified by experts.
Ensured through expert panels including experts, but also decision makers and practitioners (2,5,7) and/or external peer review, both individual and group-based (2). Criterion considered in all case studies.
C. Backed by scientific literature The indicator is backed up by
scientific literature Key to be perceived as scientifically reliable (5). Empirical and conceptual support of the measurement protocols. Often combined with expert elicitation (1,3,5).
D. Embedded in conceptual framework The indicator is embedded in, or meets criteria of a conceptual framework.
Contributes to clear definition of studied objects and relation between them. Frameworks include DPSIR (1,2) and the cascade model (3, 7, (Haines-Young and Potschin 2010)). Can justify the exclusion of certain topics (e.g. abiotic services) (7). Such frameworks are also associated with salience, as they inform on broader people-nature interactions. Indicators need to provide information on capacity and use of ES (1).
E. Quantifiable The indicator is evidence based, can
be quantified and is backed up by high-quality data.
Ensured by a sound and practical measurement process resulting in quantifiable output (4, 5). Criterion shows clear trade-offs and overlaps with M.
2. Salience(Indicators to convey useful, relevant information for decision makers on a specific policy objective as perceived by potential users.)
F. Relevant to information needs The indicator is relevant to the information needs of decision makers, policy actors and, ideally, affected stakeholders.
Ensured by estimating the decision makers’needs, often by involving experts (1,2). The indicator should stand the challenge of legal negotiations (Hauck et al., 2016). When relevant, the indicator can be used to inform improvements in policy or better management of resources, or to help review, justify and set local objectives and priorities (1,4). Perceived as meaningful if indicator represents a public good (4). Reflecting to sponsor expectations, and the project Stakeholder Advisory Board expressing local sectorial expectations/interests (7).
G. Scalable and transferable The indicator is applicable at different spatial scales and can be compared and aggregated across different geographical areas.
Ensures applicability and scalability of indicator (Hauck et al., 2016). It requires in most cases that the indicator is spatially explicit (La Rosa et al., 2016). The criterion enables the political implementation at several spatial levels (2,5).
H. Monitor change over time The indicator is temporally explicit and allows for monitoring over time. It measures progress and provides early warning when needed.
Such indicators enable detecting early signals of changes and allow for remedial or adaptive action (Layke et al., 2012). Indicators should detect harmful and positive impacts of decisions (3). A possibility to automate the recording of the indicator’s development is desirable (Paruelo 2008).Indicators can be associated with a target value (expressing political aims) and are able to highlight if the target is matched of missed (5). Criterion overlaps with Credibility and closely linked to G. and J.
I. Understandable The indicator is readily understood
by decision makers and, preferably, the broad audience. Indicators combined convey a simplified, broad message.
Involving professional communication experts, copywriters and graphic designers that digest scientific material to obtain readable and accessible results (6). Transparent modelling techniques were favoured wherever possible, structured and thorough
communication of all elements (indicator definitions, map explanations etc.) throughout the project (1,7).
J. Raise awareness The indicator contributes to raising awareness and motivates to take action.
Ensured through expert group and stakeholder meetings. If the information should reach the media, then an indicator should be meaningful to them (4). Such indicators can detect changes before the chance to take action is compromised and are strongly linked to H.
3. Legitimacy(Indicators, information and the process are perceived as legitimate and politically fair by the audience of an ES indicator study.)
K. Selected through an inclusive process The indicators have been selected through an inclusive process.
Criterion that evaluates the process rather than the indicator. Ensured by holding participatory workshops and meetings, during which scientists, policy makers and other relevant stakeholders are present (2,3,5,7). This criterion is strongly linked with B.
L. Widely accepted The indicator is widely accepted and agreed upon by the multiple stakeholders involved.
A participatory process involving end-users and beneficiaries of the decision ensures legitimacy. Potential trade-offs with Credibility, as the scientific adequacy must not be at stake. This can be prevented by starting with a long-list of scientifically credible indicators. Criterion closely linked to K. and several criteria under Salience (F., I.).
4. Feasibility(Criteria ensuring that indicators can be assessed and monitored continuously.)
M. Data availability There is sufficiently detailed data available for the indicator.
Considered in most case studies (2,3,4,5,7). Dependent on available methods. Closely linked to E., as the data needs to be of sufficient quality as well. Information might not be available for a certain time span (G.) or spatial scale (H.).
N. Time availability There is sufficient time available for developing and quantifying the indicator.
Evaluating this criterion involves thinking ahead, beyond the indicator selection process (2,4,7). The availability of time and resources can act as afilter excluding several indicators/method options (2,7). Related to time issues is the requirement that there is a short time-lag between the state of affairs referred to and the indicator becoming available.
O. Affordable The process of selecting, generating
and using the indicator is affordable and cost-efficient.
Note that improving salience of indicators can result in a more time- consuming process. Strongly related to N. and M.
P. Flexible The indicator can be revisited and
updated, if required
To account for future realities in which meanings, values and people’s behaviours change in response to economic, technological, social, political and cultural drivers (UK NEA 2011).
We note that if a conceptual framework of an ES assessment has been co-developed by scientists and decision makers, the selected indicators are more likely to also be perceived as credible and salient (Niraj- MAES). Consequently, a purely scientifically developed conceptual framework likely lacks salience.
Indicators that are quantifiable and backed up by high data qualityare generally perceived as credible. High quality data can relate to whether it has been processed consistently and reliably, and whether it has been normalized and disaggregated (Layke et al., 2012). For the UK NEA and the UK NEA cultural ES, the scientists went as far as en- suring quantifiable output, even if the original information was quali- tative. In the Spanish NEA, only quantifiable indicators were used that were covered by official statistical data sets from a given time period (Santos-Martín et al., 2013). However, we note that‘quantifiable does not mean only numerical data should be used. Large parts of informa- tion that are needed to assess ES are actually qualitative, e.g. ob- servations, arguments,field estimates, expert judgements (Jacobs et al., 2016). Quantifiable means that information can be synthesised in agreed upon categories or scores (high/low; good status/bad status).
Reducing assessment scope to strictly natural science or biophysical measurements will strongly decrease salience (Section 3.2) and re- levance (Section3.3,Jacobs et al., 2016).
3.2. Salience
Salience relates to the capacity of ES indicators to convey useful, relevant information for decision makers on a specific policy objective as perceived by potential users and stakeholders. The ability to convey information to the policy making and implementation processes is a crucial criterion for policy-relevant ES assessments (Layke et al., 2012;
Maes et al., 2016). In most case studies, relevance of the assessment’s scope for decision making was only assumed, but concrete indicator sets were not often tested in dialogue with decision makers. Note that as- suming salience in an assessment would suffice in accordance withCash et al. (2003), provided that this is consistently tested.
In almost all case studies, ES indicators were developed that were relevant to the information needsof decision makers, policy actors and, ideally, affected stakeholders for a specific issue at stake (Santos- Martín et al., 2013). This entails that indicators should have a clear link to policy objectives and relevant legal frameworks, and that the poli- tical implications of different ES indicator options need to be explored and considered (UK NEA cultural ES, and Layke et al., 2012; Brown et al., 2014). Ideally, indicators should be able to stand the challenge from legal and political negotiations (Hauck et al., 2016). To achieve relevance, the information needs of decision makers need to be iden- tified and considered in the ES indicator development, at best through a systematic involvement of the decision makers within the ES indicator development process (Fagerholm et al., 2012; Nolte et al., 2013; Wissen Hayek et al., 2016). Systematic involvement means that decision ma- kers are given the opportunity to participate at crucial instances to co- design a set of ES indicators. For example, in Niraj-MAES a Stakeholder Advisory Board consisting of 12 key regional stakeholders was given a supervisory role, and gave recommendations at key nodes of the as- sessment process. Direct involvement of decision makers ensured meeting this criterion in other cases as well (AQUACROSS, NEA Fin- land).Schroter et al. (2016)suggested to incorporate and discuss ex- pressions of user needs during roundtables and hearings. This would ensure, for instance, that indicators are not blind towards certain as- pects such as unequal distribution of benefits between different stake- holders (Geijzendorffer et al., 2015).
Another aspect of salience relates to howscalableandtransferable an indicator is (Santos-Martín et al., 2013). The relevant scale depends on the scope of the assessment, but ideally indicators would be widely applicable at multiple spatial scales (Santos-Martín et al., 2013; Hauck et al., 2016). This would allow for comparison between different geo- graphical areas as well as (dis)aggregation to the scale most preferred
by relevant decision makers (Czúcz et al., 2012; van Oudenhoven et al., 2012; Scholes et al., 2013). Application to and comparability with different climate and geographical zones were often mentioned in our case studies. This can result in indicators that should be relevant on both local and regional scale (NEA Finland), on national scale (UK NEA cultural ES, MAES Germany) and throughout the Mediterranean region (MWO). In the latter case, many indicators could not be included be- cause they did not apply to the whole Mediterranean basin (MWO, 2012). The question whether an indicator should be scalable is highly context dependent, as local decision makers might be focused on the indicator’s representation in their locality only. However, transfer- ability can increase efficiency in performing ES assessments, for in- stance through an adaptation from national ecosystem assessments to other countries, as is done for The Netherlands based on methods de- veloped for the Flanders assessment (Jacobs et al., 2016; Remme et al., 2018).
The potential tomonitor change and assess progress over time requires indicators to be temporally explicit (van Oudenhoven et al., 2012; Santos-Martín et al., 2013). Decision makers can then detect changes in time or make policy adjustments before the changes are profound and the ability to take remedial or adaptive action is com- promised (Layke et al., 2012).
Many studies considered criteria related to theunderstandability of the information contained in ES indicators. First and foremost, de- cision makers shouldfind iteasy to interpret and communicatethe indicators with regard to relevant decision/making processes, without the risk of misinterpretation (Brown et al., 2014). This requires that ES indicators should be defined and described clearly and understandably (van Oudenhoven et al., 2012; Santos-Martín et al., 2013), but also that the indicatorsconvey the big picture, i.e. a simple, broad yet relevant message. Locally defined indicators may not mean much to other sta- keholders, so they often need to be explained (Hernández-Morcillo et al., 2013). Indicators that express one single ES may result in limited understanding, which limits the indicator’s usefulness to decision ma- kers (Lavorel et al., 2017). An additional consequence of considering interpretability of the indicators is thatfindings can also be understood by a broad audience, as was explicitly aimed for in the Flanders REA (Jacobs et al., 2016).
Several of the cases highlighted that indicators should have the ability to raise awarenessandmotivate decision makers to take action(NEA Finland, UK NEA cultural ES).Brown et al. (2014)de- scribe salient ES indicators as useful for measuring progress, early warning of problems, understanding an issue, reporting, awareness raising etc. This requires the indicator to be sensitive to the relevant societal issue (van Oudenhoven et al., 2012; Santos-Martín et al., 2013), which suggests strong links to Legitimacy (Section 3.3). Some argue that indicators should be able to show potential thresholds (MAES Germany, AQUACROSS) or tipping points, below or above which eco- systems are no longer sustainably used (e.g.Newbold et al., 2016). An important related issue is defining target values and identifying ranges of ES supply or use that society should strive for. Examples of such targets include achieving carbon neutrality in regional environmental planning (Galler et al., 2016), 12 out of the 17 Sustainable Develop- ment Goals that relate specifically to ES (Geijzendorffer et al., 2017) and target 2 of EU biodiversity strategy, which requires ecosystems and their services to be maintained and enhanced by establishing green infrastructure and restoring at least 15% of degraded ecosystems.
Through such targets, salience is strongly enhanced, as illustrated by the successful implementation of Maximum Sustainable Yield forfish- eries (Babcock et al., 2005; Borger et al., 2016).
3.3. Legitimacy
Legitimacy within the context of ES indicator development ensures that the ES indicators, the information they provide, and the indicator development process are perceived as legitimate, unbiased and fair by
the decision maker involved in an ES indicator study. Legitimacy was not often considered in our case studies, despite the fact that‘widely accepted’or‘selected through an inclusive process’are often suggested criteria in the literature (e.g. Layke et al., 2012; Santos-Martín et al., 2013). One explanation would be that most of our case studies were in the phase of generating indicators, during which less focus was placed on assessing how legitimate and fair the indicators are being perceived.
Despite the fact that achieving legitimacy can be time consuming, we propose to already consider aspects of legitimacy when generating ES indicators.
A criterion for assessing perceived legitimacy is whether the ES indicators wereselected through an inclusive process. In several of our case studies, a strong emphasis on the required inclusiveness of the indicator selection process was ensured by holding participatory workshops and meetings, during which scientists, policy makers and other relevant stakeholders would be present (AQUACROSS, MWO, Flanders REA, Niraj-MAES). Inclusiveness may be further ensured by an initial stakeholder analysis (Reed et al., 2009), and a supervising body (stakeholder advisory board) with real influence on the project con- sisting of key stakeholders (Niraj-MAES). Legitimacy is often not in- terpretable at the level of individual indicators, but rather at the level of the whole process of an assessment (AQUACROSS, Niraj-MAES). In- clusive processes can be confused with‘only’involving experts, which could be problematic unless the experts are also the decision makers (NEA Finland). The Flanders REA and Niraj-MAES are exceptions, as they were conducted by researchers paid by and involved with gov- ernment work. Legitimacy was therefore considered from the onset. In other cases, creating inclusive processes is challenging as interactions with decision makers can be perceived by scientists as censorship. The concept of ES has the potential to bring actor groups together, to ex- plore implications (and trade-offs) of decision making options, and to facilitate a fair weighing of these decision options as the basis for po- litical decision making (Schröter et al., 2014; López-Rodríguez et al., 2015). Involving all stakeholders can also create trust between scien- tists and stakeholders and among stakeholders from various back- grounds (López-Rodríguez et al., 2015). This is illustrated by the con- tribution of indigenous and local knowledge holders to IPBES assessments (Díaz et al., 2018), and how this required IPBES to adapt terminology, discourse and even approaches of the assessment to its policy context (Díaz et al., 2018).
In line with the above, but not necessarily as a consequence of an inclusive process, is the criterion that the ES indicators used aregen- erally agreed uponandwidely acceptedby the diverse actor groups involved, including experts (AQUACROSS). This might require the in- volvement of beneficiaries of a policy decision to assess the indicators’ legitimacy (Hernández-Morcillo et al., 2013). It was noted, however, that truly representative processes are challenging, as it is unclear who should ideally be involved (UK NEA cultural ES, MAES Germany).
Moreover, indicator development is a question of prioritization that pre-determines many outcomes (Mononen et al., 2016). Even deciding not to prioritise or include any services or indicators is a choice that needs to be justified. Therefore, the actors of the decision making process are ideally included in this step. Note that the process of se- lecting and assessing indicators can be empowering and allow actors to reflect critically on a changing situation (Roche 1999; Hernández- Morcillo et al., 2013).
3.4. Feasibility
In addition to criteria relating to CSL, a range of other criteria clearly related to ensuring feasibility (F). Feasibility has been identified as a crucial constraint for national ES assessments (Schröter et al., 2015). It refers to whether sufficient data, time, and resources are available to continuously and rigorously assess and monitor the sug- gested ES indicators to usefully inform decision making (Brown et al., 2014). Ensuring feasibility determines whether an assessment can be
conducted with the chosen ES indicators and feasibility considerations go back to the principle ofparsimony, applied in economics, modelling and engineering. The parsimony principle or Ockhams’ razor is im- portant in ES indicating and mapping (Jacobs et al., 2017) and can be summarized as: out of two equally good solutions, the more feasible or simple solution is the better one. The simplicity of indicators (and the underlying data, models etc.) can also facilitate stakeholder under- standing, thereby indirectly also improving the salience and legitimacy of the simpler, and thus more transparent indicators.
A key criterion related to feasibility involves data availability.
Recognised in most case studies and in the literature as well, sufficiently detailed data needs to be available for the ES indicators selected (Layke et al., 2012; Maes et al., 2014; Heink et al., 2016). In many cases, data is not available over the entire study region and for the desired time span or frequency thus preventing the use of more detailed data which may be available only for a limited area or timespan (MWO). Data avail- ability relates strongly todata quality; some data might be readily available (Maes et al., 2014), but not in disaggregated, processed or normalized form (Layke et al., 2012). In addition, availability can de- pend on whether the data is publicly accessible, which was a key cri- terion inGrunewald et al. (2017)or available through data sources that are backed up by decision makers and involved experts. To tackle the problem of data availability, Niraj-MAES applied an iterative‘zooming in’approach for selecting the ES and their indicators with a constant eye to data and methods availability. Any ES indicator that seemed unfeasible to be modelled and mapped with the available data (and time and resources) was dropped. An alternative approach is the use of proxies, such as was done by the Finnish NEA.
Time availability, both for developing and quantifying the in- dicator, also ultimately determines whether an assessment can be rea- listically carried out (Brown et al., 2014). This is not only related to data availability, but also with project duration and with the existence of a post-project follow-up protocol, as processing data might take a long time or data updates might become available only at low fre- quencies. Time availability is also determined by how urgently the data is needed to make decisions about a problem they must solve.Tratalos et al. (2016)mention that an additional criterion for their study in- cluded that there should beshort time lagbetween the state of affairs measured and the indicator becoming available (UK NEA cultural ES).
Another key criterion, although not yet often made explicit in our case studies, relates to whether ES indicator development and appli- cation isaffordableorcost effective(Brown et al., 2014; Hauck et al., 2016). The more difficult, data intensive or time consuming it is to select or calculate an indicator, the less realistic it might become for a project to ultimately consider using this indicator, especially when the assessment aims to be repeatable
Afinal criterion that would be useful to consider is whether the indicator is flexible to adapt for future challenges, or mutable as dubbed by theUK NEA (2011). An indicator might score high on the CSL categories, but might no longer be relevant in future realities as meanings, values and people’s behaviours change in response to eco- nomic, technological, social, political and cultural drivers. When an indicator is mutable, it should be able to be revisited and changed if required, to still be relevant to decision makers. There are obvious potential trade-offs with comparability with other assessments, as well as data availability and credibility, and we therefore call for revisiting rather than replacing the indicator when no longer relevant.
4. Conclusion: Consider credibility, salience, legitimacy, and feasibility from the onset
Many criteria for developing ES indicators currently applied in practice and literature match the CSL categories ofCash et al. (2003) well. In addition, some criteria relate more to feasibility (F), reflecting the important practicality aspects in the process of indicator generation and selection. We hence propose this fourth category to complement
and embed the classic CSL categories, as they often seem to produce indicator sets which are unachievable in practice. The‘F’factor seems at least as critical as the others when it comes to developing indicators.
CSLF criteria are interrelated, and when applied to real case studies, trade-offs and synergies among them appear (c.f.Cash et al., 2003). The following examples show the considerable challenge to balance in- dicator requirements from the decision-making point of view and from that of the developer. For instance, the purpose of an assessment de- termines accuracy and reliability needs, which relates to credibility. A high level of accuracy will be needed if an assessment purpose is liti- gation, priority setting or policy instrument design, while awareness raising purposes will require lower accuracy but higher salience (Schröter et al., 2015; Jacobs et al., 2017). The intended audience also needs to be specified, before or during an iterative process of evaluating ES indicators according to salience and legitimacy aspects. Studies
aiming to developing transferable ES indicators may run into problems with ensuring salience as this often requires ES indicators to be speci- fically attuned to the policy issues at stake. Also, data availability can be further compromised if decision makers or experts doubt the validity and reliability of the data source (e.g.Drakou et al., 2017). Further- more, efforts to meet criteria on credibility, salience and legitimacy sometimes increase costs and data needs, which trade offwith criteria relating to feasibility. Similarly, adding complexity to increase cred- ibility might be at odds with comprehensibility (Rieb et al., 2017).
It stands out that development offit-for-purpose indicators requires careful consideration and balancing of CSLF criteria for each context.
Realizing this requires combining scientific knowledge, communication skills, policy and governance insights as well asfield actor experience.
To aid generation and selection of effective indicators which will sur- vive beyond a one-time academic quantification and inform actual
Fig. 2.Checklist to consider when developing ES indicators. The order of the checklist items does not represent levels of priority or chronology.