10.32565/aarms.2021.2.8
Charting Possible Performance Indicators Related to Digital Learning Content
Supported Learning
1Péter BALKÁNYI
2¤During my professional carrier, I participated in several digital content development projects, and in my doctoral dissertation I examined the ecosystem of e-learning development according to the Design Science (DS) methodology.
Partly from the practical experience, partly from the comprehensive research, I perceived that few indicators – which can be applied in practice – were determined about the effectiveness and efficiency of a digital learning content development process.
Traditionally, projects can be evaluated by the ‘iron triangle’: the project is completed on time, within budget in right quality. This approach is not fundamentally wrong, but as several studies point out, it does not provide a complete picture, can even lead to false conclusions, and can determine wrong decisions.
The present work aims to focus specifically on the e-learning content created as a product of professional authoring tools (e.g. the end result is a SCORM standard package). This paper does not seek to take into account the whole development process. In addition to the focus on the content development, it is also important to underline that the background of these findings is in adult learning environments in large or multinational corporations.
In this article, I summarise the key technological, methodological and financial indicators (both key performance indicators and key result indicators) for the learner- and content-centred e-learning materials. Together, these indicators can form a system that gives the opportunity to evaluate and compare e-learning materials in its complexity.
Keywords: e-learning, curriculum development, digital curriculum, performance indicator, result indicator, indicator system
1 This paper is supported by the ÚNKP-19-3-III-BCE-36 New National Excellence Program of the Ministry of Innovation and Technology.
2 Corvinus University of Budapest, Teacher Training and Digital Learning Centre, e-learning expert; e-mail:
peter.balkanyi@uni-corvinus.hu
Introduction
Explaining the scope of the study and setting its limitations
The author has been involved in many digital learning content development projects in his professional life. Applying this practical experience and relevant comprehensive research, it has been found that objective indicators have been rarely defined or are simply missing in the literature to measure the effectiveness and efficiency of digital learning content development. Traditionally, projects are evaluated based on the Iron Triangle: a successful project is 1. completed on time; 2. remains within budget; and 3. has good quality results.
This approach is not fundamentally wrong, but as several studies point out, it does not give a complete picture and can even lead to off-key decisions.3
This article focuses specifically on digital learning content (such as the SCORM package) – created as a result of digital curriculum development. Such a content is usually the result of a complex development process, which in its entirety can be interpreted, e.g. in a complex curriculum development ecosystem. This article focuses specifically on metrics for the digital learning content and metrics of the digital learning content development process. In addition to the limit of focusing on the content, the study scope is limited to adult education in large organisations (by definition: ‘having at least 100 employees, running independent human resources services and typically over HUF 1 billion in revenue or operating costs’).4
In the author’s thesis5, which is the background of this article, the complex ecosystem of the development of digital learning content has been studied according to the Design Science (DS) methodology.6 In summary, in this article, as a follow up to the doctoral thesis research work, the aim is to define and to identify 1. technology; 2. methodology;
and 3. business-based key indicators, measuring objectively learner and content-centric (LC + CC) digital learning. A set of such indicators form a system, that could be used to evaluate individual digital learning content items and also to compare different digital learning content sets. The technological and methodological aspects concern quality and performance characteristics and can be considered key performance indicators (KPIs), the business indicators will be key result indicators (KRI) and these will allow the comparison of alternative development trails to training solutions.
3 Roger Atkinson, ‘Project management: cost, time and quality, two best guesses and a phenomenon, its time to accept other success criteria’, International Journal of Project Management 17, no 6 (1999), 337–342; Paul D Gardiner and Kenneth Stewart, ‘Revisiting the golden triangle of cost, time and quality: the role of NPV in project control, success and failure’, International Journal of Project Management 18, no 4 (2000), 251–256;
Danie van der Westhuizen and Edmond P Fitzgerald, ‘Defining and measuring project success’, Proceedings of the European Conference on IS Management, Leadership and Governance, 7–8 July 2005, 157–163.
4 Péter Balkányi, Az e-learning tananyagfejlesztés ökoszisztémájának Design Science módszertan szerinti vizsgálata (Doctoral thesis, Budapesti Corvinus Egyetem, 2019), 5.
5 Ibid.
6 Alan Hevner, Salvatore T March, Jinsoo Park and Sudha Ram, ‘Design Science in Information Systems Research’, MIS Quarterly 28, no 1 (2004), 75–105; Alan Hevner and Samir Chatterjee, Design Research in Information Systems: Theory and Practice (Springer, 2010).
Applied methodology
In this research a set of qualitative methods have been used: 1. processing literature;
2. empirical data collection; and 3. analysis based on action research and observation.
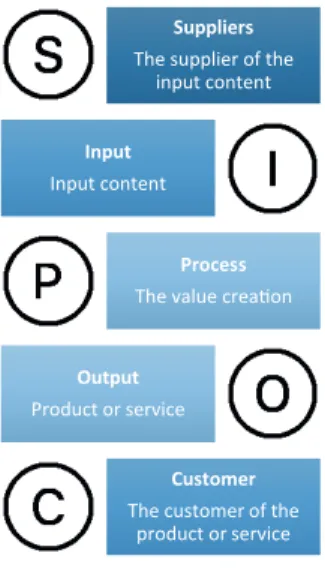
‘Observation is a directional perception – on the basis of which we reach some conclusion.’7 During the research the ‘participatory – unstructured’ type of observation method was used. Such an observation is not preliminary planned, constructed; it is defined as an iterative, informal process.8 During the research, validation of individual observations and results was checked by triangulation investigations. Thanks to triangulation, the different aspects of qualitative research might be reinforced, complemented and the boundaries of methodology are more clearly visible.9 To develop the set of indicators, the author relies on the SIPOC method, which is a Six Sigma tool for high-level mapping of a development process.10 Figure 1 introduces the acronym SIPOC: ‘Suppliers’, ‘Input’,
‘Process’, ‘Output’ and ‘Customer’. This tool is primarily used to map the process of curriculum development at a high level. This is an appropriate tool to build indicators, as the Six Sigma methodology (developed by Motorla in the 1980s) is a bridge between the business world (being practice-oriented) and the (typically highly standardised) world of quality assurance. Applying SIPOC has been proved to develop sets of 1. critical success factors; 2. critical quality factors; and 3. key metrics.11
After SIPOC mapping, the next step in building the set of indicators applies the so-called
‘business model canvas’ (BMC),12 adapted as the ‘lean canvas (LC) model’.13 Although LC is typically used in the start-up world, in this study it provides a useful framework, because it has the approach to key metrics – in comparison to BMC. Based on these frameworks, a ‘canvas’ is created reflecting the digital learning ecosystem (hereinafter: ‘canvas’), specifically to create KPIs related to digital learning content development.
7 Ágnes Szokolszky, Kutatómunka a pszichológiában (Budapest: Osiris Kiadó, 2004), 250.
8 Jan Savage, ‘Participative Observation: Standing in the Shoes of Others?’, Qualitative Health Research 10, no 3 (2000), 324–339; Szokolszky, Kutatómunka.
9 Kálmán Sántha, ‘A kvalitatív metodológiai követelmények problémái’, Iskolakultúra 17, no 6–7 (2007), 168–
177.
10 Pedro A Marques and José G Requeijo, ‘SIPOC: A Six Sigma tool helping on ISO 9000 quality management systems’, 3rd International Conference on Industrial Engineering and Industrial Management, 2–4 September 2009, 1229–1238.
11 Ayon Chakraborty and Kay Chuan Tan, ‘Case study analysis of Six Sigma implementation in service organisations’, Business Process Management Journal 18, no 6 (2012), 992–1019; Brahim Sabir, Bouzekri Touri and Mohamed Moussetad, ‘Using the Integrated Management System and Approach SIPOC in Higher Education for the Evaluation and Improving the Quality of Life of Students’, The Online Journal of Quality in Higher Education 2, no 3 (2015).
12 Manuel Au-Yong Oliveira and João José Pinto Ferreira, ‘Business Model Generation: A Handbook for Visionaries, Game Changers and Challengers, Book Review’, African Journal of Business Management 5, no 7 (2011), 22–30.
13 Ash Maurya, Running Lean : Iterate from Plan A to a Plan that Works (Sebastopol, CA: O’Reilly, 2012).
Suppliers The supplier of the
input content
Input Input content
Process The value crea�on
Output Product or service
Customer The customer of the
product or service
Figure 1: SIPOC model
Source: Compiled by the author based on Marques and Requeijo, ‘SIPOC: A Six Sigma tool’.
Table 1: Lean Canvas model Key partners
Problems Key activities
Solutions Value proposition Customer service
Unfair benefits Customer segments Key resources
Key metrics Channels
Budget Revenue
Source: Compiled by the author based on Maurya, Running Lean.
As Table 1 shows, in case of applying LC, mapping key metrics and linking to a specific problem/solution is already inherent in the planning phase. Following the literature review, a canvas is presented for the systematic exploration of metrics related to digital learning content development in section Identifying key performance indicators.
Literature review
The following is an overview of the ecosystem of digital learning content development and the curriculum within which the metrics and indicators are interpreted, given the length constraints of this article. In addition, the theoretical frameworks for indicator systems is also explained. The relevant IT environment is reviewed, including the underlying pedagogical and business approaches, all helping to develop more accurate metrics.
The ecosystem of digital learning content development
Based on nearly a decade of experience in developing digital learning content and research, the author sees that there is no single, well-defined and measurable indicator neither for evaluating increasingly widespread and complex digital learning content, nor for the (by digital learning content supported, e.g. blended) training systems. This is the reason to carry out a research that can be applied in practice, which can serve as a basis for the objective evaluation and quality assurance of digital curricula both at the design and final product evaluation stages, based on the Design Science (DS) approach. This approach proved to be, on the one hand, highly pragmatic, containing innovative, practical ICT solutions, on the other hand, it is a scientific methodology.
As a paradigm, the author suggests an ‘ecosystem of digital learning development’
based on the definition of a business ecosystem of James F Moore’s (1996) approach.
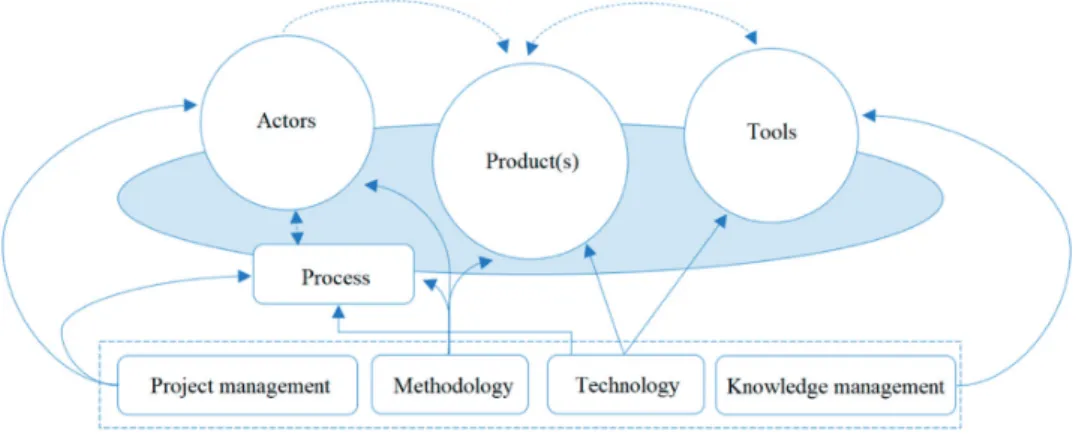
Such an ecosystem is driven by the interaction of organisations and individuals through the creation of goods and services where actors evolve together. Based on the previously referred thesis work, the ecosystem of digital learning development is structured as shown in Figure 2 below.
Figure 2: Digital learning development ecosystem
Source: Compiled by the author.
The main components of the ecosystem shown in Figure 2 are: process, products, actors, tools. The interplay of these components and the constantly renewing content and formal elements lead to the construction of a solution (e.g. digital learning content). Continuously interacting elements are also moved by internal cycles and ‘ultimately produce a stable product as output at a given moment’.14 Further on, these components are externally influenced by the theory and practice of: project management, pedagogical methodology, information and communication technology (ICT), knowledge management. These two
14 Balkányi, Az e-learning tananyagfejlesztés, 69.
layers provide both a scientifically appropriate and a practical approach to the learning content developing ecosystem.
Learner and content-centric digital learning
Among the conceptual definitions, it is essential to define precisely what is called ‘digital learning content’ in this research. According to literature,15 in the boarder context of digital learner and content centric (LC + CC) learning the term ‘digital learning content’
is applied as meeting the following criteria:
The content of the digital learning system
• uses a mixture of proofread content types of differing media
• is methodologically and technologically flawless
From the point of view of the design of the digital learning content:
• is modular and designed for on-screen learning
• is easy-to-use and applies intuitive interfaces
• is spectacular (e.g. multimedia content) and interactive In terms of the learning process:
• allows differing, individualized learning paths
• applies a frame story and / or co-learner and a captivating start16
In this article an evaluation framework is presented for digital learning content that meets (at least the majority of) the above listed criteria.
Performance and indicators
Performance evaluation and measurement is a long-standing and widely researched area.
This paper does not intend to contribute to the general scientific debate in this area, but it is important to define the relevant essential elements in relation to performance metrics of
15 Joanne Capper, ‘E-Learning Growth and Promise’, TechKnowLogia 2, no 2 (2001), 7–10; Eddie Blass and Ann Davis, ‘Building on solid foundations: establishing criteria for e-learning development’, Journal of Further and Higher Education 27, no 3 (2003), 227–245; Virginio Cantoni, Massimo Cellario and Marco Porta, ‘Perspectives and challenges in e-learning: towards natural interaction paradigms’, Journal of Visual Languages & Computing 15, no 5 (2004), 333–345; Ming-Chi Lee, ‘Explaining and predicting users’
continuance intention toward e-learning: An extension of the expectation–confirmation model’, Computers
& Education 54, no 2 (2010), 506–516; Peter M Sinclair, Ashley Kable, Tracy Levett-Jones and Debbie Booth, ‘The effectiveness of Internet-based e-learning on clinician behaviour and patient outcomes:
A systematic review’, International Journal of Nursing Studies 57 (2016), 70–81; Balkányi, Az e-learning tananyagfejlesztés.
16 Balkányi, Az e-learning tananyagfejlesztés, 39.
the specific domain of digital learning content and learning. The chosen methodology is based on David Parmenter’s work Key Performance Indicators.17
Parmenter describes four categories of indicators: 1. result indicators (RI); 2. Key result indicators (KRI); 3. performance indicators (PI); and 4. Key performance indicators (KPIs). Of these categories, this article focus is on KRIs and KPIs.
For KRIs, financial and non-financial indicators can be developed. Typically, KRIs summarise events, the quantities measures are not for decision-making, but displaying aggregated results for multiple events. KPIs are typically non-financial, but they are also predictive, have a decision support role and focus on specific events. Parmenter further emphasises that KPIs differ most from simpler performance indicators in that they continually scrutinise critical success factors to enable management to intervene and increase performance. Parmenter identifies seven features in the context of KPIs:
KPI-s are
1. non-financial
2. continuously measurable 3. management focused 4. simple
5. team oriented
6. KPIs have a serious impact
7. are encouraging to take the right action18
KRIs summarise on key issues, while KPIs are related to strategic decision-making for organisations. These ‘textbook’ definitions are also worth considering at the practical level and are to be applied not only to an entire organisation, but specifically when designing a rating system for a ‘product’ (here for the ‘digital learning content’). For example,
‘continuous measurability’, ‘simplicity’ or ‘encouraging to take action’ are all proven practice-oriented aspects.
Technology, methodology and business framework for evaluation
In order to develop specific indicators, it is worthwhile to recall the evaluation systems associated with the training environment, as the digital learning content appears in this context. In a corporate environment, Kirkpatrick (1977) uses a four-level evaluation system (or individual solutions based on these): 1. evaluation of reactions; 2. evaluation of learning; 3. evaluation of change; 4. evaluation of long-term results. This is complemented by a fifth aspect by Philips: 5. return on investment.19 Shelton (2010) developed a 70-item index system that evaluates distance learning programs in higher education. This index
17 David Parmenter, Key Performance Indicators: Developing, Implementing, and Using Winning KPIs (John Wiley & Sons, 2015).
18 Ibid. 12.
19 Dominique L Galloway, ‘Evaluating Distance Delivery and E-Learning: Is Kirkpatrick’s Model Relevant?’, Performance Improvement 44, 4 (2005), 21–27.
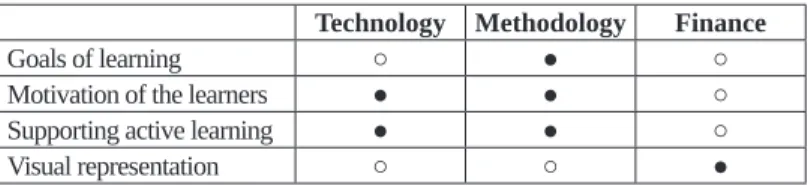
system is an explicitly diverse contribution to the current research. The author’s own research20 tells that ‘in addition to evaluating the training and distance learning system, the technology aspects can be evaluated by the user attitudes based on the Technology Acceptance Model (TAM)’21 criteria that take into account social and environmental impacts and support the learner.22 The student perspective was examined by Jung (2011) and, based on his research, reached the level of digital curriculum by Busstra (2007) and Diederen (2003). These sources together suggest that the following are the most important aspects of evaluations: ‘1. meeting learning objectives; 2. developing and maintaining student motivation; 3. active learning and learner support; 4. a visual representation of the curriculum that encourages and supports the previous points.’23
Table 2: Relationships among the different evaluation criteria Technology Methodology Finance
Goals of learning ○ ● ○
Motivation of the learners ● ● ○
Supporting active learning ● ● ○
Visual representation ○ ○ ●
Note: ○: weak connection; ●: strong connection
Source: Compiled by the author.
Perhaps the most important issue from the learning perspective is the use of the pedagogical methodology itself, which, in its complexity, is often inadequately used in the development of digital learning content. To summarise the methodological aspects, it is worthwhile to start summarising the expectations of the digital learning content from a wider context.
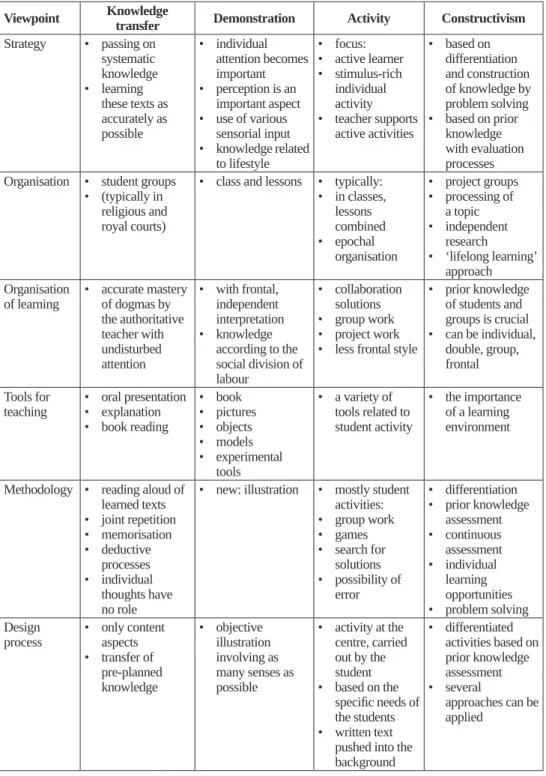
István Nahalka in his book How Does Knowledge Develop in Children? Constructivism and Pedagogy,24 based on ideas of Aebli (1951), writes about three approaches to learning, about three theoretical systems for pedagogy: 1. pedagogy of words and books (knowledge transfer); 2. pedagogy of demonstration; 3. pedagogy of activities. Related to this, there is one more approach, 4. constructivism, which states that ‘…knowledge will not be the knowledge of one in the process of mediation but will be created and constructed by himself. […] Cognition is an active […] process. […] The basic idea of constructivism is to acquire new knowledge on the basis of our existing knowledge’ – as stated by Nahalka.25 Table 3 below summarises the comparison between the four approaches.
20 Balkányi, Az e-learning tananyagfejlesztés.
21 Ibid. 41.
22 Csedő et al., ‘Online képzési stratégiák és módszerek a közszolgálati továbbképzésekben’, Információs Társadalom 14, no 1 (2014), 9–28.
23 Balkányi, Az e-learning tananyagfejlesztés, 42.
24 István Nahalka, Hogyan alakul ki a tudás a gyerekekben? Konstruktivizmus és pedagógia [How Does Knowledge Develop in Children? Constructivism and Pedagogy] (Budapest: Nemzeti Tankönyvkiadó, 2002).
25 Ibid. 81.
Table 3: Comparison of pedagogical theoretical systems Viewpoint Knowledge
transfer Demonstration Activity Constructivism Strategy • passing on
systematic knowledge
• learning these texts as accurately as possible
• individual attention becomes important
• perception is an important aspect
• use of various sensorial input
• knowledge related to lifestyle
• focus:
• active learner
• stimulus-rich individual activity
• teacher supports active activities
• based on differentiation and construction of knowledge by problem solving
• based on prior knowledge with evaluation processes Organisation • student groups
• (typically in religious and royal courts)
• class and lessons • typically:
• in classes, lessons combined
• epochal organisation
• project groups
• processing of a topic
• independent research
• ‘lifelong learning’
approach Organisation
of learning • accurate mastery of dogmas by the authoritative teacher with undisturbed attention
• with frontal, independent interpretation
• knowledge according to the social division of labour
• collaboration solutions
• group work
• project work
• less frontal style
• prior knowledge of students and groups is crucial
• can be individual, double, group, frontal Tools for
teaching • oral presentation
• explanation
• book reading
• book
• pictures
• objects
• models
• experimental tools
• a variety of tools related to student activity
• the importance of a learning environment
Methodology • reading aloud of learned texts
• joint repetition
• memorisation
• deductive processes
• individual thoughts have no role
• new: illustration • mostly student activities:
• group work
• games
• search for solutions
• possibility of error
• differentiation
• prior knowledge assessment
• continuous assessment
• individual learning opportunities
• problem solving Design
process • only content aspects
• transfer of pre-planned knowledge
• objective illustration involving as many senses as possible
• activity at the centre, carried out by the student
• based on the specific needs of the students
• written text pushed into the background
• differentiated activities based on prior knowledge assessment
• several
approaches can be applied
Source: Compiled by the author based on Nahalka, Hogyan alakul ki a tudás a gyerekekben?
These four approaches, which can be considered the conceptual development of understanding learning, are also particularly important because, as viewed by the author, the development paths of digital learning content followed partly the same steps and it is worth reflecting on these similarities. One might expect that digitalisation is dominated by the ‘pedagogy of action’ or ‘constructivist approaches’, involving many communication and collaboration tools, but reality is far from this.
Table 4: Theoretical pedagogical systems and digital learning materials Theoretic
framework of
pedagogy Digital learning content
Knowledge
transfer Learning contents that typically have a strong textual predominance are in many cases simply distributed in the form of pdf or lecture files. In fact, those are electronic forms of books. (By my definition, these are not digital learning materials, see section Learner and content-centric digital learning, but in many cases, they are also seen as e-learning content.)
Demonstration Simple forms of digital learning material are mostly based on ‘next-next-next’ clicking, scrolling. Illustrations already appear, the visual representation is richer and multimedia content (e.g. video) support the learner. Optionally, narration is also associated with the curriculum, typically in the form of reading aloud on-screen text. This might include on-screen video content, e.g. for software education. In some respects, individual learning pathways may already appear, but their really deep application would already presuppose the appearance of a teacher, mentor, tutor, which is (usually) more typical at the next level.
Activity In the case of action pedagogy, the joint creation of complex interactions and products between and by students and teachers supports a truly in-depth learning. Thus, in addition to the digital teaching materials, a special emphasis should be placed on the course management and on the teacher himself. These include digital learning materials that support individual learning paths and/or that are interactive (where appropriate:
gameful) content. There are decision-making situations for students, and quizzes and tests that assess their knowledge and provide immediate feedback, that can complement learning. Software simulations can be included here, where the learner is not only a passive recipient, but can also try out the given software on the interface of the digital learning tool. Complex learning materials also appear here, which, through simulations, adapt the learning process, based on students’ decisions, and in addition, a powerful peer- to-peer communication and collaboration approach is created.
Constructivism As ‘constructivism’ differs from the means of reforming the ‘pedagogy of action’
less methodologically than in its conception of learning, we can typically reflect on a constructivist approach rather on the embedding of that curriculum in a learning environment, than on the curriculum, itself. According to this approach, the learning process is essential, the material can be even very simple. In this case, we definitely want to reach out to the existing knowledge of the learner and support the construction of knowledge with the help of communication and collaboration solutions.
Source: Compiled by the author.
Based on the above outlined ‘four aspects’ approach, the suggested pedagogical methodology elements (PME) are the following:
1. PME, fulfilment of learning objectives: Assuming that the digital learning content is well-defined from the perspective of the objectives to achieve, it is expected that
(from the methodological point of view) the input requirements should be clear and the digital learning content should reflect to the defined output requirements.
2. PME, developing and maintaining student motivation: Various schools offer different solutions to develop and maintain student motivation. Due to the limited length of this paper, only some of the cornerstones of the ‘gameful learning’ trends are highlighted here.26 This method focuses on the importance of intrinsic motivation based on self- determination theory (SDT). SDT takes into account three needs: 1. autonomy;
2. relatedness; and 3. competence.27
3. PME, active learning and active learner support: The pedagogy of action and/or constructivist approach to school can be formulated as a requirement to develop a kind of learner-generated, actively created, self-generated knowledge that is generated by inter alia, the interaction of digital content and the environment.28
4. PME, visual appearance of teaching materials: From the methodological point of view, this is probably the least affected area. The digital learning content is expected to have a visual appearance that fits the pedagogical concept well. The concept is based on the pedagogical methodology (e.g. by having or not a frame story), and it is influenced by the issue of addressing (e.g. a ‘thee-ing and thou-ing’ content requires a completely different visual than another one, using ‘you’ for ‘thou’).
Creating a visual theme should be also inherently influenced by the subject (e.g. there are completely different visual solutions for a ‘job safety and fire protection’ digital learning content than for a ‘product knowledge’ or ‘soft skills’ related content).
In order to be able to evaluate a completed digital learning content from an information technology (ICT) point of view, it is worth summarising what can be expected from such an assessment point of view:
1. ICT, achieving learning objectives: In this context, the ‘invisibility’ of technology is the basic requirement, that is, problem-free operation and IT support. For example, function buttons work, do not get stuck on a screen, individualised learning paths work, etc.
2. ICT, developing and maintaining student motivation: The proper functioning of the digital learning content is essential for maintaining proper (internal) motivation.
This can be further supported with technological solutions aimed at improving the students’ confidence of their own ICT competency, i.e. using easy-to-use (intuitive) interfaces. There should be individual learning paths, interaction opportunities and scoring solutions. Motivation is further maintained by multiple technology solutions combined within a single material. For example, subtitling videos, downloadable audio, etc.
26 Dichev et al., ‘From Gamification to Gameful Design and Gameful Experience in Learning’, Cybernetics and Information Technologies 14, 4 (2015), 80–100.
27 Richard M Ryan and Edward L Deci, ‘Self-Determination Theory and the Facilitation of Intrinsic Motivation, Social Development, and Well-Being’, American Psychologist 55, no 1 (2000), 68–78.
28 István Nahalka, ‘Konstruktív pedagógia-egy új paradigma a láthatáron (I.)’, Iskolakultúra 7, no 2 (1997), 21–33.
3. ICT, active learning and active learner support: The design of the interface should encourage the learner to be active, to systematise his/her own thoughts, and to be able to implement solutions that require high interactivity. In addition, there should be help and references supporting the use of the digital learning content at the level of the material’s technical frame.
4. ICT, visual appearance of the digital learning content: In terms of ICT solutions, the digital learning content should use the most advanced visual appearance currently available. An example is, at time of this article, the mobile-friendly (responsive) appearance. All technologies should be applied that provide a ‘fashionable’ look, interaction and animation.
In addition to pedagogical and technological approaches, business and financial expectations (BFE) can be formulated as follows:
1. BFE, achieving learning objectives: Mapping learning objectives should be such an item within the budget for a digital learning content development that should be proportionate. Experience has shown that in most cases, accurate definition of objectives is not achieved, as fuzzy objectives might keep implementation costs lower. This is, however, a wrong approach, because work (e.g. a survey of demands) invested at this stage eases significantly the manufacturing process, and, even more so, it pays back in terms of the effectiveness of the digital learning content.
2. BFE, developing and maintaining student motivation: The relevant business indicator requirement should be a measure of whether methodologically sound and technologically feasible developments (e.g. individual learning paths, gamifying assignments, etc.) are satisfactory or they are exaggerated from cost-effectiveness perspective.
3. BFE, active learning and active learner support: Active learner support should be available as a professional service, in terms of consulting opportunities (even online) – as related to the digital learning content. Here, you can expect to have a digital learning process support service with limited contact hours.
4. BFE, visual appearance of the curriculum: The visual appearance, although it involves many methodological and technological aspects, becomes a financially limiting issue for most digital learning content development projects. Expect a digital learning content design to ensure the development of a user interface’s framework appropriate to the project budget limitations (e.g. basic or advanced image design).
After reviewing the frameworks and expectations, in the followings, the development of a concrete system of indicators will be presented.
Identifying key performance indicators
Following a summary of the theoretical background, this section presents the research leading to key performance and result indicators. As explained above, the work was based on the action research strategy (which is an active participatory, hands-on research
approach29 and applied Rapoport30 insights: in a cyclical research process created by continuous feedback.31
The process of developing digital curricula
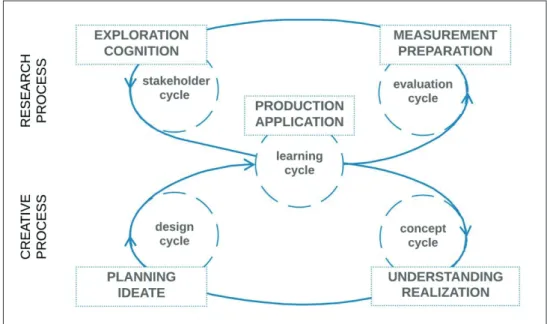
Regarding the process of digital learning content development, the measurement toolkit described is based on the five-cycle curriculum development model32 shown in Figure 3.
Figure 3: Five-cycle digital learning content development process
Source: Balkányi, Az e-learning tananyagfejlesztés.
An essential element of this model is that it looks at a digital learning content in development process embracing a complex life cycle. In this study a new, complex set of criteria is created, in connection with the ‘Measurement, preparation’ phase. The (to this phase) associated evaluation c ycle already includes the preparation of the next development elements as well.
29 Clem Adelman, ‘Kurt Lewin and the Origins of Action Research’, Educational Action Research 1, 1 (1993), 7–24; Hilary Bradbury-Huang, ‘What is good action research? Why the resurgent interest?’, Action Research 8, no 1 (2010), 93–109.
30 Robert N Rapoport, ‘Three Dilemmas in Action Research: With Special Reference to the Tavistock Experience’, Human Relations 23, no 6 (1970), 499–513.
31 Robert S Kaplan, ‘Innovation Action Research: Creating New Management Theory and Practice’, Harvard Business School, 1998.
32 Balkányi, Az e-learning tananyagfejlesztés.
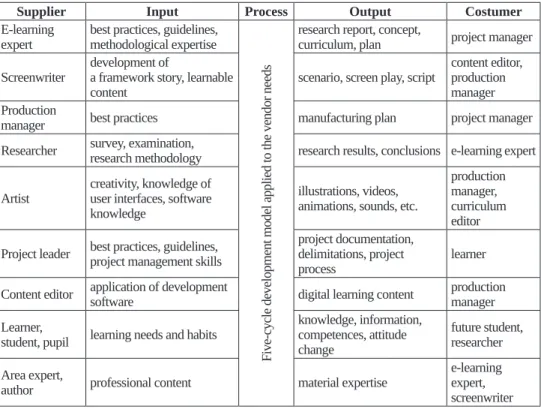
To explore the details of the above process, the SIPOC model helped to map out the entire development process. SIPOC’s elements provided the dimensions for metrics.
Table 5: SIPOC table for e-learning curriculum development
Supplier Input Process Output Costumer
E-learning
expert best practices, guidelines, methodological expertise
Five-cycle development model applied to the vendor needs
research report, concept,
curriculum, plan project manager Screenwriter development of
a framework story, learnable
content scenario, screen play, script content editor,
production manager Production
manager best practices manufacturing plan project manager
Researcher survey, examination,
research methodology research results, conclusions e-learning expert
Artist creativity, knowledge of user interfaces, software knowledge
illustrations, videos, animations, sounds, etc.
production manager, curriculum editor Project leader best practices, guidelines,
project management skills
project documentation, delimitations, project
process learner
Content editor application of development
software digital learning content production
manager Learner,
student, pupil learning needs and habits knowledge, information, competences, attitude change
future student, researcher Area expert,
author professional content material expertise e-learning
expert, screenwriter Source: Compiled by the author.
Table 5 summarises the SIPOC model of the entire development process. During the research, the inputs, the sub-processes and the outputs related to the customers for each supplier were each one by one analysed. Typically, the SIPOC model provides guidance at this point in the development of KPIs by mapping and untangling sub-streams. This was supplemented by a canvas model, which, firstly, provides additional help to unravel the sub-process and secondly, provides a framework for the systematic exploration of different evaluation aspects.
Create metrics by defining frameworks
Sub-processes, explored using the SIPOC model, provide a framework for creating the canvas. (Due to length limits of this paper, these will not be shown in full details.) Three main, pre-planned directions formed the main categories of analysis: 1. methodology;
2. technology; and 3. business. Applying the methodological aspects established in section Technology, methodology and business framework for evaluation, the first, base set will be participant goals (SIPOC: customers), while from the second, the technological point
of view, the operators’ goals (SIPOC: suppliers) orient the investigation. Step 3 is setting business goals connected to the process (SIPOC: process elements).
The key issue for these three metrics is to understand what a particular customer wants, what the operating vendor wants and what the business wants. Metrics should catch also the added value associated with these goals through the digital learning content development.
All individual metric must be specific and measurable. This also means that some goals might need more than one metric, so that it can be fully ‘grasped’, ultimately forming a complex specific indicator (performance or result). The input and output elements of the SIPOC model helped with this.
For each of the three main categories (methodology, technology, business) the individual actors were individually analysed. Then, within the three categories, four expectation factors (teaching purpose, motivation, activity, presentation) were studied. Altogether, a set of 88 measurable goal- and value-criteria propositions were determined. For this systematic collection, a canvas shown in Table 6, was created, which is a revision of the
‘lean canvas’ presented in section Applied methodology.
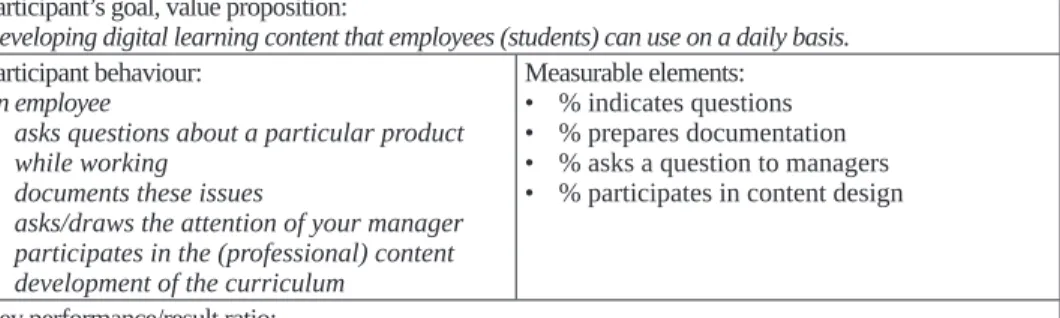
Canvas design: an example
Table 6 below shows a sample for a methodological category. The starting point is given by the participating actors: in this case, the measurable elements are displayed, that quantify the behaviour of the learner – focusing on the curriculum development process.
Table 6: Sample methodological canvas Participant’s goal, value proposition:
Developing digital learning content that employees (students) can use on a daily basis.
Participant behaviour:
An employee
• asks questions about a particular product while working
• documents these issues
• asks/draws the attention of your manager
• participates in the (professional) content development of the curriculum
Measurable elements:
• % indicates questions
• % prepares documentation
• % asks a question to managers
• % participates in content design
Key performance/result ratio:
Digital Learning Content Development Involvement Index: the proportion of employees involved in curriculum development and the development of organisational knowledge.
Source: Compiled by the author.
In this case, it may be informative for the organisation how many people are involved in developing organisational knowledge. The indicator is called the Curriculum Development Engagement Index – CDEI. Similarly, other new metrics have been developed, expressed as tangible KPIs.
Indicator system
The canvas design, resulting in a systematic study, identified over 100 measurable elements.
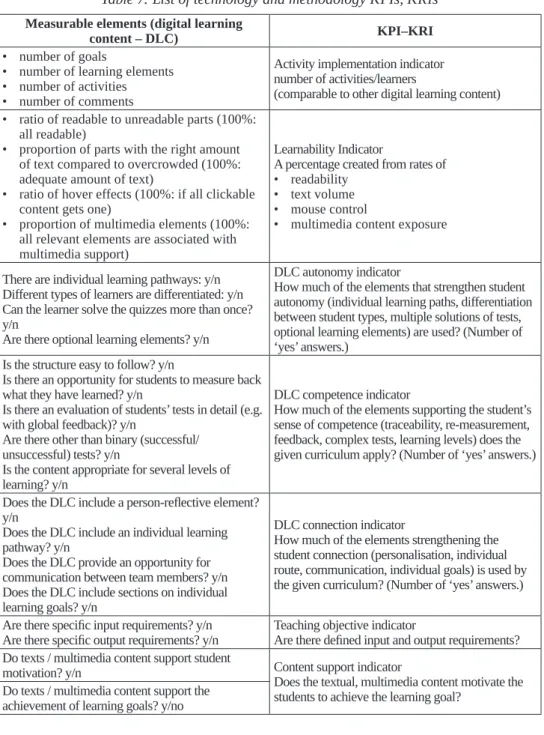
Nearly 30 KPIs and KRIs have been constructed using the elements.
Table 7: List of technology and methodology KPIs, KRIs Measurable elements (digital learning
content – DLC) KPI–KRI
• number of goals
• number of learning elements
• number of activities
• number of comments
Activity implementation indicator number of activities/learners
(comparable to other digital learning content)
• ratio of readable to unreadable parts (100%:
all readable)
• proportion of parts with the right amount of text compared to overcrowded (100%:
adequate amount of text)
• ratio of hover effects (100%: if all clickable content gets one)
• proportion of multimedia elements (100%:
all relevant elements are associated with multimedia support)
Learnability Indicator
A percentage created from rates of
• readability
• text volume
• mouse control
• multimedia content exposure
There are individual learning pathways: y/n Different types of learners are differentiated: y/n Can the learner solve the quizzes more than once?
y/nAre there optional learning elements? y/n
DLC autonomy indicator
How much of the elements that strengthen student autonomy (individual learning paths, differentiation between student types, multiple solutions of tests, optional learning elements) are used? (Number of
‘yes’ answers.) Is the structure easy to follow? y/n
Is there an opportunity for students to measure back what they have learned? y/n
Is there an evaluation of students’ tests in detail (e.g.
with global feedback)? y/n
Are there other than binary (successful/
unsuccessful) tests? y/n
Is the content appropriate for several levels of learning? y/n
DLC competence indicator
How much of the elements supporting the student’s sense of competence (traceability, re-measurement, feedback, complex tests, learning levels) does the given curriculum apply? (Number of ‘yes’ answers.)
Does the DLC include a person-reflective element?
y/nDoes the DLC include an individual learning pathway? y/n
Does the DLC provide an opportunity for communication between team members? y/n Does the DLC include sections on individual learning goals? y/n
DLC connection indicator
How much of the elements strengthening the student connection (personalisation, individual route, communication, individual goals) is used by the given curriculum? (Number of ‘yes’ answers.)
Are there specific input requirements? y/n
Are there specific output requirements? y/n Teaching objective indicator
Are there defined input and output requirements?
Do texts / multimedia content support student
motivation? y/n Content support indicator
Does the textual, multimedia content motivate the students to achieve the learning goal?
Do texts / multimedia content support the achievement of learning goals? y/no
Measurable elements (digital learning
content – DLC) KPI–KRI
Is spelling checked? y/n Is the invocation consistent? y/n Do all navigation buttons work? y/n
Do all elements involved in the interaction have a hover effect? y/n
Is the content browsable? y/n Does interactive content work? y/n
Production technology quality indicator
How many of the typical quality indicators of the production process (6 pieces) are implemented?
? % of the student population participated in the survey
? % of key users participated in the survey
Research participation indicator
X % participation of key users in curriculum design Did the key users formulate input goals? y/n
Did the key users formulate learning goals? y/n Did the key users formulate output goals? y/n
Goal setting indicator
Are the input, output requirements and learning goals defined?
• Ratio of completed interactive elements
• Proportion of collaborative tools used
• Time spent studying
• Time spent on tests
• Success rate
• Success/failure rate
• First time success rate of tests
Student activity indicator
X % of use of built-in interactive and/or collaboration solutions
Learning time indicator
a comparative number of planned learning times and actual learning times
Testing efficiency indicator
the proportion of successful tests weighted by the first successful tests
Did the student follow his or her individual learning path? y/n
Did the student find the right content/methodology for their own learning habits? y/n
Did the student solve the test multiple times (in case of failure)? y/n
Did the student choose from the optional items? y/n
Implemented autonomy indicator
How many of the elements supporting autonomy have been achieved during learning?
Is the structure of the content easy to follow? y/n Does the DLC provide an opportunity for students to measure back what they have learned? y/n Does the DLC evaluate students’ tests in detail (e.g.
with global feedback)? y/n
Does the DLC use only binary (successful/
unsuccessful) tests? y/n
Is the DLC appropriate for several types of learning? y/n
Achieved competence indicator
How many of the elements supporting the sentiment of competence have been achieved during learning?
Does the DLC include a person-reflective element?
y/nDoes the DLC include an individual learning pathway? y/n
Does the DLC provide an opportunity for communication between team members? y/n Does the DLC include sections on individual learning goals? y/n
Achieved connection indicator How many of the elements supporting connectedness were achieved during learning?
Measurable elements (digital learning
content – DLC) KPI–KRI
? % of students met the input requirements
? % of students studied the course material (dropout)
? % of students passed the exam
Three levels of dropout:
X % of the target group of students were able to study the material, of which Y % learned and Z % passed the exam successfully.
Dropout rate
number of successful candidates/total target group Source material size
Final DLC size
Part of material that had to be checked and revised
Compression indicator
final curriculum (text) size/source material size Proofreading indicator
number of errors to be corrected/screen
• Number of technologies selected
• Number of aids produced
• Number of comments
Activity planning indicator
percentage of activity-promoting elements among the total learning elements
The difference between the version number of the latest version of an applied technology and the version number of applied technology
Technological freshness indicator
the differences between the applied technology and the latest versions of the given technology available (the closer to 0, the better)
Existence of an application that assesses input and output knowledge. y/n
Teaching objective tool indicator
Are there tools to measure specific input and output requirements?
Does the curriculum have the necessary
‘compulsory’ (title page, closing page, etc.) elements? y/n
Are the instructions clear? y/n
Is the role of the ‘accompanying character’, if any, in the curriculum clear? y/n
Does the DLC help the student with highlighting important information? y/n
Is there an instruction associated with each user interaction? y/n
Transition text is associated with each screen. y/n All screens are arranged (no two overlapping elements, fonts are uniform, the page is transparent).
y/nThe length of the curriculum is in line with the planned learning time. y/n
Tests can be solved based on what has been learned.
y/nThe curriculum summary screen summarises the content of the curriculum appropriately. y/n
Production methodological quality indicator How many of the typical quality indicators of the production process (6 pieces) are implemented?
What types of technology do ‘artists’ use?
Are the various software/result products interoperable? y/n
Technology compatibility indicator the technologies used are X % compatible/
interoperable with learners’ devices Number of software used for curriculum
development.
Percentage of paid and free applications.
Technological environment complexity indicator based on the number of applied technologies, the DLC development projects can be compared
Measurable elements (digital learning
content – DLC) KPI–KRI
Was the student able to walk the individual learning path? y/n
How long did it take the student to complete the curriculum?
Did the student solve the test more than once? y/n Has the student tried any interactions? y/n What percentage of the learning paths did the student follow?
X % of students retried several times.
Completion time indicator
the average indicator of the completion of the curriculum
Curriculum mapping indicator
students mapped X % of the curriculum on average Student activity indicator
number of student clicks, average number of clicks per student
X % of students completed the curriculum.
Y % of students completed the re-measurement.
Students completed the re-measurement with a score of [n].
For question [n], students gave X correct answers.
Curriculum achievement indicator
X % of students have completed the material Student achievement indicator
aggregation of results Correct answer indicator
the ratio of correct and incorrect answers is an indicator
Source: Compiled by the author.
Due to the article’s length limit the following KPIs are highlighted:
1. Learnability Index: A measure constructed from 1. readability; 2. amount of text;
3. mouse control; and 4. percentage of multimedia content.
2. Internal student motivation index: a complex indicator showing the compliance with 13 various criteria supporting student autonomy, competence and connection.
3. Manufacturing Technology Quality Index: A percentage indicator composed of 6 typical quality indicators of the manufacturing process from technology point of view.
4. Manufacturing Methodology Quality Index: A percentage indicator of 10 typical quality indicators of the manufacturing process from pedagogical methodology point of view.
5. Activity Inducing Index: The percentage of activity inducing items among the total learning elements.
Among all the KRIs, including business and other indicators performance indicators, the following are highlighted:
1. Learning Time Index: A comparison of the planned learning time and the actual learning time.
2. Churn Index: Ratio of successful/drop out candidates.
3. Cost of learning time index: The cost structure of the entire digital learning process compared to the total cost structure of attendance training (e.g. travel, room reservation, catering, etc.).
4. Time of ROI Index: A comparison of the added cost of the digital learning content development plus the organisation’s learning time to the difference of attendance and digital learning content supported training costs (learning time, travel time, etc.).
5. Financial Index of Mentoring: The (average) cost of mentoring per person.
As can be seen from the list above, the system of KPIs developed is very diverse, for which it is important to note, that not all indicators can be applied to every digital learning content development. It is advisable to define the indicators during the concept cycle, which can then be systematically measured afterwards throughout the digital learning content development. In the case of financially specific KRIs, it is worthwhile to develop complex, unique indicators that can be determined by the organisation. In the above list, Financial Index of Mentoring is just one example of the possible metrics for the possible quantifier.
Summary and outlook
In this article, the ecosystem of digital learning content development was investigated, outlining a theoretical framework for developing indicators of content and process. An action research strategy was applied, based on the literature review of the theoretical background. The practical research was detailed in the second part of the article, with the introduction of specific indicators. Limitations of length and scope framed results interpretation. This frame is characterised by studying large companies, with many employees or locations. However, the results can also be applied to similar projects in public administration or higher education contexts.
In total, by applying the suggested methodology a wide set of key indicators have been identified to measure the digital learning content development project of various organisations. Having this wide set enables to build unique, case specific mix of these indicators for actual digital learning content development projects.
Just as it is necessary to set specific learning goals during development, so it is necessary to do this for measuring goals. While, on the one hand, this article introduces elements that can be used for these measurement purposes, on the other hand, the described research also opens the door to further research, where the suggested measurements already in practice will validate the actual usefulness or uselessness of each KPI. It would be worthwhile to investigate in detail and in depth the overall measurable indicators of the digital learning content development ecosystem (e.g. the quantitative and qualitative elements of the application of related scientific results). This work has not been completed at the end of this article, as the measurability of the ‘adequacy’ of the training area, and within it, that of the digital learning content-supported solutions, is still undeveloped, while the quality and competitiveness of training in organisations can and should be further enhanced.
References
Adelman, Clem, ‘Kurt Lewin and the Origins of Action Research’. Educational Action Research 1, 1 (1993), 7–24. Online: https://doi.org/10.1080/0965079930010102
Aebli, Hans, Didactique psychologique: Application à la didactique de la psychologie de Jean Piaget. Delachaux et Niestlé, 1951.
Atkinson, Roger, ‘Project management: cost, time and quality, two best guesses and a phenomenon, its time to accept other success criteria’. International Journal of Project Management 17, no 6 (1999), 337–342. Online: https://doi.org/10.1016/S0263- 7863(98)00069-6
Au-Yong Oliveira, Manuel and João José Pinto Ferreira, ‘Business Model Generation:
A Handbook for Visionaries, Game Changers and Challengers, Book Review’. African Journal of Business Management 5, no 7 (2011), 22–30.
Balkányi, Péter, Az e-learning tananyagfejlesztés ökoszisztémájának Design Science módszertan szerinti vizsgálata. Doctoral thesis, Budapesti Corvinus Egyetem, 2019.
Blass, Eddie and Ann Davis, ‘Building on solid foundations: establishing criteria for e-learning development’. Journal of Further and Higher Education 27, no 3 (2003), 227–245. Online: https://doi.org/10.1080/0309877032000098662
Bradbury-Huang, Hilary, ‘What is good action research? Why the resurgent interest?’. Action Research 8, no 1 (2010), 93–109. Online: https://doi.org/10.1177/1476750310362435 Busstra, Maria C, Rob Hartog, Sander Kersten and Michael Müller, ‘Design guidelines for the
development of digital nutrigenomics learning material for heterogeneous target groups’.
Advances in Physiology Education 31, 1 (2007), 67–75. Online: https://doi.org/10.1152/
advan.00090.2006
Cantoni, Virginio, Massimo Cellario and Marco Porta, ‘Perspectives and challenges in e-learning: towards natural interaction paradigms’. Journal of Visual Languages &
Computing 15, no 5 (2004), 333–345. Online: https://doi.org/10.1016/j.jvlc.2003.10.002 Capper, Joanne, ‘E-Learning Growth and Promise’. TechKnowLogia 2, no 2 (2001), 7–10.
Chakraborty, Ayon and Kay Chuan Tan, ‘Case study analysis of Six Sigma implementation in service organisations’. Business Process Management Journal 18, no 6 (2012), 992–1019. Online: https://doi.org/10.1108/14637151211283384
Csedő, Zoltán, Tamás Tóth, András Égler and Zoltán Sára, ‘Online képzési stratégiák és módszerek a közszolgálati továbbképzésekben’. Információs Társadalom 14, no 1 (2014), 9–28. Online: https://doi.org/10.22503/inftars.XIV.2014.1.1
Dichev, Christo, Darina Dicheva, Galia Angelova and Gennady Agre, ‘From Gamification to Gameful Design and Gameful Experience in Learning’. Cybernetics and Information Technologies 14, 4 (2015), 80–100. Online: https://doi.org/10.1515/cait-2014-0007 Diederen, Julia, Harry Gruppen, Rob Hartog, Gerard Moerland and Alphous G J Voragen,
‘Design of Activating Digital Learning Material for Food Chemistry Education’. Chemistry Education Research and Practice 4, no 3 (2003), 353–371. Online: https://doi.org/10.1039/
B3RP90020G
Galloway, Dominique L, ‘Evaluating Distance Delivery and E-Learning: Is Kirkpatrick’s Model Relevant?’ Performance Improvement 44, 4 (2005), 21–27. Online: https://doi.org/10.1002/
pfi.4140440407
Gardiner, Paul D. and Kenneth Stewart, ‘Revisiting the golden triangle of cost, time and quality: the role of NPV in project control, success and failure’. International Journal of Project Management 18, no 4 (2000), 251–256. Online: https://doi.org/10.1016/S0263- 7863(99)00022-8