DOI: 10.1556/606.2018.13.2.13 Vol. 13, No. 2, pp. 129–136 (2018) www.akademiai.com
CORROSION MAP OF ZINC IN SLOVAKIA
1 Miroslav STRIEŠKA, 2 Peter KOTEŠ
1,2 Department of Structures and Bridges, Civil Engineering Faculty University of Žilina, Univerzitná 8215/1, 01026 Žilina, Slovakia e-mail: 1miroslav.strieska@fstav.uniza.sk, 2kotes@fstav.uniza.sk Received 20 December 2017; accepted 19 March 2018
Abstract: The subject of this research was influence of the environmental parameters, like temperature, humidity and pollutants, on the corrosion rate of the zinc protective coating of the steel structural elements. Zinc is usually used to protect those elements against corrosion. The idea was to study the corrosion of zinc in different parts of Slovak Republic in order to create the so-called corrosion map of the country. The corrosion rate of zinc rcorr was calculated according to standard ISO 9223. Results have shown that both the input parameters, as well as the corrosion rate of zinc, are changing with time.
Keywords: Zinc, Corrosion rate, Map, Aggressiveness of the environment, Parameters
1. Introduction
The traffic infrastructure consists of numerous members, which can degrade during their lifetime [1]-[5]. The most endangered members are reinforcements or members made of structural steel. The reinforcement is partially protected in concrete [6], [7], but the structural steel is not protected. This is why the best protection of those members would be using the painting or coating with zinc [8], [9] or PVC. The members of traffic infrastructure can be divided into structural and non-structural members. Zinc is usually applied for protection of members made of structural steel. For example, members are: bridge rails, vehicle parapets, pipes, guard-rails, expansion joints, bearings, road signs and semaphores, gantries, protective frames in front of underpass and others.
Atmospheric pollutions and climate parameters are highly relevant for degradation of materials like zinc, carbon steel, aluminum, copper etc. [10]-[14]. The corrosion rate of zinc rcorr (hereinafter referred to as rcorr,zinc) can be smaller than the corrosion rate of iron or steel. For this reason, the iron or steel can be protected by zinc coating (called galvanizing). Based on the pollution and climate conditions, like sulphur dioxide SO2, chloride ions Cl-, temperature T and relative humidity Rh, the corrosion rate of zinc rcorr,zinc can be calculated according to standard STN EN ISO 9223 [15]. It is obvious that the above mentioned input parameters, as well as the corrosion rate of zinc, are changing over time [16]-[18]. This is why it is useful to know how those parameters are changing during the years [19], which can be seen on the map of aggressiveness of the environment. Knowing the input parameters, it is possible to calculate the corrosion rate of zinc rcorr,zinc and create the corrosion map of zinc in Slovakia.
2. Maps of environment aggressiveness of Slovakia
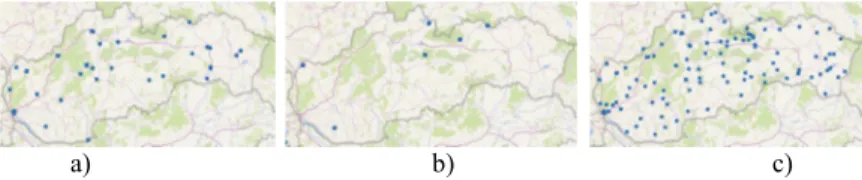
The Slovak Hydrometeorological Institute (SHMÚ) implements the measurements of air pollutants and climate data that are basis for assessment of the air quality. Several measurement stations are placed in the Slovak Republic, in which individual concentrations of atmospheric pollutions and climate parameters are measured. Fig. 1 shows the stations, where the concentration of sulphur dioxide SO2 a) chloride ions Cl-, temperature T and relative humidity Rh are measured. Temperature and relative humidity are measured approximately at one hundred and twenty measurement stations;
the sulphur dioxide is measured at fifty stations, while the chloride ions are measured only at six stations in the Slovak Republic. All those parameters are needed for calculation of the zinc corrosion rate rcorr,zin.
a) b) c)
Fig. 1. Location of stations that measure concentration of a) sulphur dioxide SO2, b) chloride ions Cl-, c) temperature T and relative humidity Rh
The corrosion rate rcorr,zinc is calculated according to standard STN EN ISO 9223 [15] using (1), which describes normative corrosives estimation based on calculated first-year corrosion losses based on environmental information,
( )
T Rh Tf zinc Rh
corr e e Cl e e
r , =0.0129[SO2]0.44 0.046 +0.0175[ −]0.57 0.008 0.085 , (1)
where rcorr,zinc is the corrosion rate of zinc calculated in µm/year; f(T) = 0.038(T–10) when T < 10°C; otherwise - 0.071(T–10); and the remaining parameters are sulphur dioxide SO₂ (µg/m³); temperature T (°C); relative humidity Rh (%); chloride Cl⁻ (mg/l).
All those parameters have different concentrations in different areas of the Slovak Republic and they also change during the years. This can be seen on the maps of the aggressiveness of the environment in Fig. 2 to Fig. 5. The whole period (from 2004 to 2014) was divided into three smaller time periods, i.e. 2004-2006, 2007-2010 and 2011-2014, i.e. 3-4-4 years periods. The arithmetic mean of each of these three time periods was calculated to represent the values measured for the first-year.
a) b) c)
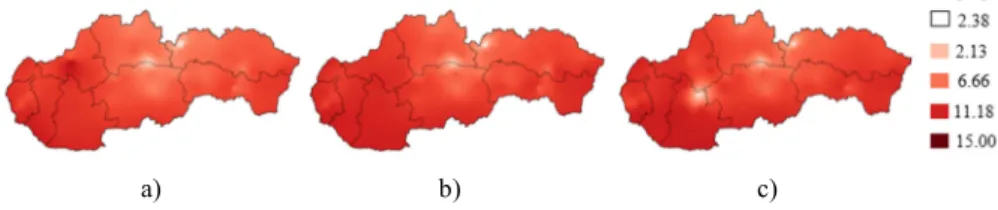
Fig. 2. Concentration of SO2 for the first-year calculated for time periods a) 2004-2006, b) 2007-2010, c) 2011-2014
a) b)
c) d)
Fig. 3.Concentration of Cl- for the first-year calculated for time periods a) 2004-2006, b) 2007-2010, c) 2011-2014 from 14th stations, d) 2011-2014 from only 6th stations in Slovakia
a) b) c)
Fig. 4.Distribution of T for the first-year calculated for time periods a) 2004-2016, b) 2004-2010, c) 2011-2014
Fig. 3 is divided into two types of maps, where the first three maps a), b) and c) are not created only from the six measurements stations located in the Slovak Republic (as it is shown in Fig. 3d) but also from the other eight stations (located in the Czech
Republic, Poland, Bosnia and Herzegovina). By comparing the same period 2011-2014 c) it can be clearly seen that the marine measurement stations in Bosnia and Herzegovina increase the CL- concentration in the southern part of Slovakia.
a) b) c)
Fig. 5.Concentration of Rh for the first-year calculated for time periods a) 2004-2006, b) 2007-2010, c) 2011-2014
Expressed in numerical values, as the arithmetical mean of the individual input data (SO2, Cl-, T and Rh) from the whole Slovak Republic in each year, the histograms were created it can be seen in Fig. 6.
b) b)
c) d)
Fig. 6.Average values of a) SO2, b) Cl-, c) temperature T and d) Rh
Fig. 6a shows that the concentration of SO2 is decreased from the average value 11.91 µg/m³ (2004) to the value of 7.29 µg/m³ (2014). The value of Cl- (Fig. 6b) was reduced from 0.43 mg/l (2004) to 0.19 mg/l (2014). On the other hand, the average value of temperature (Fig. 6c) is increased from 7.96 °C (2004) to 9.88 °C (2014) in Slovakia. The relative humidity (Fig. 6d) is periodically changing during the whole
decade, sometimes rises and sometimes falls. The highest value is 78.50% (2010), which is very similar to year 2014 (78.29%). On the other hand, in the year 2012 there was the lowest value of relative humidity of only 73.45%, what means the range 5.05%.
3. The corrosion map of zinc in Slovakia
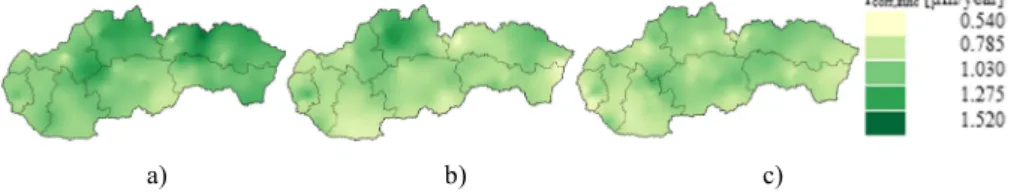
For the above mentioned time periods (2004-2006, 2007-2010, 2011-2014), the theoretical maps of corrosion rate rcorr,zinc in Slovakia were created according to (1). The process of creating corrosion maps has a several steps and the programs like Microsoft Excel, Surfer, QGIS (previously known as Quantum GIS), GIMP (GNU Image Manipulation Program) were used. Similar process was used to create maps in other articles [20] for zinc and also for the carbon steel. The creation of corrosion maps in the Czech Republic is addressed in article [21]. From comparison of the map to the map (Fig. 7) it can be clearly seen that the corrosion rate rcorr,zinc is decreased in Slovakia due to the smaller air pollution.
a) b) c)
Fig. 7. Corrosion rate of zinc between years a) 2004-2006, b) 2007-2010, c) 2011-2014
The corrosion maps of metals, created according the Eq. (1), can be created more precisely if more than only one year was measured and data obtained from SHMÚ, because sometimes there can be a failure in measurement for some months of the year (or for some year of the period), which can distort the values of the input data of rcorr,zinc in (1). This means that the arithmetic mean of individual values was calculated from more than one year (two, three or more years), which represents one-year of measurement and then those values are input data to (1).
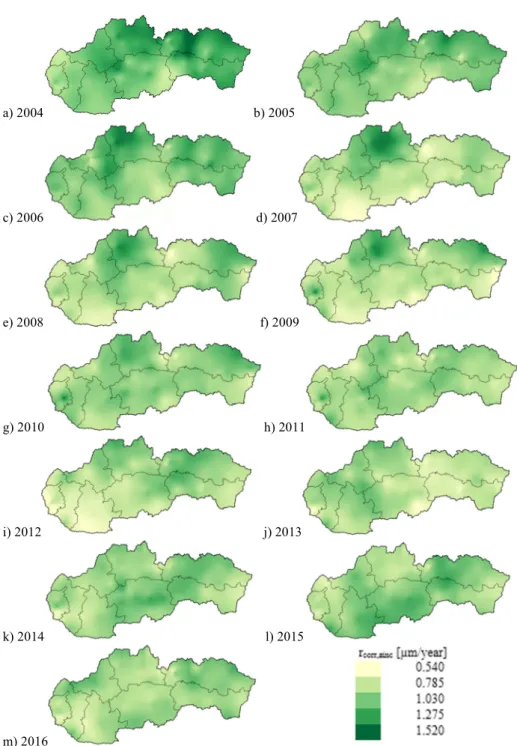
Despite this inaccuracy, Fig. 8 shows the corrosion rate of zinc rcorr,zinc in individual years from 2004 to 2016 in which not only the above mentioned periods are included (2004 - 2014) but also the years 2015 and 2016, in which the data were additionally obtained. Those maps were created based on (1), as described in standard STN EN ISO 9223 [15], calculated based on data obtained from SHMÚ of one measurement year. For the better comparison of individual maps, a uniform color scale was chosen. The scale for colorful tones was chosen from minimum rcorr,zinc-min= 0.540 µm/year to the maximum rcorr,zinc-max= 1.520 µm/year.
On these maps, it can be seen that the corrosion rate of zinc was changing during the time period (2004-2016). In some years it was decreasing - the years i) 2012 and j) 2013; on the other side in some years it was a little bit increasing - the years l) 2015 or m) 2016. However, in general, it is possible to say that the corrosion rate rcorr,zinc has decreased over the years, namely in years a) 2004, b) 2005, c) 2006 values of the corrosion rate are higher than in the years k) 2014, l) 2015, m) 2016.
a) 2004 b) 2005
c) 2006 d) 2007
e) 2008 f) 2009
g) 2010 h) 2011
i) 2012 j) 2013
k) 2014 l) 2015
m) 2016
Fig. 8. Corrosion rate of zinc in individual years from 2004 to 2016, one-year input data
4. Conclusion
It can be seen that the concentration of SO2 decreases, what leads to decreasing of the corrosion rate of zinc rcorr,zinc. It can by assumed that the impact of global warming leads to the higher amount of precipitation, increase of relative humidity and average values of temperatures.
According to results, it is possible to say that the climate in Slovakia is changed as in the whole Europe and the world. That caused the change of air pollutants. The pollution is decreasing and it led to a decrease of the corrosion rate of materials like zinc (rcorr,zinc) and carbon steel. It has big significance also to other materials, which can degrade in time due to environmental loads.
In the Slovak Republic, there are only six measurement stations, which measure the chloride concentration. Therefore, it is necessary to build more of those stations, because chloride also has a significant impact on calculation of the corrosion rate.
Acknowledgements
This research is supported by the Slovak Research and Development Agency under contract No. APVV-14-0772, and by Research Project No. 1/0566/15 of Slovak Grant Agency and also by the project SK-PL-2015-0004 and DS-2016-0039 in frame of bilateral cooperation.
References
[1] Benko V., Fillo L. Reliability of slender concrete columns designed by nonlinear analysis, 1st International Workshop on Design of Concrete Structures Using EN 1992-1-1, Prague, Czech Republic, 16-17 September 2010, pp. 163–168.
[2] Ryjáček P., Macho M., Stančík V., Polák M. Deterioration and assessment of steel bridges, 8th International Conference on Bridge Maintenance, Safety and Management, Foz do Iguaçu, Brazil, 26-30 June 2016, Vol. 361-363, 2013, pp. 1442–1445.
[3] Major I., Major M., Kucharova D. Numerical analysis of a mechanical wave damping in the rubber-concrete composite using the Adina software, Communications: scientific letter of the University of Žilina, Vol. 18, No. 4, 2016, pp. 44‒48.
[4] Rehacek S., Simunek I., Citek D., Kolisko J. UHPC and FRC in severe environmental conditions, Key Engineering Materials, Vol. 711, 2016, p. 412–419.
[5] Cremona, Ch., Poulin B. Standard and advanced practices in the assessment of existing bridges, Structure and Infrastructure Engineering, Vol. 13, No. 4, 2017, pp. 428‒439.
[6] Hollý I., Bilčík J. Modeling of reinforcement corrosion in concrete, Proceedings of 22nd International Conference on Engineering Mechanics, Svratka, Czech Republic, 9-12 May 2016, pp. 206–209.
[7] Moravcik M., Bujnakova P., Krkoska L., Kotes P. Diagnostic assessment of one of the first generation of pre-stressed concrete bridges in Slovakia, 9th International Conference on Bridges in Danube Basin, Zilina, Slovakia, 30 September - 1 October 2016, Vol. 156, pp. 257–263.
[8] Kajánek D., Pastorek F., Fintová S., Bača A. Study of corrosion behavior of dicalcium phosphate-dihidrate (DCPD) coating prepared by large amplitude sinusoidal voltammetry
(LASV) technique on ZW3 magnesium alloy, Procedia Engineering, Vol. 192, 2017, pp. 399–403.
[9] Zinc coatings, A comparative analysis of process and performance characteristics, American Galvanizers Association, 2011, https://www.galvanizeit.org/uploads/
publications/Zinc_Coatings.pdf (last visited 4 October 2017).
[10] Ivašková M., Koteš P., Brodňan M. Air pollution as an important factor in construction materials deterioration in Slovak Republic, 7th Scientific-Technical Conference Material Problems in Civil Engineering MATBUD 2015, Kraków, Poland, 22-24 June 2015, Vol. 108, 2015, pp. 131–138.
[11] De Marco A., Screpanti A., Mircea M., Piersanti A., Proietti Ch., Fornasier, M. F. High resolution estimates of the corrosion risk for cultural heritage in Italy, Environmental Pollution,Vol. 226, 2017, pp. 260‒267.
[12] Patrón D., Lyamani H., Titos G., Casquero-Vera J. A., Cardell C., Močnik G., Alados- Arboledas L., Olmo F. J. Monumental heritage exposure to urban black carbon pollution, Atmospheric Environment, Vol. 170,2017, pp. 22‒32.
[13] Efthymiou E. On the sustainable character of structural aluminum, Pollack Periodica, Vol. 3, No. 2, 2008, pp. 91‒100.
[14] Bujnak J., Hlinka R., Odrobinak J., Vičan J. Diagnostics and evaluation of footbridges, Procedia Engineering, Vol. 40, 2012, pp. 56–61.
[15] STN EN ISO 9223, Corrosion of metals and alloys, Corrosivity of atmospheres, classification, determination and estimation, 2012.
[16] Ivašková M., Koteš P., Dundeková S. Impact of air pollution and climate conditions on carbon steel in Slovak Republic, Materials Science Forum, Vol. 844, 2016, pp. 83–88.
[17] Strieška M., Koteš P. Influence of environmental pollution on degradation of materials, Young scientist 2017, 9th International Scientific Conference of Civil Engineering and Architecture, Štrbské Pleso, High Tatras, 20-21 April 2017, paper No. 57.
[18] Di Turo F., Proietti Ch., Screpanti A., Fornasier M.F., Cionni I., Favero G., De Marco A.
Impacts of air pollution on cultural heritage corrosion at European level: What has been achieved and what are the future scenarios, Environmental Pollution,Vol. 218, 2016, pp.
586‒594.
[19] Porhinčák M., Eštoková A., Vilčeková S. Comparison of environmental impact of building materials of three residential buildings, Pollack Periodica, Vol 6, No. 3, 2011, pp. 53‒62.
[20] Ivašková M., Koteš P., Hadzima B. Mass loss of zinc in Slovak republic, Proceedings 21st Hot Dip Galvanizing Conference, Tatranská Lomnica, Slovensko, 6-8 October 2015, pp. 19–27.
[21] Kreislová K., Geiplová H., Skrořepová I., Skořepa J., Majtás D. Up-dated maps of atmospheric corrosivity for Czech Republic, Koroze a ochrana materiálu, Vol. 59, No. 3, 2015, pp. 81‒86.