Dendritic spine morphology and memory formation depend on postsynaptic caskin proteins
norbert Bencsik1, Szilvia pusztai1, Sándor Borbély1,2, Anna fekete3, Metta Dülk3, Viktor Kis4, Szabolcs pesti5, Virág Vas3, Attila Szűcs1, László Buday3,5 & Katalin Schlett1*
CASK-interactive proteins, Caskin1 and Caskin2, are multidomain neuronal scaffold proteins.
Recent data from Caskin1 knockout animals indicated only a mild role of Caskin1 in anxiety and pain perception. In this work, we show that deletion of both Caskins leads to severe deficits in novelty recognition and spatial memory. Ultrastructural analyses revealed a reduction in synaptic profiles and dendritic spine areas of CA1 hippocampal pyramidal neurons of double knockout mice. Loss of Caskin proteins impaired LTP induction in hippocampal slices, while miniature EPSCs in dissociated hippocampal cultures appeared to be unaffected. In cultured Caskin knockout hippocampal neurons, overexpressed Caskin1 was enriched in dendritic spine heads and increased the amount of mushroom- shaped dendritic spines. Chemically induced LTP (cLTP) mediated enlargement of spine heads was augmented in the knockout mice and was not influenced by Caskin1. Immunocytochemistry and immunoprecipitation confirmed that Shank2, a master scaffold of the postsynaptic density, and Caskin1 co-localized within the same complex. Phosphorylation of AMPA receptors was specifically altered by Caskin deficiency and was not elevated by cLTP treatment further. Taken together, our results prove a previously unnoticed postsynaptic role of Caskin scaffold proteins and indicate that Caskins influence learning abilities via regulating spine morphology and AMPA receptor localisation.
A prime aim of learning is to adapt successfully to an ever-changing environment. Altering the strength of connections between neurons is widely assumed as one of the mechanisms by which memory is encoded and stored in the brain. Activity-dependent long-term synaptic plasticity in adult neural networks also depends on the strengthening or weakening of existing synapses and formation of new contact sites. These effects include structural changes due to altered cytoskeletal dynamics, shape or arborisation1–4 or electrophysiological changes in intrinsic membrane properties depending on the type, quantity or localisation of ion channels and neurotrans- mitter receptors within the plasma membrane5,6.
Neuronal scaffold proteins have been reported as molecular hubs important in organizing signalling machin- ery of both excitatory and inhibitory synapses, regulate actin dynamics or protein transport7–9. Within the pre- synapse, scaffold proteins provide a protein-rich network at the active zone, which is involved in molecular interactions regulating neurotransmitter vesicle docking, priming and exocytosis10,11. Neurotransmitter receptor localisation, transport and recycling are also regulated by local scaffold proteins within the postsynaptic site12.
CASK-interactive proteins, Caskin1 and Caskin2, are multidomain neuronal scaffold proteins13. Caskins are multidomain proteins possessing six ankyrin repeats, a single SH3 domain, two sterile α-motifs (SAM domains) and an extended disordered C-terminal proline-rich domain (PRD)13. The N-terminal region shares analogous but evolutionary not conserved domains with Shank proteins, which provide the major scaffolding platform within the postsynaptic density (PSD) of excitatory synapses upon multimerisation. Although Caskin1 and 2 share some structural similarities, they may execute divergent functions due to differences in binding to CASK (Calcium/calm- odulin dependent serine protein kinase), the ability for SAM multimerisation and SH3 domain folding13–15. Caskin1 is expressed at high levels in the brain, mainly in the synaptic regions13,16. Presynaptic localisation of Caskin1 was detected within the ribbon synapses of the bovine retina17. Up to date, no data are evident on Caskin2 expression.
1Department of Physiology and Neurobiology, Eötvös Loránd University, Budapest, Hungary. 2Institute of Cognitive Neuroscience and Psychology, Research Centre of Natural Sciences, Hungarian Academy of Sciences, Budapest, Hungary. 3Institute of Enzymology, Research Centre of Natural Sciences, Hungarian Academy of Sciences, Budapest, Hungary. 4Department Anatomy, Cell and Developmental Biology, Eötvös Loránd University, Budapest, Hungary.
5Department Medical Chemistry, Semmelweis University, Budapest, Hungary. *email: schlett.katalin@ttk.elte.hu
open
Caskin1 is known to bind to several proteins, including Nck/Dock18, LAR receptors tyrosine phosphatases19 or Abi220. The Caskin name itself is derived from the interaction with CASK13. CASK mutations have been widely impli- cated in neurological diseases, such as microcephaly and X-linked mental retardation21,22, but little is known about how the two Caskin proteins, Caskin1 and 2 influence synaptic functions. Nevertheless, Caskin1 has been proposed to play a role in synaptic functions via interacting with CASK protein near the presynaptic plasma membrane13,17,23.
In the present study, we investigated how the lack of Caskin proteins affects learning and memory in mice, using double knockout animals for Caskin1 and 2 (Caskin dKO mice). Behavioural analyses and field potential measurements indicated impaired memory and LTP (long-term potentiation) formation in Caskin dKO animals.
We also prove that the lack of Caskins and the overexpression of Caskin1 altered dendritic spine morphology of hippocampal neurons in an opposite manner. Analysis of the dendritic protrusions indicates that expression of exogenous Caskin1 significantly increases the ratio of mushroom spines. Importantly, the absence of Caskin pro- teins augments chemically induced LTP (cLTP) dependent increase in protrusion density and does not influence dendritic spine enlargement in the investigated cultures. Importantly, phosphorylation of the GluA1 subunits of AMPA receptors under normal conditions as well as following cLTP induction was specifically altered in Caskin dKO hippocampal neuronal cultures. These data indicate that Caskins participate in learning and LTP formation via regulating spine morphology as well as influencing AMPA receptor localisation in synapses.
Materials and Methods
Study approval.
This study was conducted under the approval of the Institutional Animal Ethics Committee of Eötvös Loránd University (approval number: PEI/001/1108-4/2013 and PEI/001/1109-4/2013). All methods were performed in accordance to the guidelines on research ethics of Eötvös Loránd University.Animal handling.
CD1 (WT), C57Bl6/J (WT), Caskin dKO (Caskin1−/−/2−/−) and Caskin dHZ (Caskin1+/−/2+/−) transgenic mice were housed in the animal facility at 22 ± 1 °C, with 12-h light/dark cycles and ad libitum approach to food and water. The animals were maintained and handled in accordance with the Guidelines for Accommodation and Care of Animals, according to the European Convention for the Protection of Vertebrate Animals Used for Experimental and Other Scientific Purposes.Generation of Caskin dKO mice.
Caskin1 constitutive KO mice were generated by targeted disruption of Caskin1 gene on chromosome 17 by TaconicArtemis. Using the Caskin1 targeting vector, the 2–6 coding exons of Caskin1 gene were flanked by loxP sites. Neomycin resistance gene cassette was placed into the intron 1 and thymidine kinase gene was inserted next to the homologous sequence for selection markers. Caskin2 constitutive KO mice were produced by targeted disruption of Caskin2 gene on chromosome 11. Using the Caskin2 targeting vector, the 3–7 coding exons of the Caskin2 gene were flanked by loxP sites. Neomycin resistance gene cassette was placed into the intron 2 next to the floxed exons.In both cases, the targeted C57BL/6 N embryonic stem cell lines were grown on a mitotically inactivated mouse fibroblasts feeder layer in DMEM high glucose medium containing 20% FBS and 1200 U/ml LIF. 1 × 10⁶ embryonic stem cells and 30 μg of linearized targeting vector were electroporated (Biorad Gene Pulser) at 240 V and 500 μF. Next, puromycin selection (1 μg/ml; on day 2) and gancyclovir (2 μM; on day 5) counter selection were performed after electroporation. On day 8, embryonic stem cell clones were isolated and analysed by Southern blotting. The identified targeted ES cells were microinjected in blastocysts and transferred to pseudopregnant females. The chimeric mice were bred further and the germline transmission was identified in every generation.
The floxed 2–6 exons of Caskin1 gene or the floxed 3–7 exons of Caskin2 gene were removed by Cre-mediated recombination, when Cre expressing mouse line (Gt(ROSA)26Sor with C57BL/6J background) was crossed with mice carrying the floxed Caskin genes (C57BL/6J background). The knockout-step took place when the Cre enzyme removed the floxed Caskin1 and Caskin2 genes in the littermates.
Genotyping was performed by PCR using oligonucleotide primers a1 and s1 (a1: CAAGAGTCCGGTGGAC AAGG and s1: ATGTTTCCAGGCCCTCTTGC) for the wild type Caskin1 allele (product size, 306 bp), and oligo nucleotides a1 and s2 (s2: CACTGGCTGAACAGCAAAGC) for the exon 2–6 deleted allele (product size, 366 bp). Caskin2 deletion was tested in a second PCR reaction, using primers a2 and s3 (a2: CCTAATGA AGGCACGTCAGG and s3: CACCAACCAACTGCCTTGC) for the amplification of the wild type Caskin2 allele (product size, 255 bp), and primers a2 and s4 (s4: ATAACTCAGTGGTGAAGACAGTGC) for the amplification of the exon 3–7 deleted allele (product size, 315 bp). Inactivation of double (Caskin1 and Caskin2) genes was tested in every generation by PCR of genomic DNA. Caskin dKO mice were obtained by interbreeding Caskin1 KO and Caskin2 KO mice.
Immunohistochemistry.
3 months old C57Bl6/J wild-type (WT) or Caskin dKO mice were deeply anesthe- tized with chloral-hydrate (350 mg/kg, i.p.) and were transcardially perfused with ice-cold 4% paraformaldehyde (TAAB, wt/vol in PBS; pH 7.4). Following dissection, brains were postfixed overnight in 4% paraformaldehyde and cryoprotected in 30% sucrose in PBS at pH 7.4. Sagittal sections (45-μm thick) of the brain were cut on a cry- ostat (Leica). Gallocyanine-chrome alum stainings were performed on the sections mounted on gelatine–coated slides. The slides were immersed in the 0.15% gallocyanine-chrome alum solution for 1 day and then washed distilled water for 5 min. After staining, slides were dehydrated in graded ethanol (50%, 70%, 96% and absolute ethanol) and xylene for five minutes in each solution, then and coverslipped with DPX (Merck). Images were taken with a Zeiss AxioObserver Z1 (Carl Zeiss) with Plan Neofluar 10x/0.3 objective.Behavioural tests.
Animal behavioural experiments were performed essentially as previously described in Bencsik et al.24. 16 control (Caskin dHZ) and 16 Caskin dKO transgenic littermates were used in behaviouraltests. In brief, the open field tests were carried out at three different ages. Mice were placed in the middle of a 48 × 48 × 40-cm open box (Experimetria Ltd.) and were allowed to move freely for 5 min. Their behaviour was recorded and analysed by the Conducta Advanced System 1.0.
Novel object recognition tests were carried out at three different ages25. Experiments were carried out within a non-transparent white cage (25 cm × 42 cm). Prior to training, mice were habituated to the cage for 5 min. The next day, animals were introduced into the same field from the previous day but this time the cage contained two identical objects (A1 and A2). Mice were let to explore the environment for 5 min, and the time the animals spent with sniffing objects A1 and A2 was evaluated from the recordings, respectively. 5 h later, mice were re-introduced to the cage, containing one familiar (A1) and a novel (B) object. The mice could explore the cage and the objects again for 5 min. Rodents usually remember the familiar (A1) object, therefore they show more interest towards the novel object (B). In order to compare the relative preference towards the novel object, a discrimination index (DI) was calculated as (B exploration time – A1 exploration time)/(B exploration time + A1 exploration time)24. A high DI value refers to the state when the animal sniffs longer at the novel object while a DI around 0 indicates the lack of novelty recognition.
Spatial learning and memory performance of the mice was measured using the Morris water maze test between the age of 2.5 to 5 months. A circular plastic pool (height: 35 cm, diameter: 105 cm) was filled with water (22 ± 1 °C). On day 0, a visible platform was placed into the pool with visual cues on the walls. Mice were allowed to swim for a maximum of 1 minute. From day 1, the escape platform (8-cm diameter) was submerged 1 cm below the surface of the water. Animals were trained for 11 consecutive days, with four trials per day. On the 5th and 10th day, the platform was removed, and the time and distance spent searching around a 24-cm diameter area over the original platform was calculated. On day 11, the hidden platform was re-positioned and the animals were let to swim four times for a maximum of 1 minute. Evaluation of behavioural tests was performed essentially as described in Gulyás et al.26.
Cell cultures, transfection and chemical treatments.
Primary cultures of embryonic hippocampal cells were prepared from C57Bl6/J (WT) or Caskin dKO mice on embryonic day 17–18, according to Czöndör et al.27. Cells were seeded onto poly-L-lysine-laminin (Sigma-Aldrich)–coated glass coverslips in 24-well plates at 1.45 × 10⁵ cells/well. Cells were cultivated for 13–16 day at 37 °C in 5% CO2, 95% air atmosphere. Transfection was carried out with Lipofectamine2000 (Invitrogen) using an empty backbone p-EGFP-N1 vector (Clontech) or a V5-tagged wild-type Caskin1 construct. The V5 epitope tagged Caskin1 was created by inserting the rat Caskin1 cDNA into a pcDNA3.1/TOPO-V5-His vector (V5-Caskin1)18. In order to detect transfected living neu- rons, we co-transfected an EGFP vector backbone together with the Caskin1-V5 construct using a 1:2 ratio of EGFP:Caskin1-V5 plasmids. Under these conditions, basically all V5 positive transfected neurons were also pos- itive for the EGFP signal, allowing us to detect transfected neurons by EGFP positivity. Nevertheless, Caskin1-V5 overexpression was always verified in the investigated neurons by the anti-V5 immunocytochemistry (see below).Chemically induced LTP (cLTP) was carried out at 37 °C. Cells were incubated in ECS buffer (150 mM NaCl, 2 mM CaCl2, 5 mM KCl, 10 mM HEPES, 30 mM glucose, 0.5 µM tetrodotoxin, 20 µM bicuculline and 1 µM strych- nine; pH 7.4) for 5 min28. 200 µM glycine was applied for 3 min in ECS buffer, and then medium was changed back to the original medium, in which cells survived for an additional 5 h. In case of the APV-treated wells, APV was present in the buffers throughout the experiment. Chemicals and antagonists were all from Tocris Bioscience.
Immunocytochemistry and microscopy in fixed cultures.
Hippocampal cultures were fixed on the 13–16th day after plating for 20 min with cold 4% paraformaldehyde. Cultures were immunostained essentially as described in Czöndör et al.27. Primary antibodies were anti-Shank2 (guinea pig, 1:2000, Synaptic System), and anti-V5-tag (mouse, 1:1000, ThermoFisher Scientific). Appropriate biotinylated secondary antibody (anti-guinea pig, 1:1000, Jackson ImmunoResearch) was developed by Cy5-conjugated streptavidin (streptavidin-Cy5, 1:500, Jackson ImmunoResearch) while Alexa fluor-labeled secondary antibody was applied in 1:500 dilu- tion (anti-mouse, 1:1000, Jackson ImmunoResearch). Images were taken with an LSM 800 (Carl Zeiss) or with a FluoView 500 LSM IX81 (Olympus) microscope with Plan Apochromat 63×/1.4 or Plan Apochromat 60×/1.4 immersion objectives. All experiments were repeated at least three times using independent cultures.Morphological characterization of dendritic protrusions was performed manually, as described by Bencsik et al.24.
Co-immunoprecipitation and western blot.
Mouse brain tissues from C57Bl6/J (WT), Caskin dHZ and Caskin dKO mice were homogenized in ice-cold lysis buffer (1% Triton X-100, 100 mM NaCl, 30 mM Tris pH 7.5, 1 mM EGTA, 10 mM NaF, 1 mM Na3VO4, 2 mM p-nitrophenyl-phosphate, 10 mM benzamidin, 1 mM phen- ylmethylsulphonyl fluoride, 25 μg/ml each of aprotinin, pepstatin A and trypsin inhibitor) by suspension with a cut-end pipette tip. The homogenates were centrifuged first at 4000 rpm for 2 min then 14000 rpm for 10 min in 4 °C to remove cell debris. Thereafter, 25 µL of BSA-blocked Protein A (Sigma-Aldrich) beads were added, and the samples were incubated for 1 h at 4 °C. Lysates were incubated with specific antibodies (anti-Caskin1, rabbit, 1:166, Synaptic Systems; anti-Shank2, guinea-pig, 1:166, Synaptic System) for 1 hour on ice. Immunoprecipitates were washed three times with ice-cold PBS, containing 0.4% Triton X-100 (Sigma-Aldrich). Brain lysates and precipi- tated complexes were separated by SDS-PAGE, transferred to nitrocellulose or PVDF (polyvinylidene difluoride, Merck) membrane. After blocking with 0.5% blocking reagent (Roche Diagnostics) in TBST (Tris-buffer contain- ing 0.05% Tween-20 and 0.1% NaN3), membranes were probed with specific antibodies as follows: anti-Caskin1 (rabbit, 1:1000, Synaptic Systems), anti-GluA1 (mouse, 1:000, Merck), anti-phospho-GluA1 (pS831) (rabbit, 1:1000, Merck), anti-phospho-GluA1 (pS845) (rabbit, 1:1000, AbCam), anti-Shank2 (guinea-pig, 1:2000, Synaptic System), anti-PSD-95 (mouse, 1:1000, ThermoFisher), anti-Caskin2 (rabbit, 1:1000, AbCam), anti-Caskin2 (rab- bit, 1:1000, ThermoFisher), anti-Caskin2 (mouse, 1:1000, Santa Cruz) and anti-βIII-tubulin (mouse, 1:5000, Exbio). Signals were visualized with horseradish peroxidase-coupled secondary antibodies (1:20000; Dianova)using enhanced chemiluminescence (ECL) detection reagents (Amersham Pharmacia Biotech). Average inten- sity values were calculated using Image Studio Lite 5.0 software as specific signals/βIII-tubulin signals and were normalized to the corresponding control values. Complete images of the Western blot cut-outs presented in Figures 1E and 7B–H are displayed in Suppl. Figures S1, S5 and S6.
Electronmicroscopy.
For immunoperoxidase staining, hippocampal cultures were fixed on the 11–12th day after plating, followed by 4% paraformaldehyde, 0.5% glutaraldehyde and 0.2% picric acid in 0.1 M PB (pH 7.4). The sections were incubated in 2% NGS for 60 min at room temperature to suppress non-specific binding.Sections were incubated in anti-V5 IgG (mouse, 1:1000, Invitrogen) for 1 day at 4 °C. After thorough washing with PBS, sections were incubated with anti-mouse biotin (1:500, Vector) in blocking solution for 1 day and then in avidin-peroxidase for 1 h; immunopositive structures were visualized using Ni-DAB.
2–5 months old Caskin dHZ and Caskin dKO male mice were deeply anesthetized with chloral-hydrate (350 mg/kg, i.p.), then perfused intracardially with saline, followed by 4% paraformaldehyde, 0.5% glutaral- dehyde and 0.2% picric acid in 0.1 M PB (pH 7.4). 50 µm coronal sections were cut with a Vibratome (Leica).
Plastic-embedded ultrathin sections were examined in a JEM1011 electron microscope (JEOL) at 60 kV and images were taken with an Olympus Morada 11 megapixel camera and iTEM software (Olympus). Electron micrographs of randomly selected fields were taken from hippocampus CA1 stratum radiatum. Length of the active zone, synaptic area, PSD length and profile circularity (4π × area/perimeter2) were measured using NIH ImageJ. For every clearly-defined synapse, the lateral edges of the postsynaptic density were defined.
Electrophysiological recordings.
Miniature excitatory postsynaptic currents (mEPSC) experiments were performed essentially as described in Szíber et al.29. Electrophysiological recordings of dissociated primary Figure 1. Generation of Caskin dKO mice. (A–D) Gene targeting strategies to knockout exons 2 to 6 of Caskin1 (A,B) or exons 3 to 7 of Caskin2 (C,D). In the targeting vectors, exons to be deleted were flanked by loxP sites. To achieve positive and negative selection, a neomycin (Neo) resistance gene cassette was inserted into intron 1 and the thymidine kinase gene (TK) was inserted downstream of exon 7 (Caskin1) or 8 (Caskin2), respectively. Mice carrying mutant floxed allele were crossed with transgenic C57Bl/6 (Bl6) mouse carrying Cre recombinase. (B) Position of deleted exons 2 to 6 are represented in chromosome 17. The primer set (a1, s1, s2) and the amplified regions (WT: 306 bp, KO: 366 bp) are marked on the wild type (WT) and KO locus. Right panel shows PCR genotyping of wild type (+/+), homozygous Caskin1 KO (−/−) and heterozygous (+/−) mice. (D) Position of deleted exons 3 to 7 are represented in chromosome 11. The primer set (a2, s3, s4) and the amplified regions (WT: 255 bp, KO: 315 bp) are marked on the wild type (WT) and KO sites. Right panel shows PCR genotyping of wild type (+/+), homozygous Caskin1 KO (−/−) and heterozygous (+/−) mice. (E-F) Comparison of endogenous Caskin1 levels between C57Bl6/J wild type (WT), heterozygous (dHZ) and Caskin dKO (dKO) mice at the age of 3 months. Quantitative data was based on 3 independent samples by normalizing Caskin1/βIII-tubulin ratio. (G) Median-sagittal sections of WT and dKO brains obtained at 3-months of age and stained by gallocyanine-chrome alum stains. Scale bar: 3 mm. (H–I) Total ambulation distance (H) and velocity (I) within the open field during aging. Caskin dHZ (n = 16; white columns) and Caskin dKO (n = 16;grey columns) data are displayed. All data are shown as mean ± SEM. *p < 0.05; ***p < 0.001.
hippocampal neurons (DIV14–17) were performed under an A1 Axiovert 200 M microscope (Carl Zeiss). mEPSCs were recorded at room temperature (21–23 °C) under whole cell conditions. Signals were amplified using a MultiClamp700B (Molecular Devices) and acquired at 20 kHz using the data acquisition software DASYLab ver- sion 11 (National Instruments). The composition of the bath solution (ACSF) was (in mm): NaCl 140, KCl 5, CaCl2 2, MgCl2 1, HEPES 5 and glucose 10, pH 7.4. 500 nM TTX was used to block spike mediated neurotransmis- sion. Patch electrodes were filled with the following solution (in mM): K-gluconate 100, KCl 10, KOH 20, MgCl2
2, NaCl 2, HEPES 10, EGTA 0.2 and glucose 5; pH 7.3, yielding an electrode resistance of 5–8 MΩ. Membrane potential in voltage clamp experiments was held at −60 mV. Analysis of mEPSC frequency and amplitude was per- formed semi-automatically by a software developed by A. Szűcs (NeuroExpress). Time constants of the miniature EPSCs were determined by fitting the decay parts of individual events with monoexponential functions using the Levenberg-Marquard algorithm. Events with amplitude over 10 pA were selected for the nonlinear fitting and the gradual decrease of the χ2 goodness-of-fit parameter was evaluated to accept events as successfully fitted.
Hippocampal LTP experiments were performed essentially as described in Borbély et al.30. Caskin dHZ and Caskin dKO were decapitated under chloral-hydrate (350 mg/kg, i.p.) anesthesia, and 400-µm-thick horizontal hippocampal slices were cut. After 1 h regeneration in the incubation solution containing HEPES-buffer, slices
A
Caskin dHZ (n=16) Caskin dKO (n=16)
1 2 3 4
0.2 0.4 0.6 0.8
0
$
day 11 0 3 6
number of unsuccessful mice
* C
number of unsuccessful mice 0 1 2 3
1-5 6-10
** *
*
***
*
*
*
* ***
** *
* 0
0.4 0.8 1.2
1.6 $
B
***
-0.3 -0.1 0.1 0.3 0.5
**
DI
**
2-5 5-7 7-13
D
Caskin dHZ Caskin dKO
E
Caskin dHZ Caskin dKO
G H I
F
day 5 day 10
* *
*
days
02 46 108 12
02 46 108 12
04 128 1620 24
04 128 1620 24
day 1
day 5
day 7
day 10 0°
90°
180°
270°
0°
90°
180°
270°
0°
90°
180°
270°
0°
90°
180°
270°
0°
90°
180°
270°
0°
90°
180°
270°
0°
90°
180°
270°
0°
90°
180°
270°
months
trials
distance [m]
*
sniffing time [sec]
0 4 8 12 16
2-5 months 5-7 months 7-13 months familiar object
*
novel object*
* *
*
n.s.
n.s.
n.s.
distance [m]
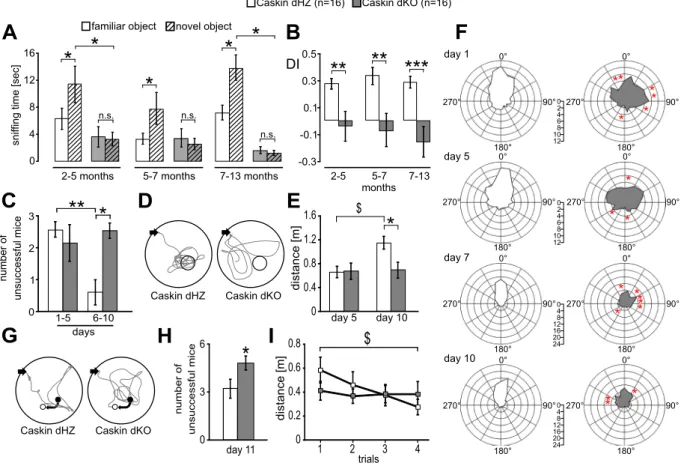
Figure 2. Deletion of Caskin1 and Caskin2 genes impairs novel object recognition and spatial memory when comparing Caskin double heterozygous (Caskin dHZ, designated by white colour; n = 16) and Caskin double knockout (Caskin dKO, designated by grey colour; n = 16) mice. (A,B) Novel object recognition tests performed at different developmental ages, indicating (A) the average sniffing time what Caskin dHZ (columns with white background) and dKO (columns with grey background) mice spent at the familiar (A1; empty columns) or novel (B; striped columns) objects in the 2nd round of novel object recognition test, performed after 5 hours. (B) Discrimination index showing the relative preference towards the novel object (DI; see Materials and Methods) was significantly lower in Caskin dKO mice, regardless of their developmental age. (C–I) Morris water maze test results of Caskin dHZ and Caskin dKO mice. (C) Average number of failures during day 1–5 and 6–10. (D) Representative trajectories from Caskin dHZ and Caskin dKO mice during the second probe trial of the Morris water maze (day 10). Black arrows indicate start positions; circles represent the target area over the original platform. (E) Average swimming path length above the removed platform during the probe trials on day 5 and 10. (F) Average angle preference values of Caskin dHZ and Caskin dKO mice obtained on day 1, 5, 7 and 10. (G–I) On day 11, the platform was moved from its original position (filled circle) into an adjacent quadrant (open circle) (G). Black arrows indicate the start position of the swimming trajectories. (H) Average number of failures to find the relocated platform. (I) Average swimming path length during four consecutive trials on day 11. All data are shown as mean ± SEM. Asterisks represents significance compared to control values (white columns), $ indicates significant differences between data pairs. $p < 0.05; *p < 0.05; **p < 0.01;
***p < 0.001.
were transferred to a Haas-type recording chamber (Experimetria Ltd.) through which standard artificial cere- brospinal fluid (ACSF) was perfused using a peristaltic pump. The solution was saturated with carbogene (95%
O2 and 5% CO2). Glass microelectrodes filled with 1 M NaCl (3–10 MΩ resistance) were positioned as recording electrodes in the stratum pyramidale of the hippocampal CA1 region. Slices were tetanized with the intensity that elicited 70% of maximal population spike (POPS) amplitude at the Schaffer-collaterals. At the beginning of the data recording session, 0.1 Hz triggers were applied for 10 min (test stimulation), and then HFS (high frequency stimulation) trains (100 Hz, 5 sec) were applied for LTP induction. Averaged responses were calculated as a mean of amplitude of six POPSs before and following LTP induction.
E/S curves displaying the ratio between the derivative of the excitatory postsynaptic potential (dEPSP) and the POPS amplitude were determined. According to Wheal et al.31; a left or a right shift of the E/S curve indicates facilitation or depression, respectively. HFS-dependent changes were visualized by vectors originating from the pre-HFS and pointing to the post-HFS values of the same recordings as a function of POPS amplitude change and
100 100 100 100 100 100 100 100 100 100 100 100 100 100 100 100 100 100 100 100 100 100 100 100 100 100 100 100 100 100 100 100 100 100 100 100 100 100 100 100 100
SC stim CA1 recording
MF DG CA3
SC
B
rel. change of POPS amplitude 100 150 200
500 10 20 30
HFS 100 Hz
n=6
n=10
*
Caskin dHZ Caskin dKO
time [minute]
A
40
D
Caskin dHZ5 1 5 10 00
10 5 15
POPS amplitude [mV]
dEPSP [mV/ms] 20
Caskin dKO
E
0 10 5 15
POPS amplitude [mV]
5 1 5 10
0 dEPSP [mV/ms] 20 [%]
C
baseLTP
2 mV5 ms
Caskin dKO Caskin dHZ
F G H I
0°
90°
270°
180° 0°
90°
270°
180°
0 10 20 30 40
normalized distance [%]
Caskin dHZ Caskin dKO
Caskin dHZ Caskin dKO pre-HFS post-HFS
**
**
* **
0 0.15 0.3 0.45 normalized POPS [%]
0 100 50
normalized dEPSP [%]0 50 100 dEPSP
POPS
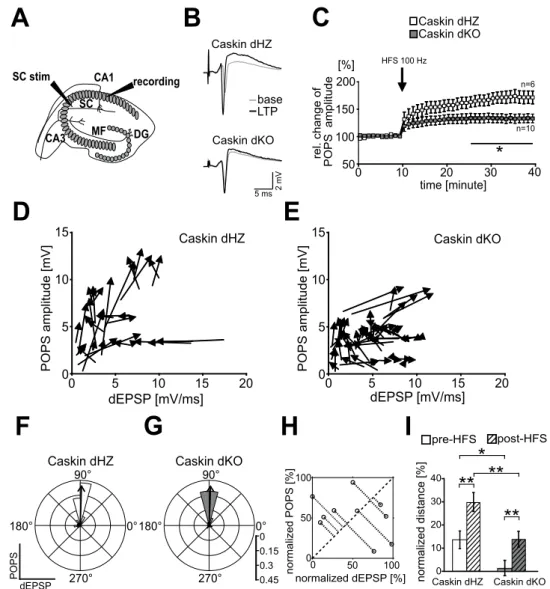
Figure 3. LTP formation is impaired in Caskin dKO hippocampal slices. (A) Stimulation paradigm during LTP induction. (B) Representative sample traces recorded before (grey) and after (black) the high-frequency stimulation in the CA1 str. pyramidale in Caskin dHZ and Caskin dKO mice. (C) Relative change of POPS amplitudes after the application of 100 Hz stimulus for 5 sec (HFS) to the Schaffer collaterals (SC stim). Asterisk represents significant differences compared to Caskin dHZ values. *p < 0.05. (D,E) Vectors displaying the transition from the pre-HFS to the post-HFS state in dHZ (D) and dKO (E) recordings are plotted as a function of the derivative of the excitatory postsynaptic potential (dEPSP) and the POPS amplitudes (POPS). (F, G) 15° polar histograms show the distribution of pre-HFS → post-HFS vector directions calculated from Caskin dHZ (F) and Caskin dKO (G) recordings. The thick arrow within the histogram indicates the median of vector directions. (H) Cartoon depicting the determination of orthogonal distance for pre-HFS and post-HFS data point. Dotted lines demonstrate the orthogonal distance from the x → y = x function (indicated by the dashed diagonal). Graph shows randomized data. (I) Comparison of normalized orthogonal distance values before or following HFS in Caskin dHZ and Caskin dKO mice. *p < 0.05; **p < 0.01. All data are shown as mean ± SEM.
See Materials and Methods for a detailed description of data evaluation.
dEPSP values. To compare the direction of these vectors, the four-quadrant inverse tangent method32 was used to create polar histograms, where 0° and 90° determine the direction of the x- and y-axis (thus, dEPSP and POPS amplitude values), respectively.
In order to compare the relative E/S facilitation/depression changes of dHZ and dKO recordings, individual pre- and post-HFS dEPSP and POPS amplitude values were normalized to the peak of the corresponding pre-HFS values of the same experimental group. The normalized values were plotted and the orthogonal distance from the x → y = x function was calculated as an algebraic value (see dotted distances from the dashed diagonal on Fig. 3H). When the average distance value is positive, it indicates facilitation (left shift from diagonal), while a negative distance value represents depression (right shift from diagonal).
Statistical analyses.
Statistical analysis was performed using IBM SPSS Statistics v.21.0.0.0 (SPSS Inc., Chicago, USA). Student’s t-test or non-parametric Mann-Whitney test was used for two-group comparative anal- yses. For multiple-group comparisons Tukey post-hoc was applied. Statistical significance was declared if the p values were under 0.05. Data are displayed as mean ± SEM, unless otherwise indicated.Results
Deletion of Caskin1 and Caskin2 does not lead to severe behavioural changes.
Caskin1 and 2 knockout mice were generated by targeted disruption of Caskin1 gene on chromosome 17 (Caskin1−/− mice) or Caskin2 gene on chromosome 11 (Caskin2−/− mice), respectively (Fig. 1A–D). Successful deletion of exon 2 to 6 (Caskin1 gene) or exon 3 to 7 (Caskin2 gene) was demonstrated by PCR analyses (Fig. 1B,D). Double knockout0.1 0.2 0.3
AZ length [ m]
*** C
0 0.1
0.15
*
area [ m
2 ]
0.05 0.1 0.15 0.2 area [ m2]
cumulative ratio
0.05
D
0.1 0.2
0.3
***
PSD length [ m]
PSD length [ m]0.23 0.38 0
0.2 0.4 0.6 0.8 1
cumulative ratio
0.08
E **
0.8 0.9 1
circularity
Caskin dHZ Caskin dKO
0.74 0.64 circularity 0.7
cumulative ratio
0.84
Caskin dHZ Caskin dKO
5 1 . 0 5 0 .
0 0.25
0.2 0.4 0.6 0.8
0 1
cumulative ratio
AZ length [ m]
A Caskin dHZ
B
Caskin dHZ Caskin dKO
μμ μ
μ μ
μ
0.2 0.4 0.6 0.8
0 1
0
0.2 0.4 0.6 0.8
0 1
0.94
Caskin dKO
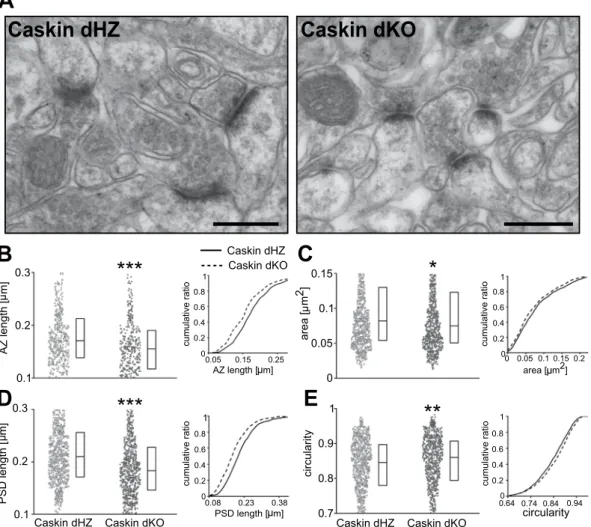
Figure 4. Ultrastructural analysis in the hippocampal CA1 str. radiatum reveals that the lack of Caskin1 and Caskin2 leads to smaller dendritic spines. (A) Representative electron micrographs from the CA1 region. Scale bars indicate 300 nm. (B–E) Quantitative evaluation of dendritic spine morphology of Caskin dHZ (n = 561;
3 mice, light grey) and Caskin dKO (n = 552; 3 mice; dark grey) littermates, displaying average active zone length (B), spine area (C), PSD length (D) and circularity of the dendritic spines (E). Boxplots show the median (middle lines) and the 25–75 percentiles of data while individual dots represent single spine values. Cumulative distribution functions are displayed on the right, with solid and dashed lines representing Caskin dHZ and Caskin dKO data, respectively. Asterisks represent significant differences compared to Caskin dHZ values.
*p < 0.05; **p < 0.01; ***p < 0.001.
Caskin1−/−/Caskin2−/− mice (designated as Caskin dKO animals) were generated by breeding heterozygous Caskin1+/− and Caskin2+/− mice and genotyping the offsprings. Western blot analyses from brain lysates of C57Bl6/J wild-type (Caskin1+/+/Caskin2+/+, indicated as WT), double heterozygous (Caskin1+/−/Caskin2+/−; designated as Caskin dHZ) and Caskin dKO mice revealed that endogenous Caskin1 expression normalized to neuron-specific βIII-tubulin values is reduced in Caskin dHZ compared to Caskin dWT and is non-detectable in Caskin dKO animals (Fig. 1E,F). Unfortunately, neither of the tested Caskin2-specific antibodies gave reliable Western blot signals (Supplementary Fig. S1). Although in this study we wished to focus on Caskin1 protein, it was decided to knockout both Caskin proteins to avoid the potential compensatory effect of Caskin2 in the Caskin1 knockout mice. Breeding differences between Caskin dWT, dHZ and dKO mice were not observed (data not shown). Basic brain anatomy was evaluated by gallocyanine-chrome alum staining. Images did not reveal
F1 F2 F3
EGFP Caskin1 Caskin1
G3 G2
n=133
G1 B
0.5 1 1.5 2 2.5 3 3.5 00
1 2 3 4 5
length [ m]
D
n=244C
n=3260.4
[protrusions/ m]
*
**
$0.2 0.6 0.8
0
A
0.5 1 1.5 2 2.5 3 3.5 00
1 2 3 4 5
length [ m]
0.5 1 1.5 2 2.5 3 3.5 HN-index
00 1 2 3 4 5
length [ m] EGFP
Caskin dKO
WT
stubby (S) filamentous (F) mushroom (M)
*
EGFP+
Caskin1
E
Caskin dKO
EGFP
WT
EGFP EGFP
Caskin dKO
S M
F
S M
F
S M
F
EGFP
Caskin1
Caskin1 EGFP
n=133
n=326 n=244
Caskin1 + + ++
- -
μμμ
μ
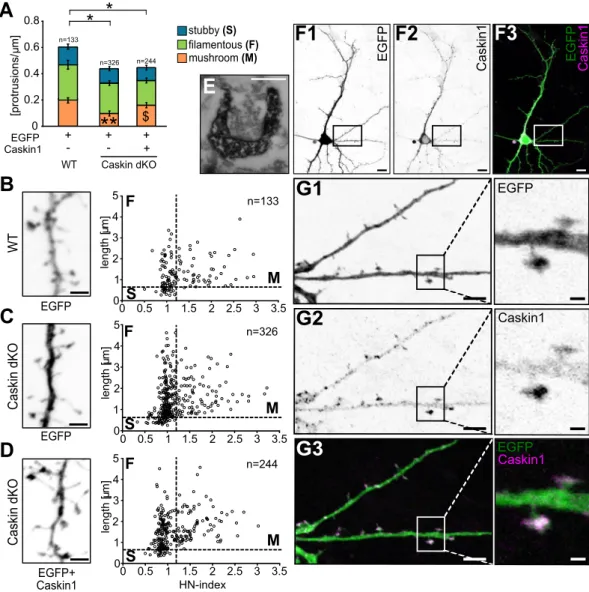
Figure 5. Caskin levels influence protrusion density and dendritic spine morphology in cultured hippocampal neurons. (A–D) Morphological characteristics of dendritic protrusions in EGFP-transfected C57Bl6/J (WT) neurons or Caskin dKO neurons overexpressing EGFP only or EGFP in combination with V5-tagged Caskin1.
(A) Mean protrusion density on the tertiary dendritic branches, based on the morphological classification of protrusions as stubby, filamentous or mushroom24. Data were obtained from three independent cultures; the number of spines is indicated in the figures. All data are displayed as mean ± SEM. Asterisks represent significance compared to C57Bl6/J (WT) EGFP-expressing values and the $ symbol indicates significant differences between protrusion categories. *p < 0.05; **p < 0.01; $p < 0.05. (B–D) Dendritic protrusion morphology in EGFP- transfected C57Bl6/J WT neurons (B), Caskin dKO neurons overexpressing EGFP (C) and Caskin dKO neurons transfected with EGFP and V5-tagged Caskin1 constructs (D). Dots represent individual protrusions, plotted along the head/neck width ratio (HN-index) and length. Representative inverted fluorescent images of the EGFP signal are shown on the left side. Scale bar: 2 µm. (E) Electron microscopy detection of anti-V5 immunoreactivity by DAB precipitates in a dendritic spine of a CD1 neuron overexpressing V5-tagged Caskin1 protein. Scale bar:
200 nm. (F–G) Inverted fluorescent and merged images of a CD1 hippocampal neuron, expressing EGFP and V5- tagged Caskin1. Boxed areas on (F,G) designate the enlarged ROIs on (G). Scale bars indicate 10 µm (F1-3), 5 µm (left figures in G1-3) or 1 µm (enlarged ROIs on the right in G1-3).
large-scale differences between the investigated brains (Fig. 1G). No motor coordination defects were detected in the open field test during the development of Caskin dHZ and dKO mice, as ambulation distance and average velocity of the mice were similar during the 5-minute observation time in young (2–5 months of age), middle aged (5–7 months old) or aged (7–13 months old) mice (Fig. 1H,I).
Lack of endogenous Caskin1 and Caskin2 impairs novel object recognition and spatial memory.
In order to obtain a more specific insight whether deletion of endogenous Caskin proteins influence learning ability, we compared novelty recognition as well as spatial navigation skills between Caskin dHZ and dKO male animals (Fig. 2). The hippocampus-independent novel object recognition test was carried out as described in the Materials and Methods section. As displayed on Fig. 2A, all tested Caskin dHZ animals sniffed the novel object significantly more than the familiar object (compare white columns with and without stripes), resulting in a dis- crimination index around 0.3 (Fig. 2B). On the other hand, Caskin dKO mice sniffed at the novel and the familiar objects for the same time (compare grey columns with and without stripes on Fig. 2A), resulting in a significantly reduced discrimination index around or below 0 (Fig. 2B). Thus, Caskin dKO animals were unable to discrimi- nate between the familiar and novel objects, regardless of their age.
C
$1
0.4 0.2 0 0.6 0.8 1.4 1.2
rel. protrusion density
cLTP
- +
*
**
stubby Shank2+
Shank2-
filamentous Shank2+
Shank2-
mushroom Shank2+
Shank2- cLTP
-
1
0.4 0.2 0 0.6 0.8 1.4 1.2
rel. protrusion density
$
+ + - *
$
A
controlPFGE2knahS
B
PFGE 2knahS
cLTP control cLTP
CD1 Caskin dKO
$
EGFP EGFP EGFP +
n=457 n=377
n=136 n=99
n=89 n=116
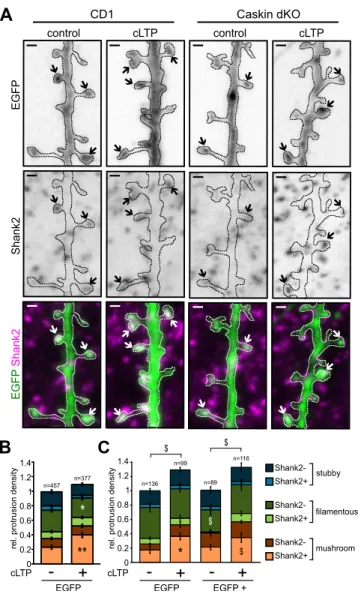
Figure 6. Caskin1 does not influence cLTP-induced morphological changes in hippocampal neuronal cultures.
(A) Representative images of CD1 and Caskin dKO neurons under control conditions or 5 hours after a 3-min induction by glycine treatment (cLTP). Arrows indicate mushroom spines of EGFP expressing dendritic branches, stained with anti-Shank2. Bars: 1 µm. (B,C) Mean relative protrusion density on the tertiary branches of EGFP-expressing CD1 (B) or Caskin dKO (C) hippocampal neurons with or without cLTP treatment.
Protrusion types are categorized according to their morphology (stubby, filamentous or mushroom) and Shank2 positivity. (C) Caskin dKO neurons were transfected with either EGFP only or EGFP and V5-tagged Caskin1 constructs, 24 hours before the cLTP treatment. Data were obtained from 3–4 independent cultures. All data are displayed as mean ± SEM. Asterisks represent significance compared to control cultures and the $ symbol indicates significant differences between protrusion categories. *p < 0.05; **p < 0.01, $p < 0.05. The number of analysed protrusions is indicated above the columns.
Hippocampus-dependent spatial memory and re-learning abilities were examined in the Morris water maze, with 2.5 to 5 months old Caskin dHZ and dKO animals (Fig. 2C–I). Animals were tested for 11 consecutive days, with 4 swimming sessions daily. Average swimming speed remained the same and did not differ between Caskin dHZ and dKO animals (17.03 ± 0.32 and 16.34 ± 0.32 cm/s, respectively). Caskin dHZ mice efficiently learnt the position of the hidden platform, as the number of animals failing to reach the platform within the 1-minute-long sessions was gradually reduced during the trainings (see Suppl. Fig. S3 for the daily records). Caskin dKO mice,
B
55 kDa 95 kDa
PSD-95
C
WT Caskin dKOShank2 180 kDa
55 kDa
WT dKO
D
IP inputEGFPShank2 Caskin1EGFPShank2 Caskin1
III-tubulin β
0 0.2 1.2 1 0.8 0.6 0.4
PSD-95/ III-tubulin Shank2/ III-tubulin 00.2
1.2 1 0.8 0.6 0.4
ββ
H
180 kDa
IB: Caskin1 Caskin1 _ + +
ab:
180 kDa
IB: Shank2 Caskin1
95 kDa
IB: PSD-95 Caskin1
180 kDa
IB: Caskin1 Shank2
WT WTdKO WT WT dKO
WT WT dKO WT WT dKO
_ + +
WT WT dKO WT WT dKO
_ + +
WT WT dKO WT dKO
_ + +
*
*
* *
$ 2
0 1.5 1 0.5 2.5
pS831/total GluA1/ III-tubulin rel. densityβ
WT Caskin dKO
cLTP
- + + + - +
- - - -
APV
F
2
0 1.5 1 0.5 2.5
pS845/total GluA1/ III-tubulin rel. densityβ cLTP
*
WT Caskin dKO
+ - +
- E
pS845 total GluA1 III-tubulin β
Caskin1
55 kDa 95 kDa 95 kDa 250 kDa
cLTP
+ + +
WT- - -
Caskin dKO- - + + +
APV
+
G
pS831 total GluA1
55 kDa 95 kDa 95 kDa
cLTP
+
+ +- + - - - - - +
III-tubulin β
WT Caskin dKO
Caskin1 250 kDa
+ - -
- -
- - - - - - -
A
III-tubulin β
WT dKO
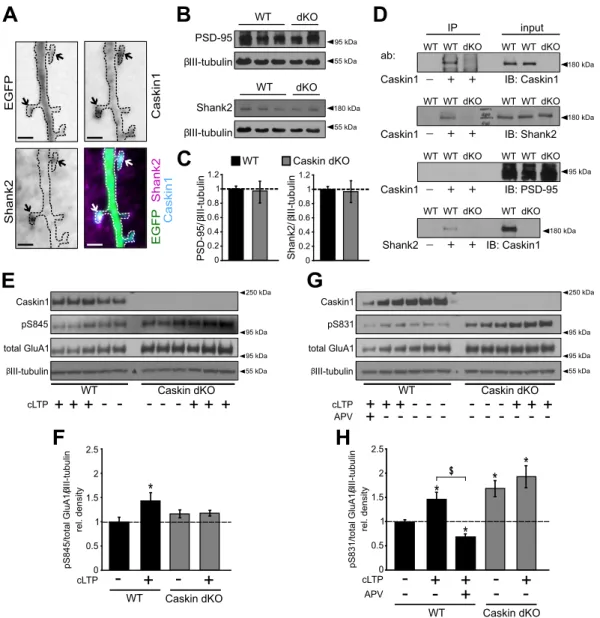
Figure 7. Caskin1 co-localizes with the postsynaptic marker Shank2 protein and regulate the phosphorylation of GluA1 AMPA receptor subunit. (A) Representative images of a Caskin dKO hippocampal neuron
overexpressing EGFP and V5-tagged Caskin1 and immunostained for the presence of endogenous Shank2 protein. Arrows indicate mushroom spines. Bars indicate 2 µm. (B,C) Comparison of endogenous PSD-95 and Shank2 levels in C57Bl6/J wild type (WT) and Caskin dKO brain lysates at the age of 3 months. (C) PSD-95 and Shank2 levels were normalized to the corresponding βIII-tubulin intensity values. In case of independent western blots, Caskin dKO ratios were normalised to WT values on the same blot and then normalised values were averaged between the independent Western blots. (D) Brain lysates of wild-type (WT) and Caskin dKO mice were immunoprecipitated with anti-Caskin1 or anti-Shank2 antibodies, and detected by antibodies against Caskin1, Shank2 and PSD-95 (IB). (E–H) Detection and quantification of S845 and S831 phosphorylation and total GluA1 levels in DIV14-16 hippocampal neuronal cultures isolated from wild-type (WT) or Caskin dKO embryos, with our without cLTP treatment. To block NMDA-receptor dependent changes, 50 μM APV was also applied. βIII-tubulin was detected as a loading control. Graphs were calculated from 4–5 independent cultures by normalizing the pS845/total GluA1/βIII-tubulin (F) and pS831/total GluA1/βIII-tubulin (H) ratios to that of the wild-type control samples. All data are displayed as mean ± SEM. Asterisks represent significance compared to wild-type control samples and the $ symbol indicates significant differences between the indicated categories.
*p < 0.05, $p < 0.05.
on the other hand, had similar failure rates during the initial or later phases of trainings. When the average num- ber of unsuccessful animals was calculated between day 1–5 and 6–10, dHZ mice performed significantly better during day 6 to 10 (Fig. 2C).
During the teaching sessions, the direction of swimming path was evaluated within a 360° plot (Fig. 2F), where orientation was calculated as the degree between the actual direction of swim and the location of the plat- form. Caskin dHZ mice performed platform-oriented swim already from day 7 on, while Caskin dKO animals had significantly less preference to swim directly towards the hidden platform even on day 10.
During additional swimming tests on day 5 and 10 (probe trials), the hidden platform was removed and the distance swam above the close vicinity of the removed platform was evaluated (Fig. 2D–E). On day 5, the performance of Caskin dHZ and dKO mice did not differ significantly. 5 days later, Caskin dHZ mice improved their performance as the swimming path above the removed platform was significantly increased, indicating a more efficient spatial learning compared to Caskin dKO animals. Taken together, lack of Caskin proteins led to impaired hippocampal spatial learning abilities.
On day 11, the hidden platform was re-positioned (Fig. 2G) and the animals were let to swim four times for a maximum of 1 minute with 30 minutes intervals (Fig. 2H–I). Caskin dHZ mice were significantly more efficient in finding the re-located platform (Fig. 2H) and the swimming distance needed to reach the platform was signif- icantly improved during the trials compared to Caskin dKO mice (Fig. 2I). These data indicate that Caskin dKO mice have less ability to modify already formed spatial memories.
Endogenous caskin regulates LTP formation in acute hippocampal slices.
As Caskin dKO mice exhibited impaired memory formation, we elucidated the consequences of deleting Caskin1 and 2 on hippocam- pal long-term potentiation (LTP; Fig. 3A–I). Acute hippocampal slices obtained from 5–7 months old Caskin dHZ and dKO mice were stimulated by 100 Hz (HFS) via the Schaffer-collaterals and field potentials were recorded from the CA1 str. pyramidale (Fig. 3A, sample traces before and after HFS are shown in Fig. 3B). Before HFS, average POP-spike amplitude was 4.18 ± 0.75 mV and 3.15 ± 0.33 mV in Caskin dHZ and dKO animals, respec- tively, indicating that the basal excitability did not differ significantly among the investigated groups (p = 0.173;Student’s t-test). In case of Caskin dHZ slices, LTP developed relatively slowly and reached a 73.8 ± 11% relative increase in population spike (POPS) amplitudes by 30 minutes following HFS. On the other hand, relative POPS amplitude was elevated only by 33.2 ± 8% and remained stable in Caskin dKO slices (Fig. 3C). Thus, the extent of LTP formation in Caskin dKO slices was significantly reduced from 15 minutes following HFS.
In order to have a more detailed evaluation of the observed differences in POPS amplitudes after HFS stimulus, E/S curves displaying the ratio between the derivative of the excitatory postsynaptic potential (dEPSP) and the POPS amplitude were determined31. The differences between the baseline and the post-tetanic stimulation values were visualized by vectors originating from the pre-HFS and pointing to the post-HFS values of the same record- ings (Fig. 3D,E). The range of pre-HFS → post-HFS vector directions was compared using polar histograms (see Material and Methods; the median of the vector directions is indicated by a thick arrow in Fig. 3F,G). As in both cases, pre-HFS → post-HFS vectors were similarly oriented towards 90° (p = 0.22, Kolmogorov-Smirnov test), our analysis indicates that mild or no dEPSP rise was accompanied by a robust POPS amplitude increase upon tetanic stimulation in both groups. Thus, HFS induces facilitation in Caskin dHZ and dKO hippocampal slices.
To compare the extent of facilitation between the different genotypes, normalized orthogonal distances of the pre- and post-HFS data points were calculated from a normalized dEPSP/POPS amplitude plot (see Fig. 3H and a detailed description of the analysis within the Materials and Methods section). As post-HFS normalized distance values were increased compared to the pre-HFS values in both Caskin dHZ and Caskin dKO recordings, our results indicate that E/S facilitation was induced by HFS in both groups but the baseline and the post-HFS values were significantly lower in the Caskin dKO group (Fig. 3I).
These results implicate that Caskin deficiency reduces synaptic efficacy under normal conditions and during LTP formation in hippocampal slices but does not block the capability for facilitation. Our detailed analysis also suggests that the increase in synaptic efficacy is mainly due to post-synaptic effects.
Caskin proteins regulate dendritic spine morphology in CA1 str. radiatum in vivo.
Impaired hip- pocampal LTP formation can be due to alterations within excitatory synapses. To our knowledge, there are no commercially available antibodies against Caskin1 or 2 which reliably detect endogenous proteins in light- or electronmicroscopy. Thus, we were restricted to perform ultrastructural analyses in Caskin dHZ and dKO hip- pocampus, concentrating on the organization of excitatory synapses within the str. radiatum of CA1 pyramidal neurons (Fig. 4A–E). Over 1000 synapse profiles were analysed from 3–3 Caskin dHZ and dKO mice. Our anal- ysis revealed that active zone length, spine area and the length of the postsynaptic density within the spine heads were significantly reduced, while spines possessed a rounder shape in Caskin dKO CA1 neurons (Fig. 4B–E).These results indicate that the lack of Caskin proteins leads to morphological alteration of both pre- and postsyn- aptic profiles within the hippocampus.
Caskin proteins do not influence synaptic release or postsynaptic mEPSCs.
Ultrastructural anal- ysis indicated altered synaptic organization in Caskin dKO hippocampus. Whole-cell patch clamp recordings can provide useful information on synaptic transmission and can determine whether pre- or postsynaptic alterations are the primary cause for the observed reduction in hippocampal LTP formation in acute slices. Unfortunately, technical difficulties hindered patch clamp measurements in hippocampal acute slices. Therefore, we performed whole-cell voltage-clamp recordings in dissociated hippocampal neuronal cultures – although these experiments can not provide a direct explanation for the observed alterations in the synaptic profiles in vivo, they can reveal whether spontaneous synaptic transmission is selectively altered by the lack of Caskin proteins.Whole-cell voltage clamp recordings were carried out in DIV14–17 Caskin WT, dHZ and dKO dissociated neuronal cultures. Spike-mediated synaptic transmission was blocked by 500 nM TTX and interevent inter- val (IEI) times, mEPSC amplitudes as well as mEPSC decay times were determined (Suppl. Fig. 3). While the frequency of mEPSC events primarily depends on the presynaptic release probability, mEPSC amplitude is determined by the neurotransmitter content of the synaptic vesicles, the density and/or the conductance of post- synaptic neurotransmitter receptors. Somewhat surprisingly, none of the analysed parameters differed signifi- cantly between WT, Caskin dHZ and dKO neurons under normal conditions (Suppl. Fig. 3A,B).
We also tested whether the overexpression of Caskin1 protein has any electrophysiological consequences in vitro. Dissociated cultures were transfected with a V5 epitope-tagged wild-type Caskin1 construct in combina- tion with the EGFP vector backbone or with the EGFP vector itself as control. 24 hours later, transfected neurons were identified by their fluorescence and were subjected to whole cell patch clamp measurement. Overexpression of Caskin1 in the recorded cells was verified following fixation and anti-V5 immunostaining (data not shown).
As presented in Suppl. Fig. 3C,D, overexpression of Caskin1 did not have any significant effects on mEPSCs characteristics.
Taken together, these data indicate that Caskin proteins do not have a detectable effect on synaptic release or postsynaptic current formation under activity deprived conditions in vitro, neither in Caskin dHZ or dKO cul- tures nor upon overexpressing Caskin1 in Caskin dKO neurons.
Caskin1 regulates protrusion density and morphology in cultured hippocampal neurons.
Synaptic plasticity is known to regulate the size and number of dendritic spines in an activity-dependent man- ner33. In order to investigate Caskin1-mediated effects on dendritic spine formation and morphology, disso- ciated embryonic hippocampal primary neuronal cultures were prepared from C57Bl6/J wild-type (WT) and Caskin dKO brains. Similarly to whole-cell patch clamp recordings, Caskin dKO cultures were transfected with a V5 epitope-tagged wild-type Caskin1 construct in combination with the EGFP vector backbone or with the EGFP vector itself as control. Transfected neurons were analysed 24 hours later, by anti-V5 immunostaining (Fig. 5A–D).
Average protrusion density in Caskin dKO neurons transfected only with EGFP was significantly reduced compared to EGFP-expressing WT neurons but was not influenced by Caskin1 overexpression (Fig. 5A). On the other hand, when morphological parameters of the protrusions were analysed in more detail (see Fig. 5B–D, plotting the length along the head-to-neck ratio [HN-index] of the individual protrusions24); the density of mushroom-like protrusions in Caskin dKO neurons was significantly lower than in wild-type neurons.
Overexpression of Caskin1 in Caskin dKO neurons increased significantly the ratio of mushroom-like protru- sions in expense for thin, filopodial-like protrusions (Fig. 5A).
Overexpressed Caskin1 was detected predominantly within the somatodendritic region of the trans- fected neurons, with local enrichment within the dendritic spine heads (Fig. 5F,G). Ultrastructural analyses in Caskin1-V5 and EGFP cotransfected neurons were processed by anti-V5 pre-embedding immunocytochemistry and visualized by DAB precipitates. Our results proved that overexpressed Caskin1 was indeed present in post- synaptic dendritic spines forming synapses (see Fig. 5E).
Taken together, our data indicate that lack of endogenous Caskin proteins leads to reduced PSD length and shrinkage of dendritic spines in vivo and decreased protrusion density in vitro, while overexpression of Caskin1 leads to the expansion of dendritic spine heads in cultivated neurons within 24 hours following transfection.
Lack of endogenous Caskins does not affect cLTP-induced morphological changes in the pro- trusions of cultured hippocampal neurons.
Protrusion density in Caskin dKO hippocampal neurons was reduced in comparison to C57Bl6/J wild-type cultures (see Fig. 5A). In order to test whether the presence or absence of Caskin proteins influence the ratio of transient or stabilized connections, Shank2 immunostaining was combined with the morphological analysis of dendritic protrusions (Fig. 6). Protrusions were classified according to their morphological features based upon their length and HN-index (see Fig. 5B–D). Stubby, filamentous and mushroom-like protrusions were then subdivided according to the presence or absence of Shank2 immunoposi- tivity. In this way, we aimed to separate stabilized spines containing PSD from those transient filopodia which did not form functional synapses yet (Fig. 6A–C and Suppl. Fig. S4). For technical reasons, CD1 wild-type (Fig. 6A,B) and Caskin dKO (Fig. 6A,C) hippocampal cultures were both used in these studies. Importantly, comparison of EGFP-expressing wild-type neurons obtained from CD1 and C57Bl6/J embryos revealed that when these disso- ciated neurons are maintained under identical culture conditions, protrusion density and morphology are very similar despite the different mouse strains used (Suppl. Fig. S4). Thus, dendritic protrusion density and Shank2 positivity between EGFP expressing Caskin dKO and CD1 wild-type cultures can be compared.Our investigations revealed that the lack of Caskin proteins significantly increased the ratio of Shank2 negative, filamentous protrusions in Caskin dKO neurons compared to CD1 cultures (0.2989 ± 0.02 versus 0.4309 ± 0.05, respectively; p = 0.025; compare dark green columns in Fig. 6B,C). This effect was reverted within 24 hours, when V5-tagged Caskin1 was overexpressed in Caskin dKO neurons (Fig. 6C; 0.3082 ± 0.06, p = 0.0301). The ratio of Shank2 positive or negative stubby and mushroom-like protrusions, on the other hand (see light and dark col- umns coloured blue and orange, respectively), did not differ significantly (Fig. 6B,C).
It is well-known that increased synaptic efficacy during LTP is accompanied by long-lasting structural changes, including the expansion of dendritic spine heads34,35. To test whether Caskin proteins have any role during LTP-dependent structural changes, we evoked glycine-induced chemical LTP (cLTP) in CD1 and Caskin dKO cultures, transfected with the EGFP vector backbone alone or in combination with the V5-tagged Caskin1 and performed the above mentioned protrusion classification (Fig. 6A–C).
In agreement with previously reported data28,36, cLTP treatment significantly increased the ratio of Shank2-positive mushroom spines (indicated with light orange) and decreased the amount of Shank2-negative