Introduction
Geographical Indications (GIs) are an unresolved issue in international trade agreements. Although there was at that time no definition of Geographical Indications, the different approaches of the European Union (EU) and the USA were a major area of dispute in the Uruguay Round negotiations.
Earlier international treaties dealt with indications of source (Paris Convention, 1883 and Madrid Agreement, 1891)and appellations of origin (Lisbon Agreement, 1958), but the term Geographical Indication (GI) was first introduced in the 1994 Trade-Related Aspects of Intellectual Property Rights (TRIPS) Agreement, under the World Trade Organi- zation (WTO) Agreement which resulted from the Uruguay Round negotiations.
By 2009 a system of GIs as a form of intellectual prop- erty had been established in 167 countries, the majority of them – including the EU – with a purpose-built (sui gen- eris) approach, while others – like the US – with a trademark approach. The vast majority of registered GI products come from OECD member states, with the large majority being registered in the European Union (Giovannucci, Josling, Kerr, O’Connor, & Yeung, 2009)
The GI system of the EU on a community level was introduced in 1992 and revised in 2006 and 2012. It has two main components. Protected Designations of Origin (PDOs) have very similar characteristics to the already existing French Appellation d’Origine Contrôlée (AOC) and Ital- ian Denominazione d’Origine Controllata (DOC) systems (Ilbery, Kneafsey, & Bamford, 2000; Lamarque & Lambin, 2015). Protected Geographical Indications (PGIs) have a German origin and have a strong reputational element but lesser link to terroir (Gangjee, 2006). The main users of EU GI policy are the Mediterranean Member States, both in terms of the number of registered products and in terms of economic importance.
The political importance of the GIs for Europe is dem- onstrated in its recent trade agreements (e.g. Comprehensive Economic and Trade Agreement (CETA) between the EU and Canada) and negotiations (e.g. the proposed but paused Transatlantic Trade and Investment Partnership (TTIP) between the EU and the USA) where GIs are over-repre- sented in the text as compared to their economic importance in both domestic production and international trade. The EU has recently commenced trade negotiations with Australia and New Zealand and GIs also feature strongly in the draft texts the EU has tabled for those negotiations1.
There are only very limited data available on the impor- tance of GI products in the EU’s agri-food industry. Based on the results of research conducted in 2010 (AND-Interna- tional, 2012), the average share of GI products in the food and drink industry is less than 6% in the then 27 EU member states. Further, 60% of the GI production is sold in domes- tic markets. Of GI exports 91% are wines or spirits. Only a few countries – in particular, France and Italy – are the main users of this GI system. Partly because of poor data, there is as yet little analysis of the economic impact of GI policy.
The number of academic articles on GIs is large. How- ever, most are theoretical or conceptual. Even the majority of the economic GI literature draws conclusions based only on theoretical discussion rather than empirical data. To the best of our knowledge, so far no study has attempted to synthe- sise the evidence-based literature on GIs.
Against this background, the aim of this paper is to esti- mate the size of the market for GI products, using empiri- cally validated sources.
To do this the article focuses on GIs for agricultural and food products, including wines and spirits. All non-agri- culture related products and services are excluded and are beyond the scope of this research. After a methodological introduction we analyse the market size of these GI products,
1 http://ec.europa.eu/trade/policy/countries-and-regions/negotiations-and-agreements/.
Accessed on the 19th November 2018.
TÖRÖK Áron* and Hazel V. J. MOIR**
The market size for GI food products – evidence from the empirical economic literature
In order to understand the global importance of foods with Geographical Indications (GIs), it is essential to get an overview of the market size for such products. In spite of the relative importance of GI policy in EU trade agreements, there are only very limited data available on the actual market size for GI labelled products. Against this background this paper collects all the available data that provides estimates of the market size for GI foods, analysing the available datasets and reports of the European Commission and conducting a systematic literature review on the academic papers related to this topic. Based on the results we can underline the high level of concentration of GI products in terms of origin and product category. The most important GI market is the domestic market of the European Union even though the share of GI production is only a minor part of total agri-food output. On the other hand, GI products with both significant market size (domestic and export) and remarka- ble market share also exist, but these are a small set of all registered GI products and are concentrated in only a few countries.
Keywords: Geographical Indications, market size, international trade agreements, literature review, food quality schemes JEL classifications: L15
* Budapesti Corvinus Egyetem, 1093 Budapest Fővám tér 8., Hungary. Corresponding author: aron.torok@uni-corvinus.hu
** Australian National University, Canberra, Australia.
Received: 15 August 2018; Revised: 16 November 2018; Accepted: 19 November 2018.
focussing on the very limited public data provided by the EC, on the grey literature (also commissioned by the EC) and most importantly, on the empirical academic literature.
The final part concludes.
Methodology
In order to achieve a comprehensive overview of the empirical findings on GIs, a wide online literature search was conducted using five electronic databases: JSTOR, ProQuest, Science Direct, Scopus and Web of Science. The combination of the keywords “geographic*” and “indica- tion*” were used. These search terms had to appear in the title, in the abstract, or in the keywords of the sources. In addition, the article should contain empirical data and/
or analysis accompanied by information on data selection, sample size and analytic techniques that were used. We also restricted the search to articles published in English or with some information available in English.
In addition, we included key reports commissioned by the European Commission. We also reviewed the references identified in the most important articles we found and added these to our bibliography.
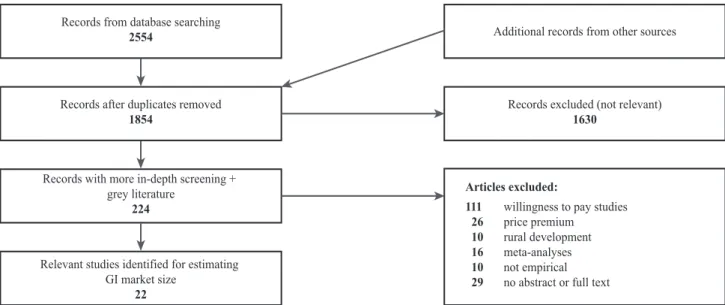
The initial search obtained 2,554 entries across all data- bases. After removing duplicates 1,854 studies were identi- fied that might provide empirical material on GIs. To ensure that only relevant articles were included in the final analysis and to eliminate duplicates, the online software package Cov- idence was used. The screening and identification process is illustrated in Figure 1. Once duplicates had been removed, all articles were screened for relevance to the study. Initially this screening was undertaken independently by each author.
The authors then discussed the articles where there were dif- ferent screening outcomes. This initial screening led to 1,630 articles being excluded. The remaining 224 articles together with the grey literature were also each screened indepen- dently by both authors. Again this was followed by discus- sion of the merits of each study. At this last stage a sub-set of
111 articles which addressed the “willingness to pay a price”
premium were identified, giving only an indirect estimation on GI market size; consequently, they were not included in this paper. Key GI topics not related to market size (price premium and rural development) were also excluded from this paper. Other criteria for exclusion were that the article was itself a meta-analysis – we reviewed the papers iden- tified in these meta-analyses and added 265 articles to the dataset. Additionally we could not readily obtain sufficient information to assess some articles; others turned out not to be empirical. The final set of relevant articles with empirical material on GI market size was 20 publications from the sys- tematic literature review with 2 additional studies from the grey literature, resulting in 22 publications altogether.
Cheese is the most frequently studied GI product. Other GI products often studied are processed meat products (mainly ham), alcohol (wine or spirit), olive oil and vegeta- bles (Figure 2), in line with the number of products in the EU GI system (see Table 1 and Table 2 later).
As to the territorial focus of these empirical studies, the dominance of the Mediterranean countries of the EU is clearly indicated (Figure 3). Italian, French and Spanish GI products were researched most frequently. This is not sur- prising as these are the countries that make most use of GI labelling (see Table 2 later), though the low number of Por- tuguese papers is unexpected.
Market size
In the absence of official economic data, it is hard to give even an estimate of the total market size of GI products.
Unlike that which exists for EU organic produce (another food quality scheme of the European Union), there is no hard economic data available in European statistics (e.g. in Eurostat).
The Farm Accountancy Data Network (FADN) system was established to measure the income level of agricultural producers in the European Union and the design does not
Relevant studies identified for estimating GI market size
22
Records with more in-depth screening + grey literature
224
Records after duplicates removed 1854
Records from database searching
2554 Additional records from other sources
Articles excluded:
111 willingness to pay studies 26 price premium
10 rural development 16 meta-analyses 10 not empirical 29 no abstract or full text
Records excluded (not relevant) 1630
Figure 1: Process used to identify empirical GI studies on market size.
Source: own composition
allow for measurement of the effects of GI production. How- ever, the FADN dataset is built up by summarising data gath- ered by national surveys conducted in the Member States, and each Member State has the opportunity to extend their national survey with additional questions. In some EU coun- tries (e.g. in Italy, Hungary) there are some GI related data, but these are mainly limited to information about whether the producer is participating in any food quality scheme, therefore no exact estimation on the market size could be found.
Against this background we try to summarise all the information from three different sources. First, the online GI databases of the EC are summarised, giving an overview on the number of GI products. Next, the several studies con- ducted for the EC are investigated, while the last part col- lects the literature review based empirical evidences of the academic papers.
Public databases
Regarding the number of registered products, the EU has public databases for all the four GI regimes (agricultural prod- ucts and foodstuffs, wines, spirits, aromatized wines) but these contain only the appellation of the product and some technical/
formalities data (e.g. country of origin, type of product, date and status of the several stages of the registration process etc.).
Table 1 summarises the number of GI products, refer- ring to the status as at 15th November 2018. Altogether 4.551 GI names are protected under the EU GI system, 74.4% of them from the European Union, and the remaining 25.6%
is from outside, most dominantly wines from the USA and South-Africa. As to the share between the four GI regimes, wines together with agricultural products and foodstuffs had the most GI designations (64% and 30% respectively), while very few aromatised wines were protected.
Table 1: GI products registered under the four EU GI regimes by the 15th November 2018.
EU non-EU Total
number of
products share number of
products share number of
products share
Agricultural products and foodstuffs 1,354 40% 26 2% 1,380 30%
Wines 1,766 52% 1,138 98% 2,905 64%
Spirits 260 8% 1 0% 261 6%
Aromatised wines 5 0% 0 0% 5 0%
Total 3,385 1,165 4,551
Note: GI wines also includes wines with name of origin and geographical indications, both from Third Countries.
Source: EC database of DOOR (Agricultural products and foodstuffs), E-Bacchus (wines), E-Spirit-Drinks (spirits) and Register of geographical designations of aromatised drinks based on wine products (aromatised wines). All electronic databases were accessed on the 15th November 2018.
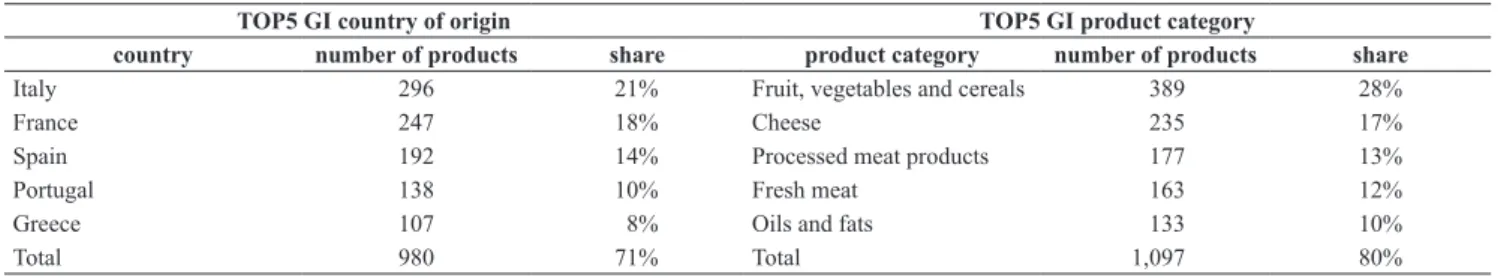
Table 2: TOP5 GI country of origin and product category in the DOOR database.
TOP5 GI country of origin TOP5 GI product category
country number of products share product category number of products share
Italy 296 21% Fruit, vegetables and cereals 389 28%
France 247 18% Cheese 235 17%
Spain 192 14% Processed meat products 177 13%
Portugal 138 10% Fresh meat 163 12%
Greece 107 8% Oils and fats 133 10%
Total 980 71% Total 1,097 80%
Source: own composition based on the DOOR database (2018)
Number of Studies
0 1 2 3 4 5 6 7 8 9 10
Fruits&vegetables
Olive oil
All kind
Alcohol
Ham&Meat
Cheese
Figure 2: Products investigated.
Source: own composition
Number of Studies
0 1 2 3 4 5 6 7 8 9 10
ThailandPortugal United KingdomSwedenDenmarkBelgiumBrazilHungaryGermanyGreeceFranceSpainEurope/EUItaly
Figure 3: Territorial focus.
Source: own composition
The register for agricultural products and foodstuffs is the most heterogenous category, including both uneatable agricultural outputs (e.g. hay and wool) or alcoholic drinks (beers), and also many foodstuffs. In terms of country of origin and product categories there is a very strong concen- tration in a few countries (Table 2). The five countries with the highest number of registered GI products are all Mediter- ranean EU member states, representing 71% of all registered GI products. The concentration by product categories is even more marked (80% from just five categories), including products with both low (e.g. cereals) and high (e.g. cheese or processed meat) levels of value added.
It should be kept in mind that these publicly available datasets are simple lists of registered GI names. By way of example, the UK had only one single GI spirit (Scotch Whisky) but this product alone represented the 81% of the total British GI sale in 2010, and in the same year, together with the French Cognac these two products represented 98%
of total EU GI spirit exports. On the other hand, in 2010 almost every 10th European food GI name was Greek (mainly olive oils and fruits) but the GI sales value of Greece was only 2% of the total EU GI sale (AND-International, 2012)
Grey literature
In the next step we summarize the grey literature, studies done for the European Commission estimating market size of the GI products.
One of the most comprehensive reports is that done by London Economics (2008). This report pointed out that “the lack of comprehensive data on the number of PDO and PGI producers, the size of the agricultural land devoted to PDO/
PGI production, the value and volume of production and the value of sales is a serious constraint to the monitoring and evaluation of the scheme at national and EU level” (p. 254).
In 2018 it remains a serious constraint.
In the report the authors also ran a basic econometric model in order to test what factors influence the number of registered PDO and PGI products (and so indirectly the mar- ket size) in the EU member states. They found that the size of the total agricultural sector, strong support of the State for
GI applications and being a Mediterranean country all have statistically significant positive effects on the number of GI registrations. In contrast, being a New Member State (join- ing the EU in 2004 or after) has a negative influence.
Building on this analysis, it is possible to compare EU Member States in terms of their relative number of GI regis- trations and to assess whether the share of GI registrations is higher or lower than one might expect based on population, market size (measured by GDP) or share of agricultural value added. The three right hand columns of Table 3 show this. If the value shown, for example in the most right-hand column is 1.0, this means that a country has exactly as many GIs reg- istered as one would expect based on that country’s share of EU agricultural value added. France, for example has exactly the share of GIs expected from its large agricultural sector.
On the other hand, Italy has more GIs than one would expect – about 50% more. But the countries which really use the GI system far more than the size of their agricultural sector would lead one to expect are Portugal and Greece. The data in Table 3 also show clearly that other EU members are not big users of the GI system. Although Germany contributes over 10% of EU agricultural value added, it has only 7% of EU registered GIs.
Hungary, like Poland, as yet does not make much use of the EU’s GI policy. Both countries substantially under- use GIs compared to all measures of size – population, GDP and agricultural value added. However, with an initiative announced in 2015 the Hungarian Government is now trying to double the number of registered GI products in the coming years, providing all the resources for the Hungarian produc- ers registered in a national quality labelling program.
Regarding the number of GI producers/processors, only limited data were available from the London Economics report, and only for some South European countries. In Italy 3.4% of farmers and 17.7% of processors were involved in the GI industry. France had data only for farmers, and of these 14.7% were PDO and 2.9% PGI producers.
For turnover, even less data could be found: the estimates for France, Germany, Italy and Spain showed that “the con- tribution of the PDOs/PGIs is small but not insignificant, accounting for between 1% and 5% of the turnover of the agri-food sector” (p. 108), with around 10 billion EUR of Table 3: Shares of GIs, GDP, population and agricultural value added
Share of EU total
GI share of food and drink industry, 2010,
%
Over-under representation of GIs vis-à-vis indicator GIs by 2012,
%
Population, 2012,
%
GDP (PPP) 2012,
%
Agricultural value added (Ag VA), 2000-07,
%
pop GDP Ag VA
Germany 7.0 16.0 20.0 10.6 3.8 0.4 0.3 0.6
France 18.0 13.1 14.0 18.3 14.5 1.4 1.3 1.0
UK 4.8 12.7 13.4 7.6 6.2 0.4 0.3 0.6
Italy 22.1 11.9 11.9 14.9 9.5 1.9 1.9 1.5
Spain 14.8 9.3 8.6 13.3 5.7 1.6 1.7 1.1
Poland 2.0 7.7 5.0 4.7 n/a 0.3 0.4 0.5
Hungary 1.1 2.0 1.3 1.5 n/a 0.6 0.9 0.7
Greece 8.6 2.2 1.6 3.9 9.5 3.9 5.3 2.2
Portugal 10.9 2.1 1.5 2.0 8.3 5.2 7.1 5.6
Source: Moir (2016, p. 7.) Original GI data from DOORS (downloaded 26 October 2016, including all registrations filed by the end of 2012 and “registered”, but excluding 17 non-European registrations). GDP and population figures from http://knoema.com; agricultural value added figures (for 2000-07 in €millions) from London Economics (2008, p.
52.); share GIs in food and drink industry from AND-International (2012, p. 24.).
(2009) focused on concentration in the Italian GI sector, they also provide data on market size. Italy had the highest num- ber of PDO and PGI registrations, but only 15 designations represented 90% of Italian turnover of registered PDOs.
These were mainly cheeses and processed meat products. In order to describe the economic characteristics of the Italian GI sector, they used a survey from the QUALIVITA Asso- ciation and found that total Italian GI turnover was about 4,935 billion EUR (of which 85% was from PDO and 15%
from PGI products), involving 119,000 firms (about 112,500 producers and 6,500 processors). PDO farms dominated, representing 89,000 firms, mainly in cheese and olive oil production. Average turnover varied between GI sectors. For meat products and cheeses, average turnover stood at 1.0 million and 1.5 million EUR respectively but other sectors were much smaller (e.g. 11,000 EUR for olive oils). Usually PGI firms had higher average turnover. They also found that Italian PDO products are sold mainly on the domestic (86%) and European markets (8%), while PGI exports are targeted more outside of Europe (e.g. 43% of PGI olive oils were sold outside of the EU).
Tibério and Francisco (2012) analysed the GI food mar- ket in Portugal finding a sales value of 70 million EUR in 2007. They found that only the 68% of registered GI out- put was sold in the real market, while the rest was sold via informal (undocumented) transactions and barter. Most Por- tuguese GI output is produced by very small scale producers.
Galli, Carbone, Caswell, and Sorrentino (2011) tried to measure the actual performance of Italian PDO cheeses, selecting 11 of the 34 registered in 2008. They found that the average turnover of an Italian PDO cheese producer in 2008 was around 50 million EUR based on 6,232 tons of produc- tion. These numbers varied a considerably between different cheeses – the biggest was Gorgonzola with 223.3 million EUR and 35,567 tons, while the smallest Murazzano with 0.2 million EUR and 22 tons of production, respectively.
Concerning their market performance, a general decreasing in the period 2004 to 2008 was observed – for 6 cheeses market share fell. It is also interesting to note that the share of exports was more than 20% of total production only for three cheeses (Gorgonzola 28.5%; Pecorino Siciliano 55.5%
and Pecorino Romano 83.3%).
Balogh and Jámbor (2017) investigated the European cheese industry, focusing only on the EU27 internal market as 80% of EU cheese exports is sold within the EU. Using data for these 27 countries for the period 1990 to 2013, and a GI indicator they found that the presence of a cheese PDO had a positive and significant effect on revealed comparative advantage. Thus EU countries with a registered cheese PDO had a comparative advantage over EU countries which did not.
Carbone, Caswell, Galli, and Sorrentino (2014) did an ex post assessment of the performance of Italian PDO cheese and olive oil between 2004 and 2008. They used a multi- criteria analysis framework and found that the market size performance of smaller PDO producers is better than that of bigger PDO producers as smaller producers are better con- nected to the place of origin and reach niche market seg- ments. In contrast, producers of lower ranked PDO products (based on the multi-criteria analysis) target wider markets GI turnover in these countries. For Greece, the Ministry of
Rural Development and Food provided data for soft cheese production in 2002. The share of the PDO varieties (feta, Kasseri and Kefalograviera) among soft cheeses was more than 86% with feta dominating (79% of total Greek soft cheese production).
By far the most comprehensive research on the EU GI market was conducted by AND-International (2012). The report was commissioned by the EC and gave an overall view of all the four GI regimes in the EU. The authors used both primary (direct and indirect surveys) and secondary (centralised datasets) data.
In respect of sales value of EU GI production between 2005 and 2010 they found that wines dominate with a share of 55.9%. Agricultural products and foodstuffs represented 29.1%, and spirits 15.0%. During these years GI products had a sales value of between 48.4 and 54.3 billion EUR, with 12% growth between 2005 and 2010. Overall GI products contributed 5.7% of the total European food and drink sales value. The five most important GI products were GI wines from France, Italian foodstuffs, Italian wines, UK spirits and Spanish wines. Together these five products contributed 65% of the total sales value. The 12 most important products brought this share to 90%.
Altogether 19.5% of total GI production was exported to extra-EU markets while 20.4% was sold within the EU in 2010. For wines and spirits 87% and 64% of the total export was GI labelled, meaning that the 16% of the GI wines and 57% of GI spirit production was exported, respectively. In contrast for foodstuffs, only 2% of exports were GI labelled – that is just 6% of the total EU GI foodstuff production was sold to extra-EU markets. Exported products came mainly from France, the UK and Italy (86% of total export value), dominated by very few designations (Champagne, Cognac, Scotch Whisky, Grana Padano and Parmigiano Reggiano).
The most important trade partner was the USA, followed by Switzerland, Singapore and Canada.
Overall we can say that for EU GI production the domes- tic market is the most important (60.1% in 2010). Intra-EU trade (20.4%) exceeds extra-EU exports (19.5%). As extra- EU exports include countries such as Switzerland, the vast majority of European GI product – especially foodstuffs – is sold within Europe.
As was already mentioned, on average 5.7% of Euro- pean food output was GI labelled in 2010, but there was remarkable difference between Member States. The share of GI production in total food output exceeded 10% in France (14.5%). For Italy, Greece and Portugal the share was between 8% and 10%. In 15 Member States the share was less than 4%.
To summarise, we can conclude that European GI pro- duction is dominated by French wines, Italian wines and cheeses, German wines and beers, Spanish and Portuguese wines and Scotch Whisky.
Academic literature
Turning to the academic studies, only a few provided quantitative data on market size. While Arfini and Capelli
through conventional distribution channels. While their products rank lower on the multi-criteria analysis they have a higher quantity, and a larger production area and turnover.
An important issue in looking at the potential market size for GI products is the issue of how price and quantity interact. We found one study which estimated price elastici- ties. Monier-Dilhan, Hassan, and Orozco (2011) undertook research on the French cheese industry, focusing on 11 PDO and 10 non-PDO varieties. They used home scan data on cheese purchases in France between 1998 and 2003. Their main objective was to compare price elasticities for the dif- ferent types of cheese. Price elasticities measure the extent to which volume sold varies with the price. They found that the PDO cheeses are as price elastic – or even more price elastic – than the non-PDO standard products. This means that when the price of both a PDO and a standard cheese increases, the demand for the PDO cheese decreases more than for the standard product. This also means that a price increase among PDO producers would lead to a decreasing market (share) – “consumers are not more but less loyal to PDOs than to standard products” (p. 17). They also found little price substitutability between the PDO and non-PDO products, though these goods (both the GI and non-GI vari- eties) are trademarked. Competition between the different products is therefore influenced by both the trademark repu- tation and the GI reputation.
As noted earlier, it is extremely complex trying to sepa- rate the influences of product quality, product origin, a GI label and a trademark label. The studies briefly reviewed here indicate the complexity and challenges of such analy- ses. When one then adds that GI policy applies across a vast range of different foodstuffs, with very heterogeneous char- acteristics, trying to find patterns in how GI policy works is challenging indeed.
A small number of studies looked specifically at GI export issues. Leufkens (2017) estimated the effects of the EU GI regulation on several trade flows using a gravity model approach and UN Comtrade data for 1996 and 2010.
The results demonstrated that the EU GI system has a sig- nificant trade effect on both the intra- and extra-EU bilat- eral trade. The empirical results showed that, for foodstuffs only, PGI labels had a trade-creating effect, while for wines and spirits only PDOs have trade-creating effects. Surpris- ingly the results showed that foodstuff PDOs and wine/spirit PGIs had trade-diverting effects. These results raise complex questions for policy makers.
The most exported Tuscan PDO/PGI products were the subject of research conducted by Belletti et al. (2009). They found that PDO/PGI is often used as a defensive tool, but for the smaller producers it is also a marketing opportunity. From the four products included in the study, export was remark- able only for olive oils (two-thirds of production exported).
PDO oils were mainly sold on EU markets (65%), while PGI oils targeted extra-EU markets (60% sold to the USA). They also found that “firms trading on foreign markets with their own brands [trademarks] show a lower interest in PDO or PGI, in order to avoid a conflict between (collective) PDO/
PGI and firms’ brand name” (p. 220). So this study suggests that, in practice, GI labels and trademarks are not always useful complements.
The European ham trade was investigated by Török and Jámbor (2016). They found that in the period 1999 to 2013 revealed comparative advantage in the European ham trade was affected by having a GI linked to the production area.
Where the producing country had a GI recognition for its ham industry, the Revealed Symmetric Comparative Advan- tage index was significantly higher, indicating a comparative advantage for those producing countries (8 out of the 27 EU member states) which used GI labelling.
One study looked at European imports of GI labelled products. Wongprawmas et al. (2012) explored the factors affecting the opportunities for Thai GI fruit and coffee prod- ucts in Europe. Europe is already an important destination for Thai tropical fruits and green coffee beans, but these products are not price competitive with comparable prod- ucts from China and Vietnam. To try to gain a competitive advantage based on quality the Thai government introduced a GI system in 2008. Based on semi-structured interviews with distribution channel representatives they found that there might be a space for them in the European market, but the GI attribute alone might be not enough for the suc- cess of the product. While GI labels might help to gain the trust of importers, quality control and traceability are also very important. The study concluded that GI labelling alone would not gain market access in Europe for these Thai prod- ucts.
A number of studies looked at institutional issues associ- ated with GI markets and their potential. Bardají et al. (2009) analysed the Spanish beef market surveying a representative sample of retailers in Navarra. They found that geographical origin and designation of origin usually do not appear to be among the most important concerns of retailers. The results of the logistic regression showed that for the retailers, ori- gin and appellation alone is not really important, but as their consumers prefer these logos, they sell these products.
Dentoni et al. (2010) analysed the market for the “Pro- sciutto di Parma” PDO with in-depth interviews with mem- bers of the Consortium. Even though Parma ham is one of the most well-known Italian GI products, the supply side of this market is highly heterogeneous. Smaller producers with mostly PDO production would like to have stricter regula- tions (controls and standards), closely following the PDO standard. In contrast, larger producers – who also have sig- nificant non-PDO production – would prefer more flexibility, using both a PGI labelled Parma ham and a PDO labelled Parma ham. As yet there has been no success in establishing a PGI registration for Parma ham.
Kizos and Vakoufaris (2011) investigated the olive oil market in Lesvos Island, Greece. In analysing the olive oil supply chain they noted the importance of self-consumption among small scale farmers (29% of the total production), and that most of the marketed olive oil is sold in bulk. Less than 1% of the total olive oil production in Lesvos Island was sold bottled with a PGI label even though the PGI olive farmers received additional payment for specific types of farming and quality production.
Tregear et al. (2016) conducted interviews with PDO onion producers in Hungary. Their value chain analysis gave special attention to upgrading opportunities for onions (mostly sold as a raw material), and how these farmers could
capture higher margins and access to bigger markets. Like Tibério and Francisco (2012), they found that a market ori- entation is vital for good sales outcomes for small scale GI products. Adding more value to the onion production via diversification can be reached by building effective net- works, involving regional actors external to the value chain.
Cooperation with the tourism and hospitality sectors would also be beneficial for onion farmers as they might then get access to larger markets and increase their sales volume.
A number of papers focused on market size for GI labelled wines. Teuber (2011) analysed the market for a German GI apple wine, looking at both supply (single in-depth interview with producers’ association) and demand (online structured questionnaire, n=741). The producer side results showed that the main reason for registering the PGI was to protect against free-riders and imitations and to prevent price erosion due to such competition. This finding is not in line with previous studies indicating that the main reason for using PGIs is to promote the product. In the case of this German apple wine the GI contribution was only to maintain the market size of the product. The consumer data indicated low awareness of the GI system and that the hypothetical willingness to pay for the product is due to consumers’ expectations of a contri- bution to the local economy.
De Mattos et al. (2012), in their literature review paper, found that in case of Brazilian GI wine from the Vineyard Valley, market-driven organizations can use a PGI label to gain access to export markets and increase their export earnings. After the GI registration of the wine the number of wineries more than doubled in the protected region. This does not, of course, indicate causality, as wine sales gener- ally were increasing at this time (2000-2011).
For Central European fruit spirits, Török and Jámbor (2013) found that GI labelled products lost their market advantages after EU accession. Using Eurostat CN8 trade data and the theory of revealed comparative advantage, they showed that while some South European GI spirits (e.g.
grappa) are prospering, the majority of the Central European GI spirits have lost market share in Europe despite GI rec- ognition.
Another trade related study used the gravity framework with Eurostat CN8 data between 1995 and 2009 to analyse the effects of GIs on quality wines exports (Agostino and Trivieri, 2014). They focused on quality wines produced in specified regions in France, Italy and Spain. In these Medi- terranean countries the share of these wines in total wine export is relatively high: in France it oscillates around 60%, while Spanish and Italian shares fluctuated, reaching 40% by 2009. The average unit price of quality wines produced in the specified regions is significantly higher than the value of ordinary table wines.
These results showed that quality wines produced in specified regions have higher export values, accompanied by higher export volumes in high-income importer coun- tries (West Europe and East Asia and Pacific, high income).
These GI wines are associated with higher margins, but the higher margins vary among the producers. French wines gain a higher benefit from the GI label (both in terms of market access and price) than do their Italian and Spanish competitors.
Agostino and Trivieri (2016) also studied bilateral exports of wine from France, Italy and Spain in the period 2010- 2013. They tried to measure the performance of these South European PDO, PGI and other (not GI labelled) wines in the markets of Brazil, Russia, India, China and South Africa (the BRICS countries). They concluded that wines sold with PDO labels in these markets have a high export value mainly due to the high prices of the products, especially for French wines, where PDO price premium is always the highest. For PDO products in the BRICS countries the price premium effect (505%) is higher than the volume effect (153%). PGI wines gained only a slight price premium without any posi- tive volume effect.
Finally, one paper looked at the interaction between GI labelling and trademarks. Drivas and Iliopoulos (2017) tried to find correspondences between GI and trademark activity.
Looking at 13 European countries, they found that only a very small proportion of agrifood products use the PDO/PGI system, though activity in trademarks and in GIs are strongly correlated. Both trademarks and GI labels are used for prod- uct differentiation, and both are important in accessing new markets. Products with GI/trademark labels entering new markets can use these labels to differentiate themselves from existing products on the market.
Conclusions
The outstanding finding of this study is the massive lack of relevant economic data to support GI policy. At the EU level there is no centralised data collection about GI prod- ucts, except the official registration databases (DOOR, E-Bacchus, E-Spirit-Drinks). In some EU countries where the GI industry is strong enough, there are specific initiatives for GI data collection (e.g. Qualivita in Italy) at the national level, but overall we can say that there is a lack of statistical data of the GI sector across the EU. This contrasts with the situation for other food quality schemes, where easily acces- sible datasets are available (e.g. EUROSTAT data for organic production).
From our present perspective, the most fundamental issue is how large the market for GI foods might actually be. Based on the findings of the paper we can conclude some overall findings.
First, the share of GI production is low. Though the last comprehensive analysis has data from 2010, even in the European Union’s overall food production GI had less than 6% share on average. Since that time the number of GI prod- ucts increased and some exceptions exist (e.g. see the signifi- cant share of GI – Feta - in the Greek soft cheese industry), but it is likely that GI products still play a minor role in the (European) food industry. The low GI share in production is accompanied with relatively small number of GI product types: fruits and vegetables, cheeses, meats (both fresh and processed) and (olive) oils are the most often registered GI varieties.
Second, it is useful to remember that most GI-labelled foods do not travel very far – in the EU the vast majority of GI foods are sold within the country where they were pro- duced. Only small quantities are sold outside the EU, mainly
to the USA, Switzerland, Singapore and Canada. The rela- tively small export market is concentrated not only in terms of destination but also in terms of origin and products. The GI export of the EU mainly consists of wines, spirits and cheeses.
Third, significant differences exist between the GI pro- ducing countries. Both the domestic and external EU GI market is heavily dominated by Mediterranean European countries (mainly by France, Italy and Spain) with wider GI product portfolio, while the other countries either have only few strong GIs (e.g. Scotch whisky or German beers) or have many small designations with limited and local importance (e.g. olive oils in Greece).
All these findings are reflected in the fact that, in nego- tiating bilateral trade treaties, the EU seeks recognition for only a small proportion of registered GI food names. For example in CETA only 148 foodstuffs are listed in the Treaty.
It is only these that will have the strong form of GI protection in Canada and there are exceptions for 8 of these products (Moir, 2017, p. 1032). The Treaty does allow for the addi- tion of new names, but, in principle, this would not include other names registered in the EU at the time the Treaty was finalised. The main beneficiaries of the EU’s GI trade nego- tiations are therefore a limited set of producers producing specific products from a few member states.
Acknowledgements
The “Understanding Geographical Indications” project was undertaken by the ANU Centre for European Studies with funding from the European Commission’s Jean Monnet program.
This paper was supported by the János Bolyai Research Scholarship of the Hungarian Academy of Sciences and by the National Research, Development and Innovation Office projects of FK124800 and PD124791 “Economical and Social Impacts of Food Quality Schemes and Short Food Supply Chains in Hungary”.
References
Agostino, M. and Trivieri, F. (2014): Geographical indication and wine exports: an empirical investigation considering the ma- jor European producers. Food Policy, 46, 22-36. http://doi.
org/10.1016/j.foodpol.2014.02.002
Agostino, M. and Trivieri, F. (2016): European Wines Exports To- wards Emerging Markets. The Role of Geographical Identity.
Journal of Industry, Competition and Trade, 16 (2), 233-256.
http://doi.org/10.1007/s10842-015-0210-z
AND-International. (2012): Value of production of agricultural products and foodstuffs, wines, aromatised wines and spirits protected by a geographical indication (GI). Retrieved from https://ec.europa.eu/agriculture/sites/agriculture/files/external- studies/2012/value-gi/final-report_en.pdf
Arfini, F. and Capelli, M.G. (2009): The resilient character of PDO/
PGI products in dynamic food markets. Paper presented at the 113th EAAE Seminar “A resilient European food industry and food chain in a challenging world”, Chania, Crete, Greece.
Balogh, J.M. and Jámbor, A. (2017): Determinants of revealed comparative advantages: The case of cheese trade in the
European Union. Acta Alimentaria, 46 (3), 305-311.
http://doi.org/10.1556/066.2016.0012
Bardají, I., Iráizoz, B., & Rapún, M. (2009): Protected Geographi- cal Indications and Integration Into the Agribusiness System.
Agribusiness, 25 (2), 198-214. http://doi.org/10.1002/agr.20198 Belletti, G., Burgassi, T., Manco, E., Marescotti, A., Pacciani, A. and
Scaramuzzi, S. (2009): The roles of geographical indications in the internationalisation process of agri-food products. In M.
Canavari, N. Cantore, A. Castellini, E. Pignatti, and R. Spadoni (Eds.), International marketing and trade of quality food products (pp. 201-221): Wageningen Academic Publishers.
Carbone, A., Caswell, J., Galli, F. and Sorrentino, A. (2014): The Performance of Protected Designations of Origin: An Ex Post Multi-criteria Assessment of the Italian Cheese and Olive Oil Sectors. Journal of Agricultural and Food Industrial Organiza- tion, 12 (1), 121-140.
De Mattos Fagundes, P., Padilha, A.C.M. and Padula, A.D. (2012):
Geographical indication as a market orientation strategy: An analysis of producers of high-quality wines in Southern Brazil.
Journal of Database Marketing & Customer Strategy Manage- ment, 19 (3), 163-178. http://doi.org/10.1057/dbm.2012.18 Dentoni, D., Menozzi, D. and Capelli, M.G. (2010): Heterogeneity
of Members’ Characteristics and Cooperation within Producer Groups Regulating Geographical Indications: The Case of the
“Prosciutto di Parma” Consortium. St. Louis: Federal Reserve Bank of St Louis.
Drivas, K. and Iliopoulos, C. (2017): An Empirical Investigation in the Relationship between PDOs/PGIs and Trademarks.
Journal of the Knowldege Economy, 8 (2), 585-595. http://doi.
org/10.1007/s13132-016-0386-4
Economics, L. (2008): Evaluation of the CAP Policy on Protected Designations of Origin (PDO) and Protected Geographical In- dications (PGI). Final Report, EC, 2018.
Galli, F., Carbone, A., Caswell, J.A. and Sorrentino, A. (2011): A multi-criteria approach to assessing pdos/pgis: An italian pi- lot study. International Journal on Food System Dynamics, 2 (2011), 219-236.
Gangjee, D. (2006): Melton Mowbray and the GI pie in the sky:
exploring cartographies of protection. Intellectual Property Quarterly, 3, 291-306.
Giovannucci, D., Josling, T., Kerr, W., O’Connor, B. and Yeung, M.T. (2009): Guide to Geographical Indications: Linking products and their origins. International Trade Centre, Geneva, Switzerland, p. 232.
Ilbery, B., Kneafsey, M. and Bamford, M. (2000): Protecting and promoting regional speciality food and drink products in the European Union. Outlook on Agriculture, 29 (1), 31-37.
Kizos, T. and Vakoufaris, H. (2011): Valorisation of a local asset:
The case of olive oil on Lesvos Island, Greece. Food Policy, 36 (5), 704-713. http://doi.org/10.1016/j.foodpol.2011.06.005 Lamarque, P. and Lambin, E.F. (2015): The effectiveness of marked-
based instruments to foster the conservation of extensive land use: The case of Geographical Indications in the French Alps.
Land Use Policy, 42, 706-717. http://doi.org/10.1016/j.landuse- pol.2014.10.009
Leufkens, D. (2017): EU’s regulation of geographical indications and their effects on trade flows. German Journal of Agricultural Economics, 66 (4), 223-233.
Moir, H. V. J. (2016): Geographical indications: EU policy at home and abroad. Paper presented at the IP Statistics for Decision Makers (IPSDM) conference, Sydney, Australia, 15-16 No- vember 2016.
Moir, H. V. J. (2017): Understanding EU trade policy on geographi- cal indications. Journal of World Trade, 51 (6), 1021-1042.
Monier-Dilhan, S., Hassan, D. and Orozco, V. (2011): Measuring consumers’ attachment to geographical indications. St. Louis:
Federal Reserve Bank of St Louis.
Teuber, R. (2011): Consumers’ and producers’ expectations towards geographical indications: Empirical evidence for a German case study. British Food Journal, 113 (7), 900-918. http://doi.
org/10.1108/00070701111148423
Tibério, L. and Francisco, D. (2012): Agri-food traditional prod- ucts: From certification to the market - Portuguese recent evolu- tion. Regional Science Inquiry, 4 (2), 57-86.
Török, Á. and Jámbor, A. (2013): Competitiveness and Geographi- cal Indications: The Case of Fruit Spirits in Central and Eastern European Countries. Studies in Agricultural Economics, 115 (1), 25-32.
Török, Á. and Jámbor, A. (2016): Determinants of the revealed comparative advantages: The case of the European ham
trade. 62 (10), 471-481. http://doi.org/10.17221/177/2015- AGRICECON
Tregear, A., Török, Á. and Gorton, M. (2016): Geographical In- dications and Upgrading of Small-Scale Producers in Global Agro-food Chains: A Case Study of the Mako Onion Protected Designation of Origin. Environment and Planning A, 48 (2), 433-451.
Wongprawmas, R., Canavari, M., Haas, R. andAsioli, D. (2012):
Gatekeepers’ Perceptions of Thai Geographical Indication Products in Europe. Journal of International Food and Agribusi- ness Marketing, 24 (3), 185-200. http://doi.org/10.1080/08974 438.2012.691790