DOI: 10.1556/066.2018.47.1.15
Preliminary communication
PHYSICOCHEMICAL CHARACTERISTICS AND PROXIMATE COMPOSITION OF WHEAT CULTIVARS FROM THE CANARY
ISLANDS
L. HERNÁNDEZ RODRÍGUEZa, D. AFONSO MORALESb, E.M. RODRÍGUEZ-RODRÍGUEZa
and C. DÍAZ ROMEROa*
aFood Science and Nutrition Area, Department of Chemical Engineering and Pharmaceutical Technology.
University of La Laguna, Tenerife, Spain
bAgricultural Biodiversity Conservation Center from Tenerife. Excmo. Cabildo Insular de Tenerife, Tenerife. Spain (Received: 4 March 2015; accepted: 4 May 2017)
Proximate composition was determined in 19 wheat cultivars from the Canary Islands in order to establish differences between them and contribute to their characterization. All parameters analysed showed signifi cant differences between cultivars; and also many parameters were affected by the species and subspecies of wheat. Triticum aestivum had higher mean moisture, protein, and fi bre and lower mean starch, sucrose, and amylose concentrations than Triticum turgidum. Low starch content and high fi bre content could be due to the transformation of starch into resistant starch during desiccation process. An important contribution of complex carbohydrates, including fi bre as well as protein and phenolic compounds, was observed for the consumption of wheat.
Keywords: wheat cultivars (Triticum spp.), proximate composition, physicochemical parameters, nutrient intake
Wheat has been widely recognized as a symbol of the Mediterranean diet due to its nutritional relevance for the human diet. This cereal is an important source of proteins although with a relatively low biological value; complex carbohydrates, including dietary fi bre; vitamins and minerals; and bioactive secondary metabolites as phenolic acids. Epidemiological studies suggest that consumption of whole grain and bran may help to prevent cardiovascular diseases, diabetes and certain forms of cancer (SLAVIN et al., 1997).
Modifi cations of the nutritional value can be of interest because of their high consumption in the population. Diets including enriched cereal products are encouraged by nutritionists in Western Europe in order to improve its nutritional contribution. Obviously, the selection of cereal cultivars more rich from nutritional point of view is also a good alternative to improve the nutritional status of the population.
The project “Germobanco Agrícola de la Macaronesia” included in the Interreg III-B European program aims to characterize traditional cultivars to conserve the biodiversity of the agricultural cultivation in the Macaronesic region. Several papers have been published to chemically characterize traditional wheat cultivars (HERNÁNDEZ et al., 2011; HERNÁNDEZ
RODRÍGUEZ et al., 2011). In this paper, we determined proximate composition in different
* To whom correspondence should be addressed.
Phone: 00 34 922316502 ext 6716; e-mail: cdiaz@ull.es
wheat cultivars from Tenerife in order to establish differences between them and contribute to their characterization. Furthermore, this will help to select cultivars with best nutritional characteristics.
1. Materials and methods
1.1. Wheat sampling
A total of 35 accessions corresponding to 19 cultivars belonging to Triticum aestivum (n=27) and Triticum turgidum (n=8) were provided for analysis by the Centro de Conservación de la Biodiversidad Agrícola de Tenerife (CCBAT). The wheat cultivars selected were all the traditional cultivars available in CCBAT, except Vitrón, which is a commercial cultivar. The description of the wheat samples, including mean weight per grain and number of accessions for each cultivar, is shown in Table 1.
All wheat cultivars were experimentally cultivated in the same breeding ground using the same cultivation methods and agronomic conditions on a collaborating farm of the CCBAT (La Laguna). The wheat was sown in December 2004 and the harvest took place in July 2005, when the wheat grains were in the same stage of maturation.
1.2. Analytical methods
The wheat samples (≈100 g) were divided into 5 sub-samples, which were analysed independently, and each sub-sample was homogenized till formation of a fi ne and homogeneous fl our (Ika-Werke, Staufen, Germany).
All these analyses were carried out in duplicate, and the results expressed as dry weight (DW). Moisture (oven drying method), protein (Kjeldahl method, factor of 5.7), fat (Soxhlet method), fi bre (enzymatic-gravimetric method), pH, acidity (titration with NaOH 0.1 N until pH 8.1, results expressed as g citric acid per 100 g), ash (heated at 900 ºC for 24 h), and starch (enzymatic method) contents were measured (AOAC, 2006). Total phenolic contents were determined by spectrophotometry at 750 nm after colorimetric reaction with the Folin–
Ciocalteu reagent (Sigma, St. Louis, MO) (KUJALA et al., 2000). Gallic acid (Sigma, St.
Louis, MO) was used for the external standard calibration curve. Amylose was determined according to the method of HOVENKAMP-HERMELINK and co-workers (1988), and the results were expressed as g amylose per 100 g starch. Sugar determination was performed by HPLC following the method described by RODRÍGUEZ GALDÓN and co-workers (2009).
1.3. Statistics
All statistics were performed by means of the SPSS version 17.0 software for Windows (SPSS Inc. Chicago, IL). Mean values obtained for the variables studied in the different groups were compared by one-way ANOVA (Duncan’s multiple range) assuming signifi cant differences when P<0.05. Correlation analysis was carried out to see relationships between variables.
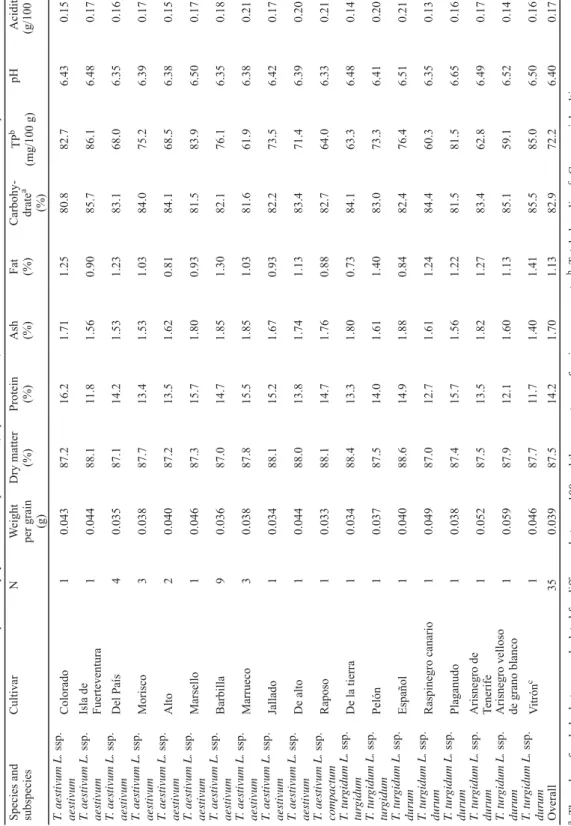
Table 1. Description and physicochemical parameters (expressed in DW) of the cultivars considered and in all wheat samples Species and subspeciesCultivarNWeight per grain (g) Dry matter (%)Protein (%)Ash (%)Fat (%)Carbohy- dratea (%)
TPb (mg/100 g)pHAcidity (g/100 g) T. aestivum L. ssp. aestivumColorado10.04387.216.21.711.2580.882.76.430.15 T. aestivum L. ssp. aestivum Isla de Fuerteventura10.04488.111.81.560.9085.786.16.480.17 T. aestivum L. ssp. aestivum Del País40.03587.114.21.531.2383.168.06.350.16 T. aestivum L. ssp. aestivum Morisco30.03887.713.41.531.0384.075.26.390.17 T. aestivum L. ssp. aestivum Alto20.04087.213.51.620.8184.168.56.380.15 T. aestivum L. ssp. aestivum Marsello10.04687.315.71.800.9381.583.96.500.17 T. aestivum L. ssp. aestivum Barbilla90.03687.014.71.851.3082.176.16.350.18 T. aestivum L. ssp. aestivum Marrueco30.03887.815.51.851.0381.661.96.380.21 T. aestivum L. ssp. aestivum Jallado10.03488.115.21.670.9382.273.56.420.17 T. aestivum L. ssp. aestivum De alto10.04488.013.81.741.1383.471.46.390.20 T. aestivum L. ssp. compactumRaposo10.03388.114.71.760.8882.764.06.330.21 T. turgidum L. ssp. turgidumDe la tierra10.03488.413.31.800.7384.163.36.480.14 T. turgidum L. ssp. turgidumPelón10.03787.514.01.611.4083.073.36.410.20 T. turgidum L. ssp. durumEspañol10.04088.614.91.880.8482.476.46.510.21 T. turgidum L. ssp. durumRaspinegro canario10.04987.012.71.611.2484.460.36.350.13 T. turgidum L. ssp. durumPlaganudo10.03887.415.71.561.2281.581.56.650.16 T. turgidum L. ssp. durumArisnegro de Tenerife10.05287.513.51.821.2783.462.86.490.17 T. turgidum L. ssp. durumArisnegro velloso de grano blanco10.05987.912.11.601.1385.159.16.520.14 T. turgidum L. ssp. durumVitrónc10.04687.711.71.401.4185.585.06.500.16 Overall350.03987.514.21.701.1382.972.26.400.17 a: The value of carbohydrate was calculated for difference between 100 and the percentages of major components; b: Total phenolics; c: Commercial cultivar.
2. Results and discussion
Proximate composition, pH, and acidity obtained for all samples differentiated according to the cultivar are shown in Table 1. There were important (P<0.001) differences between the wheat cultivars. Some differences in the chemical composition of wheat grains compared to the data reported in the literature were observed, which might be associated with the genotype and an environmental effect.
Moisture content was relatively constant in all analysed cultivars (11.4–13.0%). All cultivars considered showed a mean pH inside a narrow interval between 6.33 and 6.65. The lowest acidity was found in Raspinegro Canario cultivar (0.13 g/100 g), in contrast with Marrueco and Español cultivars, which had an acidity of 0.21 g/100 g. Carbohydrates represent the more abundant nutrient in wheat grain, ranging between 80.8% and 85.7% for Colorado and Isla de Fuerteventura cultivars, respectively. The mean protein concentration in all cultivars was 14.2%, which agrees with most of the data published in the literature (SIKA
et al., 1995; RANHOTRA et al., 1996; RANDHAWA et al., 2002; RAGAEE et al., 2006, 2012;
KANDLAKUNTA et al., 2009; DI SILVESTRO et al., 2012; ANDERSSON et al., 2013). Colorado cultivar had the highest protein content (16.2%), in contrast with Vitrón cultivar (11.7%), which presented the lowest protein percentage. All wheat cultivars analysed showed an ash content inside the interval 1.40% and 1.88%, which values were obtained for Vitrón and Español cultivars, respectively. Ash mean content obtained in this paper is in agreement with data reported in the literature (RANDHAWA et al., 2002; SERENA & KNUDSEN, 2007; KANDLAKUNTA
et al., 2009; HAGER et al., 2012; ANDERSSON et al., 2013). The fat concentration varied between 0.73% and 1.41% obtained in De la tierra and Vitrón cultivars, respectively. The fat content found by us was lower than the data published by most authors (SIKA et al., 1995; RANHOTRA
et al., 1996; KANDLAKUNTA et al., 2009; DI SILVESTRO et al., 2012; HAGER et al., 2012;
ANDERSSON et al., 2013), although similar to those reported by RAGAEE and co-workers (2006).
Total phenolic concentrations were fairly constant among the cultivars considered. Isla de Fuerteventura cultivar had the highest value (86.1 mg/100 g) and Arisnegro velloso de grano blanco the lowest concentration (59.1 mg/100 g). Some investigators found higher concentrations than those obtained in this paper (DINELLI et al., 2011; DI SILVESTRO et al., 2012), while other obtained similar amounts of these compounds (RAGAEE et al., 2006;
ANDERSSON et al., 2013).
Table 2 shows results obtained for parameters related to carbohydrates. Sum of all carbohydrates determined was lower than the calculated total carbohydrate (Table 1), which means either the calculation of total carbohydrate was overestimated and/or some carbohydrate components were not adequately quantifi ed. Starch percentage was between 48.8% and 67.4% found in Colorado and Raspinegro Canario cultivars, respectively. The mean concentration of starch (57.0%) was lower than the values obtained by other authors (RAGAEE
et al., 2006; DI SILVESTRO et al., 2012; HAGER et al., 2012; ANDERSSON et al., 2013). Also, high amylose content was observed with a mean value of 37.5% of starch and a range between 34.1% and 44.3% of starch found in Colorado and Español cultivars, respectively. These data are similar to those reported by BLAZEK and COPELAND (2008), but are higher than indicated by HAGER and co-workers (2012). Positive correlations (P<0.001) were observed between starch, amylase, and sucrose contents. Sucrose concentration increased with increasing starch content, which could be due to the fact that sucrose is mostly produced from the hydrolysis products of starch. In contrast, inverse correlations were observed between starch and protein (r= –0.534, P<0.01) and moisture (r= –0.459, P<0.01). These correlations could be explained
by the dilution effect of the starch on the concentrations of water and protein. Dietary fi bre concentration varied between 15.2% obtained in Arisnegro velloso de grano blanco and above 20% in the Jallado, De la tierra, Raposo, and Español cultivars. The content of fi bre was similar to data showed by DI SILVESTRO and co-workers (2012), slightly higher than those reported by RAGAEE and co-workers (2012) and ANDERSSON and co-workers (2013), and considerably higher than other values found in the literature (RANHOTRA et al., 1996;
KANDLAKUNTA et al., 2009). These differences in dietary fi bre could be due to the different composition of non-starchy carbohydrates as well as the formation of resistant starch. It is well known that during the storage of starchy foods resistant starch is produced (RAGAEE et al., 2006; ANDERSSON et al., 2013). There are two relevant factors infl uencing the formation of resistant starch, the temperature applied and the proportion of amylose. Our samples were desiccated at 105 ºC and they contained high amounts of amylose, which favour the formation of resistant starch (ÅKERBERG et al., 1998; LEEMAN et al., 2006; VAN HUNG et al., 2008). Like soluble fi bre, resistant starch is of interest in the maintenance of colonic health (ÅKERBERG et al., 1998). Also, food products rich in resistant starch frequently result in low glycaemic and insulinaemic responses (GRANFELDT et al., 1995). Insulin resistance syndrome is increasingly considered as a potential risk factor for the development of a number of diseases such as obesity, diabetes, and atherosclerosis (ÅKERBERG et al., 1998). So, the consumption of wheat cultivars with trend to produce resistant starch could be of interest in the prevention of these diseases (ÅKERBERG et al., 1998; LEEMAN et al., 2006).
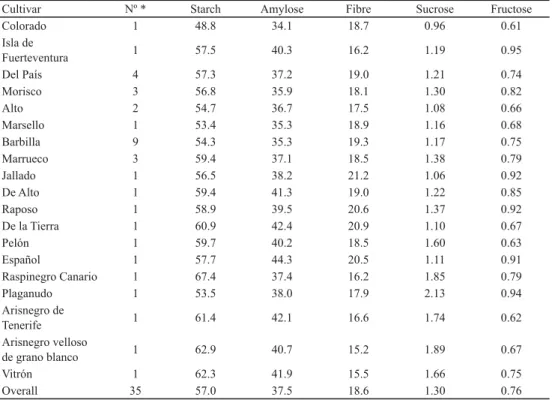
Table 2. Content of carbohydrates (expressed in g/100 g DW) in the cultivars considered and in all wheat samples
Cultivar Nº * Starch Amylose Fibre Sucrose Fructose
Colorado 1 48.8 34.1 18.7 0.96 0.61
Isla de
Fuerteventura 1 57.5 40.3 16.2 1.19 0.95
Del País 4 57.3 37.2 19.0 1.21 0.74
Morisco 3 56.8 35.9 18.1 1.30 0.82
Alto 2 54.7 36.7 17.5 1.08 0.66
Marsello 1 53.4 35.3 18.9 1.16 0.68
Barbilla 9 54.3 35.3 19.3 1.17 0.75
Marrueco 3 59.4 37.1 18.5 1.38 0.79
Jallado 1 56.5 38.2 21.2 1.06 0.92
De Alto 1 59.4 41.3 19.0 1.22 0.85
Raposo 1 58.9 39.5 20.6 1.37 0.92
De la Tierra 1 60.9 42.4 20.9 1.10 0.67
Pelón 1 59.7 40.2 18.5 1.60 0.63
Español 1 57.7 44.3 20.5 1.11 0.91
Raspinegro Canario 1 67.4 37.4 16.2 1.85 0.79
Plaganudo 1 53.5 38.0 17.9 2.13 0.94
Arisnegro de
Tenerife 1 61.4 42.1 16.6 1.74 0.62
Arisnegro velloso
de grano blanco 1 62.9 40.7 15.2 1.89 0.67
Vitrón 1 62.3 41.9 15.5 1.66 0.75
Overall 35 57.0 37.5 18.6 1.30 0.76
*: The analyses were performed in duplicate.
The fructose content detected in all analysed cultivars varied between 0.61 % and 0.95%
for Colorado and Isla de Fuerteventura cultivars, respectively. The sucrose was the predominant sugar in the samples of wheat grain. Plaganudo cultivar had the highest content of sucrose (2.13%), while Colorado cultivar presented the lowest sucrose concentration (0.96%). The sum of sugars is in agreement with other data reported in the literature (SERENA
& KNUDSEN, 2007; ANDERSSON et al., 2013).
The consumption of 100 g of whole-wheat fl our represents 22.3% and 27.1% of the recommended dietary intake (RDA) of proteins for male (56 g/day) and female (46 g/day) adults, respectively. Wheat grains are very good sources of complex carbohydrates; so, the consumption of 100 g of wheat represents a 38% of the RDA (130 g/day) for total digestible carbohydrates. The fi bre intake for the 100 g of wheat accounts for 64.8% and 42.6% of the RDA intake (FOODAND NUTRITION BOARD, 2005) for female and male adults, respectively, while the fat intake is very low. There is no recommended dietary intake for phenolic compounds. However, the American Cancer Society (KREBS-SMITH et al., 1995) has established 100 mg/day of fl avonoids as an adequate amount for the prevention of cancer and other degenerative illnesses. The consumption of 100 g of the wheat cultivars studied represents a 63.1% of the adequate intake for total phenolic compounds.
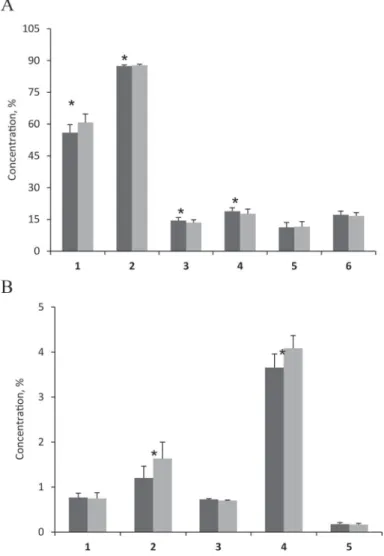
Many signifi cant differences were found in the mean concentrations and physicochemical parameters between the two species of wheat considered (Fig. 1A and B). The samples of T.
aestivum species had higher (P<0.05) mean moisture, protein, and fi bre and lower (P<0.05) mean starch, sucrose, and amylose concentrations than those samples belonging to T.
turgidum. Also, mean total phenolic compounds, ash, fructose contents and acidity (with a lower pH mean value) were higher in the samples belonging to T. aestivum, although without signifi cant differences (P>0.05). Mean concentrations of the physicochemical parameters analysed were determined in the two subspecies included in T. aestivum (spp. vulgare and spp. compactum) and in T. turgidum (spp. durum and spp. turgidum), respectively (data no shown). The spp. compactum belonging to T. aestivum showed higher (P<0.05) mean fi bre and amylose concentrations and acidity and lower (P<0.05) mean moisture and fat concentrations than the spp. vulgare. Similar physicochemical characteristics were observed in both subspecies of T. turgidum. Only the mean fi bre content of the spp. turgidum was higher than the mean content in the spp. durum.
3. Conclusions
Considerable differences in the proximate composition, pH, and acidity were observed between the cultivars, species, and subspecies of wheat analysed. This is useful for selecting cultivars with best nutritional characteristics. The low contents of starch and high contents of fi bre suggest the transformation of starch into resistant starch during the storage and desiccation processes. The high proportion of amylose in starch could promote this transformation. An important contribution of complex carbohydrates including fi bre, protein, and phenolic compounds was observed by the consumption of these wheat cultivars.
*
This work was fi nanced by a research contract in the European Project Interreg III B “Germobanco Agrícola de la Macaronesia”. We also gratefully acknowledge the help of Patrick Dennis for revising and checking the English in this paper.
Fig. 1. Comparison of the physicochemical parameters according to the species. Signifi cant differences (P<0.05) between mean concentrations are indicated by *.
: T. aestivum; : T. turgidum;
(A) 1: starch; 2: dry matter; 3: protein; 4: fi bre; 5: fat×10; 6: ash×10 (B) 1: fructose; 2: sucrose; 3: total phenolics×10; 4: amylose/10; 5: acidity
References
ÅKERBERG, A., LILJEBERG, H. & BJÖRCK, I. (1998): Effects of amylose/amylopectin ratio and baking conditions on resistant starch formation and glycaemic indices. J. Cereal Sci., 28, 71–80.
ANDERSSON, A.A.M., ANDERSSON, R., PIIRONEN, V., LAMPI, A.M., NYSTRÖM, L., BOROS, D., FRAŚ, A., GEBRUERS, K., COURTIN, C.M., DELCOUR, J.A., RAKSZEGI, M., BEDO, Z., WARD, J.L., SHEWRY, P.R. & ÅMAN, P. (2013): Contents of dietary fi bre components and their relation to associated bioactive components in whole grain wheat samples from the HEALTHGRAIN diversity screen. Food Chem., 136, 1243–1248.
AOAC (2006): Offi cial methods of analysis of AOAC International. HORWITZ, W. & LATIMER, G.W. JR. (Eds), 18th ed., AOAC International, Gaithersburg, Md. Methods: protein (920.87), fat (945.16), fi bre (985.29), pH (943.02), acidity (942.15), ash (923.03), starch (996.12), moisture (925.10)
BLAZEK, J. & COPELAND, L. (2008): Pasting and swelling properties of wheat fl our and starch in relation to amylase content. Carbohyd. Polym., 71, 380–387.
DI SILVESTRO, R., MAROTTI, I., BOSI, S., BREGOLA, V., CARRETERO, A.S., SEDEJ, I., MANDIC, A., SAKAC, M., BENEDETTELLI, S. & DINELLI, G. (2012): Health-promoting phytochemicals of Italian common wheat varieties grown under low-input agricultural management. J. Sci. Food Agr., 92, 2800–2810.
DINELLI, G., SEGURA-CARRETERO, A., DI SILVESTRO, R., MAROTTIA, I., ARRÁEZ-ROMÁN, D., BENEDETTELLI, S., GHISELLI, L. & FERNADEZ-GUTIERREZ, A. (2011): Profi les of phenolic compounds in modern and old common wheat varieties determined by liquid chromatography coupled with time-of-fl ight mass spectrometry. J. Chromatogr.
A, 1218, 7670–7681.
FOOD AND NUTRITION BOARD (2005): Dietary reference intakes for energy, carbohydrate, fi ber, fat, fatty acids, cholesterol, protein, and amino acids. The National Academies Press, http://www.nap.edu/ (last accessed: 6 February 2013).
GRANFELDT, Y., DREWS, A. & BJÖRCK, I. (1995): Arepas made from high amylose corn fl our produce favourably low glucose and insulin responses in healthy humans. J. Nutr., 125, 459–465.
HAGER, A.S., WOLTER, A., JACOB, F., ZANNINI, E. & ARENDT, E.K. (2012): Nutritional properties and ultra-structure of commercial gluten free fl ours from different botanical sources compared to wheat fl ours. J. Cereal Sci., 56, 239–247.
HERNÁNDEZ, L., AFONSO, D., RODRÍGUEZ, E.M. & DÍAZ, C. (2011): Phenolic compounds in wheat grain cultivars. Plant Food. Hum. Nutr., 66, 408–415.
HERNÁNDEZ RODRÍGUEZ, L., AFONSO MORALES, D., RODRÍGUEZ RODRÍGUEZ, E. & DÍAZ ROMERO, C. (2011): Minerals and trace elements in a collection of wheat landraces from the Canary Islands. J. Food Compos. Anal., 24, 1081–
1090.
HOVENKAMP-HERMELINK, J.H.M., DE VRIES, J.N., ADAMSE, P. & JACOBSEN, E. (1988): Rapid estimation of amylose/
amilopectin ratio in small amounts of tuber and leaf tissue of potato. Potato Res., 31, 241–246.
KANDLAKUNTA, B., PUNNA, R., PARACHURI, U., SANGRAS, B., KRISHNASWAMY, K., QADRI, S., PUTCHA, U. & BOINDALA, S.
(2009): Nutritional and toxicological evaluation of wheat grown on soils with or without fl y ash treatment. J.
Sci. Food Agr., 89, 384–389.
KREBS-SMITH, S.M., COOK, A., SUBAR, A.F., CLEVELAND, L. & FRIDAY, J. (1995): Assessing fruit and vegetable intakes:
toward the year 2000. Am. J. Public Health, 85, 1623–1629.
KUJALA, T.S., LOPONEN, J.M., KLIKA, K. & PIHLAJA, K. (2000): Phenolic and betacyanins in red beetroot (Beta vulgaris) root: Distribution and effect of cold storage on the content of total phenolic and three individual compounds. J. Agr. Food Chem., 48, 5338–5342.
LEEMAN, A.M., KARLSSON, M.E., ELIASSON, A.C. & BJÖRCK, I.M.E. (2006): Resistant starch formation in temperature treated potato starches varying in amylose/amylopectin ration. Carbohyd. Polym., 65, 306–313.
RAGAEE, S., ABDEL-AAL, E.M. & NOAMAN, M. (2006): Antioxidant activity and nutrient composition of selected cereals for food use. Food Chem., 98, 32–38.
RAGAEE, S., GUZAR, I., ABDEL-AAL, E.S.M. & SEETHARAMAN, K. (2012): Bioactive components and antioxidant capacity of Ontario hard and soft wheat varieties. Can. J. Plant Sci., 92, 19–30.
RANDHAWA, M.A., ANJUM, F.M. & BUTT, M.S. (2002): Physico-chemical and milling properties of new spring wheats grown in Punjab and Sind for the production of pizza. Int. J. Agric. Biol., 4, 482–484.
RANHOTRA, G.S., GELROTH, J.A., GLASER, K. & LORENZ, K.J. (1996): Nutrient composition of spelt wheat. J. Food Compos. Anal., 9, 81–84.
RODRÍGUEZ GALDÓN, B., TASCÓN RODRÍGUEZ, C., RODRÍGUEZ RODRÍGUEZ, E.M. & DÍAZ ROMERO, C. (2009): Fructans and major compounds in onion cultivars (Allium cepa). J. Food Compos. Anal., 22, 25–32.
SERENA, A. & KNUDSEN, K.E.B. (2007): Chemical and physicochemical characterization of co-products from the vegetable food and agro industries. Anim. Feed Sci. Tech., 139, 109–124.
SIKA, M., TERRAB, A., SWAN, P.B. & HEGARTY, P.V.J. (1995): Composition of selected Moroccan cereals and legumes:
comparison with the FAO table for use in Africa. J. Food Compos. Anal., 8, 62–70.
SLAVIN, J., JACOBS, D. & MARQUART, L. (1997): Whole-grain consumption and chronic disease: Protective mechanisms.
Nutr. Cancer, 27, 14–21.
VAN HUNG, P., MAEDA, T., MISKELLY, D., TSUMORI, R. & MORITA, N. (2008): Physicochemical characteristics and fi ne structure of high-amylose wheat starches isolated from Australian wheat cultivars. Carbohyd. Polym., 71, 656–663.