Functional Genomic Annotation of Genetic Risk Loci in Chronic Kidney Disease
Ph.D. Thesis
Nóra Ledó, M.D.
Doctoral School of Basic Medicine Semmelweis University
Consultants: Katalin Suszták, M.D., Ph.D.
András Tislér, M.D., Ph.D.
Official reviewers: Tamás Szelestei, M.D., Ph.D.
Kálmán Tory, M.D., Ph.D.
Head of the Complex Examination Committee:
Péter Nyirády, M.D., D.Sc.
Members of the Complex Examination Committee:
Ágnes Haris, M.D., Ph.D.
László Wagner, M.D., Ph.D.
Budapest
2017
2
Introduction
Chronic kidney disease (CKD) is defined as abnormalities of kidney structure or function with implications for health, which is present for more than 3 months. Kidney function is mostly measured by the filtration capacity of the kidneys (glomerular filtration rate ‒ GFR), based on the plasma clearance of endogenous creatinine. Based on the estimated glomerular filtration rate (eGFR, calculated by GFR estimating equations), CKD is classified in five stages: stage 1 (eGFR > 90 ml/min/1.73m2), stage 2 (eGFR between 60 and 89 ml/min/1.73m2), stage 3 (eGFR between 30 and 59 ml/min/1.73m2), stage 4 (eGFR between 15 and 29 ml/min/1.73m2) and stage 5 (eGFR < 15 ml/min/1.73m2).
The prevalence of CKD is increasing each year, the global prevalence of CKD of all stages is as high as 13.4% and 10.6% of CKD stages 3-5. The prevalence of CKD of all stages is the highest in Europe, compared to other geographical regions. These data support that CKD has become a global health and financial burden, so there is an increasing need to study CKD development and find new therapeutic ways to slow the progression of the disease or even treat chronic renal insufficiency.
Although there are CKD cases caused by monogenetic diseases, chronic kidney disease is mostly a complex gene environmental disease; several environmental and genetic factors affect its development. Diabetes and hypertension are the two most important causes which lead to chronic renal insufficiency but CKD development clearly has a genetic component. At present, one of the most powerful methods to understand the genetics of a complex trait such as CKD is the genome-wide association study (GWAS).
GWAS examines genetic variants across the human genome to identify associations between variants and phenotypes. GWAS divides the population into two groups of individuals: one group with a particular disease/parameter, e.g. CKD (cases) and another group of otherwise similar people without the parameter (controls). If a variant (single nucleotide polymorphism [SNP]) is more frequent in people with the disease, the SNP is said to be associated with the disease. GWAS is a very important way to reveal genetic variants in the association with CKD, however, further investigations are needed to find the functionally relevant polymorphisms.
Most of the disease-associated SNPs are located in the non-coding region of the genome, therefore their functional role of the disease development is largely unknown.
3
Disease-associated genetic variants can alter binding sites for important transcription factors and influence the expression of nearby genes. Genetic variants can potentially alter steady-state expression of genes, in which case they interfere with basal transcription factor binding or can alter the amplitude of transcript changes after signal-dependent transcription factor binding. Genomic loci which can contribute to the variation of gene expression levels are called expression quantitative trait loci (eQTL). The examination of genetic variations and the transcriptome of the subjects simultaneously can reveal SNPs acting as eQTLs.
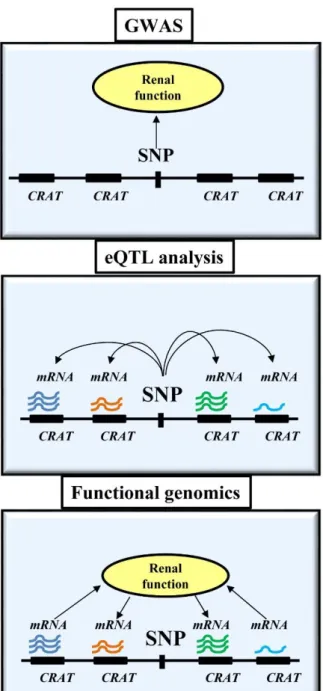
Functional genomics, as a discipline aims to understand the dynamic function of the genome, such as transcription, translation, gene expression regulation, protein-protein interactions, etc. One of the very important goals of this scientific field is to understand and find the function of the non-coding genetic regions where most of the disease- associated polymorphisms are located. Using system biology approaches of functional genomics, the goal of this Ph.D. work was to map the expression of the transcripts near the CKD-risk associated loci in normal and disease human kidney samples to identify potential causal and/or target genes for prioritization. (Figure 1.)
4
Figure 1. Schematic representation of different experimental designs to understand CKD development.
GWASs examine the relationship between genetic variants (SNP) and disease state (CKD). The eQTL analysis examines the relationship between transcript levels and genetic variation in control samples. The relationship between transcript levels around CKD risk variants and kidney function can be studied by functional genomics.
CRAT: CKD risk associated transcripts
5
Objectives
We hypothesized that polymorphisms associated with renal disease will influence the expression of nearby transcript levels in the kidney. In this Ph.D. work, I mapped the expression of these transcripts in normal and disease human kidney samples. I used functional genomics and systems biology approaches to investigate tissue-specific expression of transcripts and their correlation with kidney function.
The goals of the Ph.D. work were:
1. Providing a dataset of potential causal and/or target genes in the vicinity of the CKD risk associated loci
2. Identifying critical pathways associated with kidney function decline for further analysis
6
Methods
Human kidney samples
The human kidney samples were obtained from routine surgical nephrectomies or leftover portions of diagnostic kidney biopsies. Only the normal, non-neoplastic part of the tissue was used for further investigation. Samples were de-identified, and corresponding clinical information was collected by an individual who was not involved in the research protocol. The kidney tissue was manually microdissected for glomerular and tubular compartment under a microscope. Using fine forceps, the glomeruli were removed from the kidney tissue and processed separately. We refer the rest of the kidney tissue as “tubules”. To examine gene expression changes, we extracted RNA (ribonucleic acid) form 95 tubules and 51 glomeruli samples, furthermore, 41 tubule samples were used for external validation. The kidney samples were obtained from a diverse population.
Sample processing and data analysis
Dissected tissue was homogenized, and RNA was prepared using RNAeasy mini columns (Qiagen, Valencia, CA, USA) according to the manufacturer’s instructions. Only samples without evidence of degradation were further used.
The gene expression profile of the samples was analyzed with the help of Affymetrix U133A microarrays and GeneSpring GX software, version 12.6 (Agilent Technologies) and additional quantitative real time polymerase chain reaction (QRT- PCR) was performed for validation and expression quantitative trait loci analysis (eQTL).
For eQTL analysis, we genotyped the samples after DNA extraction and purification with the help of specific TaqMan assay probes. Furthermore, the baseline expression of the transcripts was analyzed by RNA sequencing from healthy kidney tissues (n=2). We performed immunohistochemistry to examine the expression changes on protein level.
Bioinformatics
Gene ontology and network analyses were performed (DAVID Bioinformatics Resources, Ingenuity Network Analysis) and publicly available data sets were analyzed, such as Human Protein Atlas, Illumina Body Map and the eQTL browser of the National Institute of Health.
7 Overview of the used statistical methods
For statistical analysis of the demographic, clinical and histopathological parameters, Pearson product moment correlation or Spearman correlation coefficient (R coefficient) was used to measure the strength of association between age, BMI (body mass index), serum-glucose, blood pressure (systole and diastole), serum-creatinine, BUN (Blood urea nitrogen), serum-albumin, percentage of glomerulosclerosis and interstitial fibrosis and estimated glomerular filtration rate (eGFR); depending on the results of the D'Agostino-Pearson normality tests. The statistical significance of the correlation was calculated with two-tailed test (alpha=0.05). To compare the expression of the genotyped samples in the eQTL-analysis, one-way ANOVA and Student’s t-test were used. The statistical analyses were performed using Prism 6 software (GraphPad, La Jolla, CA, USA).
GeneSpring GX software was used for statistical analysis to process microarray data. Pearson product moment correlation was used to measure the strength of association between gene expression and eGFR. We used Benjamini–Hochberg multiple testing correction with a P value of 0.05.
8
Results
Identifying CKD risk associated transcripts (CRATs)
To identify CKD risk associated transcripts, we performed manual literature search to examine all genome-wide association studies reporting genetic association for CKD-related traits. Our literature analysis identified 10 publications which described SNPs associated with eGFR (on the basis of serum creatinine or cystatin C calculations) or the presence of chronic renal disease. Coding polymorphisms and SNPs that did not reach genome-wide significance (P > 5 x 10⁻⁸) were excluded from our study. Finally, 44 tagging SNPs meeting all of these criteria were used for further analysis. Most publications did not differentiate cases on the basis of disease etiology and included cases with hypertensive and diabetic kidney disease, however, three SNPs associated only with diabetic nephropathy, therefore they were also analyzed separately.
We hypothesized that polymorphisms associated with renal disease will influence the expression of nearby transcript levels in the kidney, by altering transcriptional factor binding. Previous reports indicate that the majority (70%–80%) of the gene regulatory elements (promoters, enhancers, and insulators) are within 250 kb of the gene. Using these criteria, we identified 306 genes within 250 kb (upstream or downstream) of 44 CKD SNPs. There was no gene within the 500-kb window around the rs12437854 SNP;
therefore, 43 loci were examined. We called these transcripts CKD risk associated transcripts (CRATs).
Kidney-specific expression of CRATs
First, we investigated whether these CRATs have kidney-specific expression. We hypothesized that these CRATs play important role in kidney function, therefore they should be expressed in the kidney. We used comprehensive RNA sequencing analysis in normal, healthy kidney tubule samples (n=2) to determine the baseline expression of the 306 CRATs. We found that 41% of the CKD risk loci-associated transcripts showed high, 32% showed medium, 21% showed low expression and only 6% of the transcripts were not detectable in healthy human kidney tubule samples. Overall, we found that a large percentage of the CKD SNP neighboring transcripts (94%; 287 of 306) were expressed in the human kidney. To confirm our results, we used publicly available datasets to
9
examine the kidney-specific expression of CRATs. We performed gene ontology analysis (david.abcc.ncifcrf.gov), which indicated that CRATs have specific and significant enrichment in the kidney and peripheral leukocytes (P=0.0082 and P=0.0014, respectively). Additionally, we compared absolute expression levels of CRATs by RNA sequencing in 16 different human organs using the Illumina Body Map database (www.ebi.ac.uk). The atlas confirmed the statistically significant kidney-specific expression enrichment of CRATs. In summary, expression of CRATs was enriched in the kidney and peripheral lymphocytes, potentially indicating the role of these cells in kidney disease development.
Expression profile of CRATs in normal and disease human kidney samples
According to our hypothesis, the functionally important CRATs are not only expressed in relevant cell types (e.g. kidney tubule cells, leukocytes) but the expression levels of these CRATs should change in CKD. To test this hypothesis, we analyzed gene expression levels in a large collection of microdissected human glomerular (n=51) and tubule (n=95) samples. Transcript profiling was performed for each individual sample using Affymetrix U133v2 microarrays, and they contained probe set identifications for 226 transcripts from the 306 original CRATs.
Linear correlation analysis (Pearson) identified the significant association of 34 CRATs with eGFR (P < 0.05) in glomerular samples. The correlation between the expression of seven CRATs and eGFR remained significant, even after Benjamini–
Hochberg-based multiple testing correction. The expression of multiple novel transcripts showed correlation with kidney function. For example, expression levels of Family with sequence similarity 47, member E (FAM47E), Plexin domain-containing 1 (PLXDC1), Vascular endothelial growth factor A (VEGFA) and Membrane-associated guanylate kinase 2 (MAGI2) correlated with eGFR. Interestingly, FAM47E, PLXDC1, and MAGI2 have not been identified in GWASs as potential causal or target genes in the vicinity of CKD risk loci. In summary, the analysis highlighted that the expression of several CRATs in glomeruli correlates with renal function.
We also performed linear correlation tests between the gene expression arrays and eGFR in tubule samples. Pearson correlation identified 92 transcripts with statistically significant (P < 0.05) linear correlation with kidney function. The correlation between the
10
expression of 70 CRATs and eGFR remained significant, even after Benjamini–
Hochberg-based multiple testing correction. Tubule-specific expression of solute carriers had the strongest correlation with renal function in tubules. For example, the levels of the Solute carrier family 34, member 1 (SLC34A1), which codes a type II sodium/phosphate cotransporter, and SLC7A9 (Solute Carrier Family 7 Member 9), which codes the light chain of an amino acid transporter, correlated strongly with eGFR (with R values of 0.61 and 0.59, respectively). In addition to solute carriers, the expression of a metabolic enzyme, the Acyl-CoA synthetase medium chain family member 5 (ACSM5), also highly correlated with renal function and showed high protein expression in tubule epithelial cells.
For external validation, we used a gene expression dataset containing genome- wide transcription profiling from 41 microdissected tubule samples. The samples in this dataset were different from the primary dataset. Although this dataset was much smaller with a narrower eGFR range, we confirmed the significant linear correlation of 51 transcripts, highlighting the importance of these CRATs.
In summary, the gene expression and kidney function correlation analysis revealed CRATs for future prioritization.
Transcript levels around the “UMOD-locus” and other CKD risk associated loci We specifically investigated expression changes of the UMOD transcript, because it is a potential causal or target gene underlying the polymorphism of some of the best characterized CKD associated loci on chromosome 16 (rs12917707, rs4293393 and rs11864909). This gene encodes one of the most abundant proteins in human urine:
Uromodulin or Tamm–Horsfall protein. We found that UMOD transcript levels showed a highly significant linear correlation with renal function (Pcorr=6.09 x 10⁻⁶) in tubule samples. We also performed immunohistochemistry staining from samples used for the transcriptomic analysis: samples with low UMOD mRNA expression and with high expression. The results of the staining indicate excellent correlation between uromodulin protein expression and its transcript levels.
Although UMOD has emerged as an important causal gene for CKD, unexpectedly, we found that other nearby genes were also highly expressed in renal tubules, and their expression strongly correlated with eGFR. We observed that ACSM5
11
and ACSM2A/B were also highly expressed in human kidney tubule samples. RNA sequencing data from the Illumina Body Map also confirmed the expression levels of these transcripts. By linear correlation analysis, we found highly significant correlation between renal function and UMOD, ACSM5 and ACSM2A/2B transcript levels. We also validated the transcript expression of the genes near the UMOD locus by QRT-PCR to confirm the microarray results. We performed immunohistochemistry staining on samples with high and low ACSM2A/2B transcript expression and found the expression level changes on protein level as well. ACSM5 and ACSM2A/2B genes (ACSM family members) encode three genes in fatty acid oxidation pathways. However, these transcripts showed high expression in the kidney and their expression strongly correlated with renal function, they were not mentioned before in the GWASs as potential causal or target genes. Our results indicate a potential functional role of these transcripts.
We also examined whether in the proximity of a single SNP could be observed changes in expression of a single gene or multiple genes. We found that, on 23 of 43 examined CKD risk loci, multiple neighboring transcripts correlated with renal function indicating that the regulation of these genes could be linked.
Expression quantitative trait loci (eQTL) analysis
Polymorphisms associated with kidney function can also directly control baseline transcript levels in disease-relevant types. Based on the possible cross-tissue similarity in eQTL results, we examined whether CKD risk SNPs influence local transcript levels (in cis; within 1-Mb distance) in multiple different datasets where genotype and gene expression correlation data were available. We found that 4 SNPs from the previously identified 44 leading/tagging SNPs and 16 SNPs in their linkage disequilibrium (r2 ≥ 0.8) acted as cis-eQTLs for 11 different transcripts (P < 0.05). One of the 11 transcripts, CLTB (Clathrin, light chain B) showed significant linear correlation with eGFR in glomerulus samples (P=0.016). Another transcript, CERS2 (ceramide synthase 2) was highly also correlated with eGFR in tubule samples (P=1.2 x 10⁻⁴), making it a potential candidate gene for CKD development.
Although, the main part of our work focuses on the associations between the disease, progression and gene expression, we genotyped kidney samples for rs881858 and rs6420094 SNPs to search for expression changes affected by these loci.
12
Tubule-specific VEGFA transcript levels were lower in patients who were homozygous for the major allele on the rs881858 locus compared to heterozygous or minor allele homozygous samples (P=0.025). However, this association was only true in healthy kidney samples (n=21, eGFR > 85 ml/min/1.73m2). Glomerular or tubule-specific VEGFA transcript and protein expression levels highly correlated with eGFR. These results indicate that the rs881858 polymorphism likely influences VEGFA transcript levels, however, this association cannot be observed in samples with kidney disease, because of the high influence of disease conditions on VEGFA expression. These results indicate that VEGFA could be an important CKD candidate gene.
Additionally, we examined whether genetic polymorphism (rs6420094) on chromosome 5 around SLC34A1 will influence transcript expression. We found that tubule-specific SLC34A1 expression was significantly higher in patients who were homozygous for the major allele on the rs6420094 locus compared with heterozygous or minor allele homozygous samples (n=18, eGFR > 85 ml/min/1.73m2, P=0.0305).
Network analysis of CRATs
Taken together, we identified 104 transcripts of 226 CRATs showing significant correlation with eGFR at 39 out of the 44 loci. We examined whether the 104 renal function-correlating CRATs (either in tubule or glomerular samples) in the neighborhood of 39 CKD risk loci show relatedness and can form a network. The network analysis was performed separately on genes that showed positive or negative correlation with kidney function.
Genes showing negative correlation with kidney function (higher expression in CKD) clustered at the TNF (tumor necrosis factor), TGF-β1 (transforming growth factor beta) and NF-κB/RELA (nuclear factor kappa B with p65 subunit) regulatory nodes. Most members of this cluster are known to play a role in immune function and regulation of inflammation. The second cluster (transcripts with expression that positively correlated with kidney function) centered at VEGFA and ERBB2 (Erb-B2 Receptor Tyrosine Kinase 2) molecules. These molecules play important roles in maintaining epithelial and endothelial functions. In summary, network analysis highlighted the relatedness of the regulated genes and the potential role of epithelial cell biology and inflammation in CKD.
13
Transcript levels around loci associated with diabetic nephropathy
We also specifically examined the correlation of the diabetic CKD-associated polymorphisms (rs12437854, rs7583877 and rs1617640) and transcript changes in glomerular and tubule samples only with normal renal function and diabetic kidney disease. After excluding the samples with hypertensive CKD, the analysis was performed on 42 glomerular and 76 tubule samples. The analysis highlighted that the expression of Procollagen C-endopeptidase enhancer (PCOLCE) in glomerular samples and the expression of Thyroid hormone receptor interactor 6 (TRIP6) in tubule samples in the vicinity of diabetic CKD SNPs correlate with kidney function.
Furthermore, genes in the vicinity of rs1326934 locus were examined. In a multi- stage based GWAS, our group found associations between this locus and diabetic nephropathy in patients with type 1 diabetes (Publication II.). However, none of the examined SNPs reached genome-wide significance in the discovery cohort, additional analysis drew the attention to this locus, which is in the vicinity of the SORBS1 gene (Sorbin and SH3 Domain Containing 1).
We examined the expression of the SORBS1 gene in normal, non-diabetic samples and in samples with diabetic kidney disease (17 glomerular and 39 tubule samples). First, we performed binary analysis comparing cases versus controls, and found significantly higher expression of SORBS1 in tubule samples of diabetic nephropathy (P=6 x 10⁻⁴).
Additional linear correlation analysis revealed a significant inverse correlation between SORBS1 expression values and eGFR in tubule samples (R=−0.493; P=1.44 x 10⁻³). We also examined the expression and correlation with eGFR of other nearby genes in the vicinity of rs1326934, where not only SORBS1 but other genes also correlated with eGFR.
14
Conclusions
Understanding complex trait development, such as chronic kidney disease, is a formidable challenge. As discussed above, CKD is a gene environmental disease with several genetic and environmental effects on its development. The first step to understand the development of CKD is to interpret the genetic architecture of the disease.
Recent GWASs have identified several SNPs associated with chronic kidney disease, however the functional role of these loci has not revealed yet.
In this Ph.D. work:
• We identified 306 CKD-risk associated transcripts (CRATs) in the vicinity of 44 CKD-risk associated loci.
• We examined the expression of these CRATs in a large set of human normal and diseased kidney samples and described the gene expression correlation with kidney function.
• We could highlight genes for further prioritization for 39 of 44 loci (89%).
• Using UMOD, ACSM2A, and VEGFA genes as examples, we showed that these expression changes likely correlate with protein levels.
• Our results also suggest that not only the closest gene but also, several genes in the close vicinity correlate highly with renal function, indicating their potential importance and their potential co-regulation.
• Network analysis of eGFR-correlating CRATs highlighted two major clusters; a positive correlation with epithelial and vascular functions and an inverse correlation with inflammatory gene cluster.
In summary, we performed a comprehensive functional genomic analysis of CKD-associated GWAS hits. These results highlight multiple new CKD risk associated candidate genes, that were not originally considered by GWAS experiments. Future molecular and cell biology experiments will be needed to understand the functional role of these CRATs. Our findings can direct the renal community toward identification of genes and pathways that may serve as disease biomarkers or causal pathways.
15
Bibliography of the candidate’s publications The list of publications related to the PhD thesis:
I. Ledo N, Ko YA, Park ASD, Kang HM, Han SY, Choi P and Susztak K (2015) Functional genomic annotation of genetic risk loci highlights inflammation and epithelial biology networks in chronic kidney disease. J Am Soc Nephrol, 26(3):692-714.
II. Germain M, Pezzolesi MG, Sandholm N, McKnight AJ, Susztak K, Lajer M, Forsblom C, Marre M, Parving HH, Rossing P, Toppila I, Skupien J, Roussel R, Ko YA, Ledo N, Folkersen L, Civelek M, Maxwell AP, Tregouet DA, Groop PH, Tarnow L and Hadjadj S (2015) SORBS1 gene, a new candidate for diabetic nephropathy: results from a multi- stage genome-wide association study in patients with type 1 diabetes. Diabetologia, 58(3):543-8.
Other publications of the candidate:
1. Ko YA, Yi H, Qiu C, Huang S, Park J, Ledo N, Köttgen A, Li H, Rader DJ, Pack MA, Brown CD, Susztak K (2017) Genetic-variation-driven gene-expression changes highlight genes with important functions for kidney disease. Am J Hum Genet, 100(6):940-953
2. Ledó N, Horváth VJ, Tislér A (2017) A volumenstátusz meghatározásának jelentősége és lehetőségei a szív- és vesebeteg populációban Hypertonia és Nephrologia, 21(1)
3. Ledo N, Susztak K, Palmer MB (2016) Cell Phenotype Transitions in Renal Fibrosis.
Curr Pathobiol Rep, 4:19
4.Murber A, Fancsovits P, Ledo N, Szakacs M, Rigo J Jr, Urbancsek J (2011) Impact of highly purified versus recombinant follicle stimulating hormone on oocyte quality and embryo development in intracytoplasmic sperm injection cycles. Acta Biol Hung, 62(3):
255-64.
16
5. Pongor E, Ledo N, Altdorfer K, Lengyel G, Feher E (2010) Distribution and possible origin of neuropeptide-containing nerve elements in the mammalian liver. Acta Vet Hung, 58(2):177-87
6. Murber Á, Ledó N, Fancsovits P, Tóthné Gilán Zs, Rigó J jr, Urbancsek J (2010) In vitro fertilizáció (IVF) kezelések során alkalmazott stimulációs protokollok hatása a petesejt- és embrióminőségre, valamint a korai embriófejlődésre Magyar Nőorvosok Lapja, 73(1):23-29.
7. Murber A, Fancsovits P, Ledo N, Gilan ZT, Rigo J Jr, Urbancsek J (2009) Impact of GnRH analogues on oocyte/embryo quality and embryo development in in vitro fertilization/intracytoplasmic sperm injection cycles: a case control study. Reprod Biol Endocrinol, 7:103