Research: Health Economics
Cost-effectiveness of population-based, community,
workplace and individual policies for diabetes prevention in the UK
P. R. Breeze
1, C. Thomas
1, H. Squires
1, A. Brennan
1, C. Greaves
2, P. Diggle
3,4, E. Brunner
5, A. Tabak
5,6, L. Preston
1and J. Chilcott
11School of Health and Related Research, University of Sheffield, Sheffield,2University of Exeter Medical School, University of Exeter, Exeter,3Medical School, Lancaster University, Lancaster,4Institute of Infection and Global Health, University of Liverpool, Liverpool,5Epidemiology and Public Health, University College London, London, UK and6First Department of Medicine, Semmelweis University Faculty of Medicine, Budapest, Hungary
Accepted 6 March 2017
Abstract
Aim To analyse the cost-effectiveness of different interventions for Type 2 diabetes prevention within a common framework.
Methods A micro-simulation model was developed to evaluate the cost-effectiveness of a range of diabetes prevention interventions including: (1) soft drinks taxation; (2) retail policy in socially deprived areas; (3) workplace intervention;
(4) community-based intervention; and (5) screening and intensive lifestyle intervention in individuals with high diabetes risk. Within the model, individuals follow metabolic trajectories (for BMI, cholesterol, systolic blood pressure and glycaemia); individuals may develop diabetes, and some may exhibit complications of diabetes and related disorders, including cardiovascular disease, and eventually die. Lifetime healthcare costs, employment costs and quality-adjusted life-years are collected for each person.
Results All interventions generate more life-years and lifetime quality-adjusted life-years and reduce healthcare spending compared with doing nothing. Screening and intensive lifestyle intervention generates greatest lifetime net benefit (£37) but is costly to implement. In comparison, soft drinks taxation or retail policy generate lower net benefit (£11 and£11) but are cost-saving in a shorter time period, preferentially benefit individuals from deprived backgrounds and reduce employer costs.
Conclusion The model enables a wide range of diabetes prevention interventions to be evaluated according to cost- effectiveness, employment and equity impacts over the short and long term, allowing decision-makers to prioritize policies that maximize the expected benefits, as well as fulfilling other policy targets, such as addressing social inequalities.
Diabet. Med. 34, 1136–1144 (2017)
Introduction
Over 35% of adults in England are thought to be at high risk of developing type 2 diabetes because of impaired glucose regulation [1], defined by the American Diabetes Association as HbA1c concentrations of 39–46 mmol/mol (5.7–6.4%). There is now a wealth of evidence that diabetes prevention through lifestyle change for people with impaired glucose regulation is effective [2] and cost-effective [3], and current National Institute for Health and Care
Excellence (NICE) guidelines recommend that individuals at high risk of diabetes [fasting plasma glucose levels 5.5– 6.9 mmol/L or HbA1c 42–46 mmol/mol (6.0–6.4%)] are offered an intensive programme of lifestyle change [4]. In the UK, a National Diabetes Prevention Programme is being implemented; however, interventions targeting the obeso- genic environment may be more cost-effective, given that the risk factors overlap with other non-communicable diseases and many people benefit from improvements in diet and lifestyle.
A review identified several diabetes models that have investigated the cost-effectiveness of diabetes prevention and policies, including intensive lifestyle intervention for individuals at high risk of diabetes, weight loss interventions
Correspondence to: Penny Breeze. E-mail: p.breeze@sheffield.ac.uk.
This is an open access article under the terms of the Creative Commons Attrib ution License, which permits use, distribution and reproduction in any medium, provided the original work is properly cited.
DOI: 10.1111/dme.13349
for obese/overweight individuals and lifestyle promotion through fiscal or media campaigns [5]; however, because of differences in model structure it is not possible to compare interventions across studies and no study has directly com- pared the cost-effectiveness of intensive lifestyle intervention for individuals at high risk of diabetes within broader weight loss policies in a single modelling framework or estimated how outcomes are distributed across socio-economic groups.
The aims of the present study were to evaluate the economic benefits of a range of intervention types within a common modelling framework to help prioritize campaigns according to cost-effectiveness and equity considerations, as well as to report the short-term cost impact, distribution of outcomes across socio-economic groups, and implications for work productivity.
Methods
Model
The analysis was designed to evaluate lifetime costs and health outcomes of diabetes prevention policies in England.
The model was developed using a novel conceptual mod- elling framework [6], based on literature reviews and in consultation with a stakeholders group of diabetes clinicians, researchers and public health commissioners. The stake- holder group of lay members, clinicians, researchers and public health commissioners met three times to agree the conceptual model, model structure, data inputs and policy interventions. The model was an individual level simulation, written using R software, which allows individual partici- pants to be recruited into interventions conditional on their characteristics. Baseline individual characteristics were obtained from the Health Survey for England 2011, which is a representative sample of the population in England [7].
Individuals with diabetes and those aged <16 years were excluded from analysis. Individuals were sampled at random with replacement from this dataset to populate the model in which 5 000 000 individuals were simulated. In the model, each individual follows trajectories for HbA1c, BMI, systolic blood pressure and cholesterol derived from the Whitehall II cohort [8]. In yearly cycles, people visit their general practitioner and may be diagnosed with diabetes, hyperten- sion or dyslipidaemia and treated accordingly. The model simulates a number of health outcomes that are related to BMI and diabetes. Each year, individuals are at risk of developing cardiovascular disease (QRISK2 [9]), heart failure (Framingham study [10]), microvascular complications of diabetes (UK Prospective Diabetes Study [11]), breast or colon cancer [12,13], osteoarthritis [14], depression [15], or they may die. A detailed description of the model methods, assumptions, variables and validation tests can be found in the Supporting Information, supplementary methods.
Healthcare costs and quality of life
Healthcare costs were assigned to the health states in the model to estimate costs from a National Health Service (NHS) and Personal Social Services (PSS) perspective in 2014–2015 UK pounds. It was not feasible to accurately capture all impacts of these interventions from a societal perspective without making substantial assumptions and approximations that would render the final estimate irrelevant. We favour reporting the net benefit from an NHS/PSS perspective, with supplementary information on workplace productivity, to target the analysis at public health and healthcare profession- als interested in diabetes prevention. EQ-5D health question- naire scores were extracted from the Health Survey for England dataset to describe an individual’s baseline health- related quality of life, and utility decrements were applied in each year of a person’s life according to age and health status.
Work productivity and employer costs
The model was designed to estimate work absence, condi- tional on health status in employed individuals. The cost to the employer was calculated based on the number of days absent from work. Productivity losses were estimated using the friction cost method, which assumes that there was sufficient unemployment to replace workers on sick leave after a friction period. The employer incurred a recruitment cost of a replacement worker if an individual died whilst employed.
Interventions
A series of interventions were selected for inclusion in the model (see Supporting Information, supplementary methods for more details). Details of the target population, uptake, effectiveness and costs of the interventions are reported in Table 1.
What’s new?
• A novel model was developed to help policy-makers decide which diabetes prevention interventions to pur- sue, balancing cost-effectiveness against other objectives, such as equity, employment and short-term return.
• Most interventions examined were cost-saving over a lifetime compared with doing nothing.
• Individual-based intervention in high-risk individuals is likely to be the most cost-effective option in the long run, whilst population- and community-based interven- tions are more equitable, reduce employer costs and are cost-saving over shorter timescales.
• The model can easily be adapted to evaluate new interventions as they are trialled, and help design local and national diabetes and obesity prevention pro- grammes.
Table1Assumptionsmadetoevaluatetheeffectivenessofinterventions SoftdrinkstaxRetailpolicyWorkplaceCommunityHigh-riskindividuals Briefdescription20%taxon sugar-sweetenedsoftdrinksNew supermarketin adeprivedurbanarea Healthyeating promotionin workplacecanteen Men-onlyweightloss programmeandcooking skillsprogramme
Individualsattending vascularcheckswith aLeicesterrisk score>4.75HbA1c screeningdiabetes (HbA1c>6.5%)and IGR(HbA1c>6%) individualswithIGR offeredlifestyle interventionprogramme Totalcostper persontargetedNoneNone£4.99£173(weight-loss) £82(Cooking)HbA1cscreening£14 LifestyleIntervention£280 PopulationAllindividualsIMDlowestquintile20%ofemployedpopulationIMDlowestquintile andmenBMI>30kg/m2Screen-detectedIGR Uptake100%100%11.9%fruit 8.9%milk11.4%43.7%vascularchecks 32%educationuptake 1-yearchange inBMI,kg/m2Age16-290.23(0.28,0.20)NoneNoneWeightloss1.29(1.796,0.784) Cooking1.04(1.448,0.632)0.94(1.265,0.655) Age30-490.05(0.07,0.03) Age≥500.00(0.01,0.03) 1-yearchange inHbA1c(%)None0.010(0.014,0.006)Fruit0.063(0.088,0.034%) Milk0.0156(0.022,0.009)Weightloss0.009(0.013,0.005) Cooking0.009(0.013,0.005)0.121(0.215,0.045) 1-yearchange insystolic bloodpressure, mmHg
None0.46Fruit2.86(3.75,1.67)Weightloss0.409(0.536,0.238) Cooking0.409(0.536,0.238)4.30(6.11,2.49) 1-yearchange intotal cholesterol,mmol/l
NoneNoneNoneNone0.098(0.235,0.125) Basecaseduration ofeffect5years5years5years5years5years IGR,impairedglucoseregulation;IMD,indexofmultipledeprivation.
Sugar-sweetened soft drinks
The effect of a 20% soft drinks tax on mean BMI was estimated previously [16]. The age-dependent effect was applied to the general population. No costs were associated with the soft drinks taxation scheme, nor was revenue included in the NHS and PSS perspective.
Retail provision of fruit and vegetables
A supermarket opening was studied to observe the impact of retail provision on local fruit and vegetable consumption [17]. Fruit and vegetable consumption increased by 0.162 portions per day after the store opened. The change in fruit and vegetable consumption was related directly to changes in HbA1cand systolic blood pressure. Individuals in the highest index of multiple deprivation (IMD) quintile (low socio- economic status) received the intervention. The costs were assumed to be incurred by the private sector.
Worksite healthy eating promotion
The Heartbeat Award scheme implemented healthy food options in cafeterias in the workplace and observed the impact on workers’ dietary patterns [18]. The study reported the proportion of individuals who made a positive switch to healthier food options compared with non-participating workplaces. The benefits of the workplace intervention were described by the increase in fruit consumption and the switching of milk from a high- to a low-fat choice, and were assumed to affect 20% of the working population.
Deprived community education programmes
Two community education programmes were identified to describe the effectiveness of targeted education interventions in deprived communities. Firstly, community nurses in a deprived area of Scotland developed a group-based weight management intervention specifically for obese men [19].
Secondly, a Mediterranean diet class was run for socially deprived women [20]. Both studies reported mean change in BMI and change in fruit and vegetable consumption. These interventions were combined such that, within the same scenario, women in the highest IMD quintile were offered a cooking class, whilst men with a BMI>30 kg/m2and in the highest IMD quintile were offered the diet programme.
Translational diabetes prevention programme
An individual’s risk of diabetes was assessed using the Leicester Risk Score [21] whilst he or she attended for vascular checks [22], and the individual was invited for diabetes screening if the score was>4.75. An NHS vascular checks attendance rate of 43.7% was assumed in line with a review of NHS health checks [23] and an intervention uptake rate of 32% based on estimates from Public Health England [24]. Individuals who attended screening with HbA1c
≥47.5 mmol/mol (6.5%) were diagnosed with diabetes.
Individuals with HbA1c≥42.5 mmol/mol (6.0%), and not
diagnosed with diabetes were offered the lifestyle pro- gramme. A meta-analysis of translational diabetes prevention programmes was used to estimate the change in BMI, HbA1c, systolic blood pressure and cholesterol at 12 months after a lifestyle intervention [22]. It was assumed that individuals received 6-monthly maintenance classes for 3 years after the first year’s programme.
Maintenance of intervention effectiveness
Data were not available for the maintenance of metabolic changes for each intervention. The effectiveness decreased linearly after the first year, reaching zero effect after 5 years, in line with observations from studies of dietary counselling for weight loss [25].
Outcomes of the model
The results describe the benefits of the interventions com- pared with a do-nothing strategy. Health benefits were measured in quality-adjusted life years (QALYs). The ben- efits of the interventions were also described in natural units such as health events. Costs and QALYs were discounted at 1.5% per year. Incremental net benefit was estimated from the NHS/PSS perspective to describe the overall monetary benefit of the interventions in a single unit by assuming a willingness to pay (k) of£20,000 per QALY.
Incremental net benefit¼kðincremental QALYÞ ðincremental costÞ
Cost-effectiveness analysis included a lifetime perspective, in line with NICE guidelines [26]. In addition, net benefit over 5 and 10 years was obtained to describe short-term cost-effectiveness. The results were disaggregated by depri- vation quintiles to enable consideration of the distribution of benefits across socio-economic groups. Differences in the effectiveness of the interventions did not vary across depri- vation quintiles; however, the characteristics and potential to benefit from the interventions is variable. Days absent from work and employer costs are reported separately from the cost-effectiveness analysis to preserve the NHS/PSS perspec- tive.
One-way sensitivity analysis was conducted to examine the impact of the intervention assumptions and model variables on the incremental net benefit outcomes. A probabilistic sensitivity analysis was conducted to describe the uncertainty in the model outcomes, for which appropriate statistical distributions were assigned to all uncertain model parameters (Supplementary methods).
Results
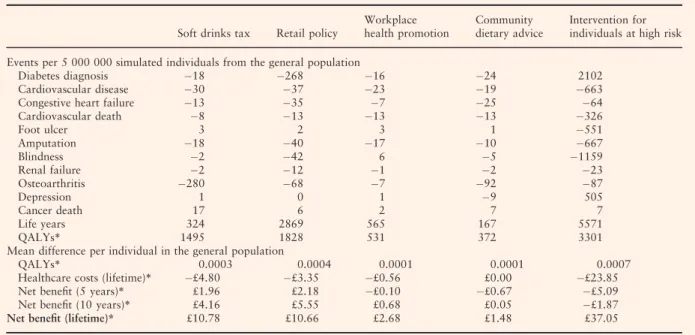
Table 2 shows the lifetime incremental differences between the five interventions and doing nothing in health units and cost-effectiveness outcomes. The retail policy, workplace
intervention and community interventions reduce the num- ber of diabetes diagnoses. The screening and intensive lifestyle intervention for individuals at high risk of diabetes increases the number of diabetes diagnoses over a lifetime by 2102 cases per 5 000 000 in the general population. This is because the screening strategy increases life expectancy and substantially improves identification of diabetes cases that would otherwise remain undiagnosed but are still associated with a high risk of diabetes-related complications and death.
All interventions decrease the incidence of cardiovascular disease, congestive heart disease and cardiovascular death over the lifetime perspective (Table 2). The screening and intensive lifestyle intervention substantially reduces the incidence of microvascular disease and increases the inci- dence of depression [27]. In some cases, other interventions slightly increase the incidence of foot ulcer, amputation and cancer-specific death because of the increase in life expectancy.
All interventions generate more life-years and lifetime QALYs compared with a do-nothing scenario (Table 2). All interventions, except community dietary advice, reduce healthcare spending. The incremental net benefit is a statistic that describes the overall value of each intervention per person in the general population, and is calculated from the costs saved and health benefits valued at£20,000 per QALY.
The screening and intensive lifestyle intervention in individ- uals with a high risk of diabetes generates the greatest incremental net benefit (£37), with a soft drinks taxation coming second in our analysis (£11). The screening and
lifestyle intervention has a negative net benefit at 5 and 10 years because it takes longer to re-coup the costs of the intervention. The retail intervention and soft drinks tax, which incur no costs to the health provider, generate the greatest 5-year, and 10-year incremental net benefit. An incremental analysis in Table S1 comparing all intervention strategies found that the screening and intensive lifestyle intervention dominates all other options over a lifetime.
Figure 1 summarizes the distribution of lifetime QALYs and costs across the five quintiles of deprivation. The retail policy and community interventions generate benefits only in the lowest quintile because these interventions are targeted at the most deprived groups by design. The workplace inter- vention and intensive lifestyle intervention in individuals at high risk of diabetes have an even spread of benefits across quintiles, whereas the soft drinks taxation offers increased benefits to the most deprived. The interventions do not assume differential effects between socio-economic groups, therefore, the results are attributable to differences in baseline characteristics and underlying risks of disease progression inherent in the individuals targeted by the interventions. For example, the low socio-economic group tends to be younger and more likely to be affected by the soft drinks tax.
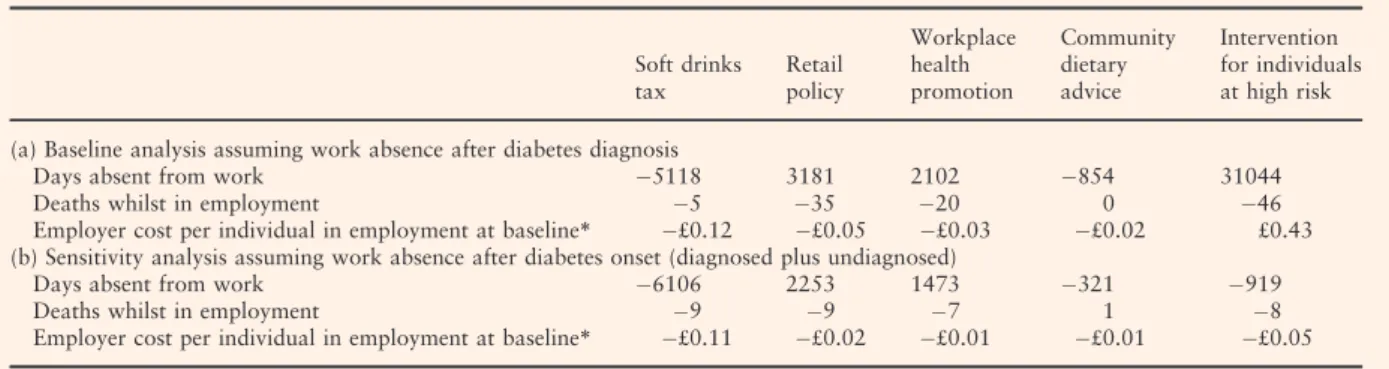
The wider social impacts of these interventions were considered by looking at the effects on employment (Table 3). The retail, community and intensive lifestyle interventions increase the number of days of work absence over a lifetime compared with doing nothing. The overall Table 2Incremental health and cost outcomes of interventions compared with ‘do nothing’ per 5 000 000 simulated individuals in the general population
Soft drinks tax Retail policy
Workplace health promotion
Community dietary advice
Intervention for individuals at high risk Events per 5 000 000 simulated individuals from the general population
Diabetes diagnosis 18 268 16 24 2102
Cardiovascular disease 30 37 23 19 663
Congestive heart failure 13 35 7 25 64
Cardiovascular death 8 13 13 13 326
Foot ulcer 3 2 3 1 551
Amputation 18 40 17 10 667
Blindness 2 42 6 5 1159
Renal failure 2 12 1 2 23
Osteoarthritis 280 68 7 92 87
Depression 1 0 1 9 505
Cancer death 17 6 2 7 7
Life years 324 2869 565 167 5571
QALYs* 1495 1828 531 372 3301
Mean difference per individual in the general population
QALYs* 0.0003 0.0004 0.0001 0.0001 0.0007
Healthcare costs (lifetime)* £4.80 £3.35 £0.56 £0.00 £23.85
Net benefit (5 years)* £1.96 £2.18 £0.10 £0.67 £5.09
Net benefit (10 years)* £4.16 £5.55 £0.68 £0.05 £1.87
Net benefit (lifetime)* £10.78 £10.66 £2.68 £1.48 £37.05
QALY, quality-adjusted life-year.
*Discounted at 1.5%.
QALYs valued at£20,000 per QALY for net benefit calculations.
impact on the employer costs per individual in employment (56.3% of population) suggests that the soft drinks tax, retail policy, workplace intervention and community interventions generate cost savings for the employer (ranging from£0.01 to
£0.12 per individual in employment); however, the screening and intensive lifestyle intervention for individuals at high risk of diabetes is more costly to employers than doing nothing (£0.43 per individual in employment). This counterintuitive result arises because of the increase in the number of individuals with diabetes and, as a consequence, an increase in depression [27], both associated with a high level of work absence; however, to explore uncertainty about this assump- tion, a sensitivity analysis was performed in which depres- sion and work absence were associated with the onset of diabetes, rather than diagnosis; in this case, the intensive lifestyle intervention saves money for employers (£0.05 per individual in employment).
Table S4 describes the results of the other one-way sensitivity analyses. These suggest that the results are very sensitive to the rate of weight regain assumed in the model.
The education interventions for deprived communities and individuals at high risk of diabetes are also very sensitive to the assumed uptake rates of these interventions. This highlights the importance of recruitment and retention of individuals in education programmes. A sensitivity analysis for HbA1ctesting without lifestyle intervention for individ- uals at high risk results in a net benefit of approximately£25 per person, suggesting that a policy identifying individuals with undiagnosed diabetes alone is also highly cost-effective.
Outcomes for all interventions were sensitive to the discount rate used, but most results were fairly insensitive to non- intervention model variables. The intervention for individu- als at high risk of diabetes, however, was sensitive to diabetes related costs because of the number of individuals diagnosed with diabetes as a result of this screening and intervention process.
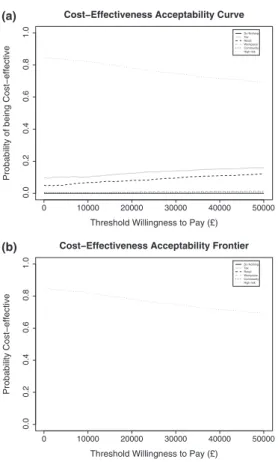
The probabilistic sensitivity analyses are summarized in Fig. 2 and in the Supporting Information, supplementary results. Figure 2a shows that the screening and intensive lifestyle intervention has~78% probability of being the most
TAX RETAIL WORK HIGH RISK QALYS
Intervention incremental QALY per person in quintile 0.00000.00050.00100.00150.0020 Deprivation quintile
Q1 (least) Q2 Q3 Q4 Q5 (most)
TAX RETAIL WORK HIGH RISK Costs
Intervention incremental Cost per person in quintile −25−20−15−10−50
Deprivation quintile Q1 (least) Q2 Q3 Q4 Q5 (most)
Cost and QALY gains by deprivation quintiles
FIGURE 1Lifetime incremental costs and QALYs compared to doing nothing, by deprivation quintile from simulation of five million adults in the general population
Table 3Lifetime incremental day of work absence per 5 000 000 simulated individuals, deaths whilst in employment per 5 000 000 simulated individuals and overall employer cost per individual in employment at baseline compared with a do-nothing strategy
Soft drinks tax
Retail policy
Workplace health promotion
Community dietary advice
Intervention for individuals at high risk (a) Baseline analysis assuming work absence after diabetes diagnosis
Days absent from work 5118 3181 2102 854 31044
Deaths whilst in employment 5 35 20 0 46
Employer cost per individual in employment at baseline* £0.12 £0.05 £0.03 £0.02 £0.43 (b) Sensitivity analysis assuming work absence after diabetes onset (diagnosed plus undiagnosed)
Days absent from work 6106 2253 1473 321 919
Deaths whilst in employment 9 9 7 1 8
Employer cost per individual in employment at baseline* £0.11 £0.02 £0.01 £0.01 £0.05
*Discounted at 1.5%.
cost-effective strategy above a threshold of £20,000 per QALY gained and Figure 2a shows that this intervention maximizes net benefit at all willingness-to-pay thresholds.
Discussion
The present analysis showed that the intensive lifestyle intervention in individuals at a high risk of diabetes would generate the largest benefits; however, this intervention would not reduce health inequalities in society, and might marginally increase the costs to employers. Furthermore, cost savings take many years to accrue, meaning that, in the short term, the intensive intervention is less cost-effective to the NHS than the other interventions. By contrast, soft drinks taxation or the retail policy would generate less overall net benefit over a lifetime, but a greater proportion of those who benefit would be in the most deprived groups. These interventions would be marginally cost-saving for employers and cost-savings for the NHS would accrue more quickly.
The analysis supports the introduction of two policies currently being implemented in the UK. The NHS Diabetes Prevention Programme will start in 2016 with a first wave of 27 areas making up to 20 000 places available. This will roll out to the whole country by 2020 with an expected 100 000
referrals available each year after. The present analysis shows that the programme will most likely be cost-saving to the NHS over the lifetime of the patients, and is substantially more cost-saving than alternative diabetes prevention strate- gies we have evaluated. In April 2018 a tax will be imposed on sugar-sweetened drinks in the UK. We have shown that a 20% tax is likely to result in cost-savings to the NHS and QALY gains and that the benefits are greatest amongst the most deprived socio-economic groups.
The analysis found that the community intervention in a deprived area would be the least cost-effective intervention.
Sensitivity analysis indicates that the poor performance of this intervention compared with the lifestyle intervention in individuals at high risk of diabetes is attributable to the low uptake of the intervention in this population, and does not capture the benefits of identifying undiagnosed diabetes. It is possible that changes to the choice environment, as demon- strated by the retail intervention or soft drinks tax, may be more cost-effective in the most deprived communities.
In recent years, several other studies have considered the cost-effectiveness of multiple interventions targeting different groups within the general population. There are some common findings, for example, that less intensive interven- tions targeting a broad population are cost-effective [28,29]
and are more cost-effective when targeting younger adults [29], and that individual counselling and fiscal measures are more cost-effective than workplace interventions [28]. The present analysis has two major strengths compared with previous diabetes prevention studies [30]. Firstly, the flexi- bility of the model allows input of multiple population-level scenarios, including a range of different interventions and different population subgroups targeted. Secondly, the breadth of outcomes generated for each intervention, includ- ing net benefit to the NHS in the short and long term and impact on socio-economic groups and employers. This means that the model can be adapted to suit a wide range of potential decision problems that may arise.
The present analysis has shown that most interventions are cost-saving over the lifetime horizon. In contrast, previous modelling of the health economic consequences of diabetes prevention in the UK suggested that the cost of the intervention would exceed the expected healthcare savings [31,32]. This difference can be attributed to several factors:
(1) the cost of diabetes management in early stages of disease is lower in this model following recommendations from clinical experts; (2) the inclusion of renal failure and osteoarthritis generates substantial cost savings for interven- tions over the long term; and (3) the cost of treating cardiovascular disease has increased.
There are several limitations of the model, many of which arise as a result of assumptions that have had to be made when implementing interventions because of lack of data, for example, concerning rate of weight regain, or because of indirect estimations of intervention efficacy. Sensitivity anal- ysis has been performed to explore these issues and indicates
0 10000 20000 30000 40000 50000
0.00.20.40.60.81.0
Threshold Willingness to Pay (£)
Probability of being Cost−effective
Cost−Effectiveness Acceptability Curve
Do Nothing Tax Retail Workplace Community High risk
0 10000 20000 30000 40000 50000
0.00.20.40.60.81.0
Threshold Willingness to Pay (£)
Probability Cost−effective
Cost−Effectiveness Acceptability Frontier
Do Nothing Tax Retail Workplace Community High risk
(a)
(b)
FIGURE 2(a) Cost-effectiveness acceptability curve showing the probability of being cost-effective of all five interventions and a do- nothing scenario. (b) Cost-effectiveness acceptability frontier showing the option maximizing net benefit.
that whereas model results are relatively stable to alteration of general model variables, those concerning the intervention can have dramatic effects on intervention cost-effectiveness.
To reduce uncertainty in such analyses, more evidence is needed on the long-term duration of benefits, the uptake of interventions in different population sub-groups and the direct effects of interventions on metabolic trajectories.
Cost-effectiveness is not the only issue of importance for public health policy-makers; other targets such as addressing social inequalities are also important [33]. We present the relative distribution of incremental costs and QALYs for each intervention (Fig. 1); however, we have not varied the effectiveness of the interventions by sub-group for the soft drinks tax, workplace intervention or intensive lifestyle programme. It is possible that the interventions will have differential effectiveness according to baseline BMI or socio- economic group. The evidence suggested almost no differ- ences in effectiveness of the soft drinks tax by income group [16], and no evidence was available to describe the effec- tiveness of the workplace intervention or intensive lifestyle programme by socio-economic group or baseline BMI.
Further research is needed to examine in more detail the differential impact of these policies on sub-groups. Our validation work indicates that the model may overestimate HbA1c and systolic blood pressure in people with newly diagnosed diabetes, which may bias the cost-effectiveness outcomes. There is a paucity of up-to-date data, however, on metabolic trajectories for patients with diabetes to investi- gate whether this underestimate persists in the long term.
There are several avenues for further research to extend the analysis to other policy areas and reduce uncertainty in the model. The model is sufficiently flexible to investigate the effect of layering multiple interventions across overlapping target populations. Another area for future model develop- ment would be to add in the effects of changes on physical activity, a common target for diabetes prevention interven- tions. Unpicking the differential effects of physical activity and dietary change/weight loss would be highly informative to developers of diabetes prevention programmes. Further exten- sions of the model to describe smoking and alcohol consump- tion would allow analyses of other public health policies.
Finally, we do not currently account for non-related healthcare costs that may have an impact on the results, particularly where interventions improve survival [34]. Current NICE guidelines [26] do not require inclusion of unrelated healthcare costs, but we believe that the model would benefit from inclusion of other health outcomes, such as dementia.
Funding sources
This study presents independent research funded by the National Institute for Health Research School for Public Health Research. Researchers worked, wrote the report and decided to submit it for publication entirely independently from the funders.
Competing interests None declared.
Acknowledgements
We are grateful to the participants of the stakeholder workshops whose comments were instrumental in the design of the simulation model. This study presents independent research funded by the National Institute for Health Research’s School for Public Health Research. The views expressed are those of the authors and not necessarily those of the NHS, the National Institute for Health Research or the Department of Health.
References
1 Mainous AG III, Tanner RJ, Baker R, Zayas CE, Harle CA.
Prevalence of prediabetes in England from 2003 to 2011: popula- tion-based, cross-sectional study.BMJ Open2014;4: e005002.
2 Tabak AG, Herder C, Rathmann W, Brunner EJ, Kivimaki M.
Prediabetes: a high-risk state for diabetes development. Lancet 2012;379: 2279–2290.
3 Segal L, Dalton A, Richardson J. Cost-effectiveness of the primary prevention of non-insulin dependent diabetes mellitus. Health Promot Int1998;13: 197–209.
4 National Institute for Health and Care Excellence. PH38 Preventing type 2 diabetes - risk identification and interventions for individuals at high risk: guidance. National Institute for Health and Care Excellence 2012NICE public health guidance 38. Available at http://guidance.nice.org.uk/PH38/Guidance/pdf/English Last acc- essed 15 March 2017.
5 Watson P, Preston L, Squires H, Chilcott J, Brennan A. Modelling the Economics of Type 2 Diabetes Mellitus Prevention: A Literature Review of Methods.Appl Health Econ Health Policy2014;12: 239–253.
6 Squires H. A methodological framework for developing the structure of Public Health economic models. White Rose ethesis online 2014. Available at http://etheses.whiterose.ac.uk/5316/ Last accessed 15 March 2017.
7 NatCen Social Research. Health Survey for England. University College London Department of Epidemiology and Public Health 2011. Available at: http://www.esds.ac.uk/findingData/hseTitles.asp 8 Breeze P, Squires H, Chilcott J, Stride C, Diggle PJ, Brunner Eet al.
A statistical model to describe longitudinal and correlated meta- bolic risk factors: the Whitehall II prospective study. J Public Health2016;38: 679–687.
9 Hippisley-Cox J, Coupland C, Vinogradova Y, Robson J, Minhas R, Sheikh A et al. Predicting cardiovascular risk in England and Wales: prospective derivation and validation of QRISK2. BMJ 2008;336: 1475–1482.
10 Kannel WB, D’Agostino RB, Silbershatz H, Belanger AJ, Wilson PW, Levy D. Profile for estimating risk of heart failure.Arch Intern Med1999;159: 1197–1204.
11 Hayes AJ, Leal J, Gray AM, Holman RR, Clarke PM. UKPDS outcomes model 2: a new version of a model to simulate lifetime health outcomes of patients with type 2 diabetes mellitus using data from the 30 year United Kingdom Prospective Diabetes Study:
UKPDS 82.Diabetologia2013;56: 1925–1933.
12 Lahmann PH, Hoffmann K, Allen N, van Gils CH, Khaw KT, Tehard Bet al. Body size and breast cancer risk: findings from the European Prospective Investigation into Cancer And Nutrition (EPIC).Int J Cancer2004;111: 762–771.
13 Pischon T, Lahmann PH, Boeing H, Friedenreich C, Norat T, Tjonneland Aet al. Body size and risk of colon and rectal cancer in the European Prospective Investigation Into Cancer and Nutrition (EPIC).J Natl Cancer Inst2006;98: 920–931.
14 Schett G, Kleyer A, Perricone C, Sahinbegovic E, Iagnocco A, Zwerina J et al. Diabetes is an independent predictor for severe osteoarthritis: results from a longitudinal cohort study.Diabetes Care2013;36: 403–409.
15 Golden SH, Lazo M, Carnethon M, Bertoni AG, Schreiner PJ, Diez Roux AV et al. Examining a bidirectional association between depressive symptoms and diabetes.JAMA2008;299: 2751–2759.
16 Briggs AD, Mytton OT, Kehlbacher A, Tiffin R, Rayner M, Scarborough P. Overall and income specific effect on prevalence of overweight and obesity of 20% sugar sweetened drink tax in UK:
econometric and comparative risk assessment modelling study.
BMJ2013;347: f6189.
17 Wrigley N, Warm D, Margetts B. Deprivation, diet, and food-retail access: findings from the Leeds ‘food deserts’ study. Environ Planning2003;35: 151–188.
18 Holdsworth M, Raymond NT, Haslam C. Does the Heartbeat Award scheme in England result in change in dietary behaviour in the workplace?Health Promot Int2004;19: 197–204.
19 Gray C, Anderson A, Clarke A, Dalziel A, Hunt K, Leishman J et al. Addressing male obesity: an evaluation of a group-based weight management intervention for Scottish men.J Mens Health 2009;6: 70–81.
20 McKellar G, Morrison E, McEntegart A, Hampson R, Tierney A, Mackle G et al. A pilot study of a Mediterranean-type diet intervention in female patients with rheumatoid arthritis living in areas of social deprivation in Glasgow.Ann Rheum Dis2007;66:
1239–1243.
21 Gray LJ, Davies MJ, Hiles S, Taub NA, Webb DR, Srinivasan BT et al. Detection of impaired glucose regulation and/or type 2 diabetes mellitus, using primary care electronic data, in a multiethnic UK community setting.Diabetologia2012;55: 959– 966.
22 Dunkley AJ, Bodicoat DH, Greaves CJ, Russell C, Yates T, Davies MJet al. Diabetes Prevention in the Real World: Effectiveness of Pragmatic Lifestyle Interventions for the Prevention of Type 2 Diabetes and of the Impact of Adherence to Guideline Recommen- dations: A Systematic Review and Meta-analysis. Diabetes Care 2014;37: 922–933.
23 Cochrane T, Gidlow CJ, Kumar J, Mawby Y, Iqbal Z, Chambers RM. Cross-sectional review of the response and treatment uptake from the NHS Health Checks programme in Stoke on Trent. J Public Health (Oxf)2013;35: 92–98.
24 Thomas C, Sadler S, Squires H, Gillett M, Brennan A. Assessing the potential return on investment of the proposed NHS diabetes prevention programme in different population subgroups. Public Health England 2016. Available at http://www.yhpho.org.uk/defa ult.aspx?RID=235836 Last accessed 15 March 2017.
25 Dansinger ML, Tatsioni A, Wong JB, Chung M, Balk EM. Meta- analysis: the effect of dietary counseling for weight loss.Ann Intern Med2007;147: 41–50.
26 Developing NICE guidelines: the manual. National Institute of Health and Care Excellence. 2014. Available at https://www.nice.
org.uk/process/pmg20/chapter/introduction-and-overview. Last ac- cessed 15 March 2017.
27 Tabak AG, Akbaraly TN, Batty GD, Kivimaki M. Depression and type 2 diabetes: a causal association?Lancet Diabetes Endocrinol 2014;2: 236–245.
28 Cecchini M, Sassi F, Lauer JA, Lee YY, Guajardo-Barron V, Chisholm D. Tackling of unhealthy diets, physical inactivity, and obesity: health effects and cost-effectiveness. Lancet2010; 376: 1775–1784.
29 Feenstra TL, van Baal PM, Jacobs-van der Bruggen MO, Hoogen- veen RT, Kommer GJ, Baan CA. Targeted versus universal prevention. a resource allocation model to prioritize cardiovascular prevention.Cost Eff Resour Alloc2011;9: 14–19.
30 Centre for Public Health Excellence. Supporting investment in public health: Review of methods for assessing cost effectiveness, cost impact and return on investment. Proof of concept report. National Institute for Health and Care Excellence 2011. Available at https://
www.nice.org.uk/media/default/About/what-we-do/NICE-guidance/
NICE-guidelines/Public-health-guidelines/Additional-publications/
Cost-impact-proof-of-concept.pdf Last accessed 15 March 2017.
31 Gillett M, Chilcott J, Goyder L, Payne N, Thokala P, Freeman C et al. Prevention of type 2 diabetes: risk identification and interventions for individuals at high risk. NICE Centre for Public Health Excellence 2011. Available at https://www.nice.org.uk/
guidance/ph38/evidence/he1-costeffectiveness-review-and-economic- modelling-435125485 Last accessed 15 March 2017.
32 Gillett M, Royle P, Snaith A, Scotland G, Poobalan A, Imamura M et al. Non-pharmacological interventions to reduce the risk of diabetes in people with impaired glucose regulation: a systematic review and economic evaluation.Health Technol Assess2012;16:
1–236, iii-iv.
33 Marmot M. Fair society, health lives. The Marmot Review.
Strategicreview of health inequalities in England post 2010 2011.
Available at http://www.instituteofhealthequity.org/projects/fair-soc iety-healthy-lives-the-marmot-review Last accessed 15 March 2017.
34 van Baal P, Meltzer D, Brouwer W. Future Costs, Fixed Healthcare Budgets, and the Decision Rules of Cost-Effectiveness Analysis.
Health Econ2016;25: 237–248.
Supporting Information
Additional Supporting Information may be found in the online version of this article:
Data S1.Methods Data S2.Results
Table S1.Total costs, QALYs and incremental analysis per person in the general population comparing all strategies Table S2. One-way sensitivity analyses showing expected Net Benefit per individual in the general population (based on 2 million simulated individuals so baseline results differ slightly from Table 1)
Table S3. Probabilistic Sensitivity Results for 2000 model runs of 20000 individuals