Downloadedfromhttp://journals.lww.com/pancreasjournalbyBhDMf5ePHKbH4TTImqenVH0e3gbzxI4t7G0NlGpd3VcIN0d6oyfIg3tLG3tnnD0cEsnLNaZ42lk=on08/17/2018
Downloadedfrom http://journals.lww.com/pancreasjournalby BhDMf5ePHKbH4TTImqenVH0e3gbzxI4t7G0NlGpd3VcIN0d6oyfIg3tLG3tnnD0cEsnLNaZ42lk=on
08/17/2018
Preexisting Diabetes Elevates Risk of Local and Systemic Complications in Acute Pancreatitis
Systematic Review and Meta-analysis
Alexandra Mikó, MD, PhD,* Nelli Farkas, PhD,*† András Garami, MD, PhD,* Imre Szabó, MD, PhD,‡
Áron Vincze, MD, PhD, ‡ Gábor Veres, MD, PhD, DSc,§ Judit Bajor, MD, ‡ Hussain Alizadeh, MD, PhD,||
Zoltán Rakonczay, Jr, MD, PhD, DSc,¶ Éva Vigh, MD, PhD,#** Katalin Márta, MD,* Zoltán Kiss, MD,§
Péter Hegyi, MD, PhD, DSc,* ††‡‡ and László Czakó, MD, PhD, DSc¶
Abstract:The prevalence of diabetes mellitus (DM) and acute pancreati- tis (AP) increases continuously, therefore, to understand the effects of preexisting diabetes on AP is crucially needed. Here, we performed a sys- tematic review and meta-analysis in which AP patients including DM and non-DM groups were sorted. Several outcome parameters were analyzed, and the odds ratio (OR) and standardized mean difference with 95% confi- dence intervals (CIs) were calculated.
We found 1417 articles, of which 9 articles involving 354,880 patients were analyzed. More complications were seen in diabetic patients than in non-DM patients (OR, 1.553 [95% CI, 1.266–1.904];P< 0.001). Intensive care unit admission (OR, 1.799 [95% CI, 1.442–2.243];P< 0.001) and re- nal failure (OR, 1.585 [95% CI, 1.278–1.966];P< 0.001) were more fre- quent in DM patients. There was a tendency of higher mortality and local complications (OR, 1.276 [95% CI, 0.991–1.643];P= 0.059; and OR, 1.267 [95% CI, 0.964–1.659];P = 0.090, respectively) in preexisting DM. Length of hospitalization was longer in DM patients (standardized mean difference, 0.217 [95% CI, 0.075–0.360];P= 0.003). Preexisting DM negatively influences the outcome of AP and increases the risk of renal failure, local complications, and mortality.
Key Words:acute pancreatitis, complications, diabetes mellitus, mortality, length of hospitalization
(Pancreas2018;47: 917–923)
A
cute pancreatitis (AP) is a severe inflammatory condition with increasing incidence and hospitalization worldwide.1,2 Acute pancreatitis has a variable severity ranging from mild and self-limited to severe and fatal. The mortality of the disease ranges approximately from 2 to 5% and depends on the development of organ failure and local complications, which are summarized in the revised 2012 Atlanta classification.3The major etiological factors are gallstones and alcohol intake,1but hypertriglyceridemia and in- take of certain medications may also be present in the background.The global prevalence of diabetes among adults doubled be- tween 1980 and 2014.4The relationship between AP and diabetes mellitus (DM) is complex. Acute pancreatitis may result in DM.5 On the other hand, patients with type 2 (T2) DM had an elevated risk of AP,6–10and the risk of AP in diabetic patients can be re- duced with appropriate glycemic control.11Furthermore, DM pa- tients tend to develop hypertriglyceridemia and gallstones, both of which may lead to AP.12,13Hyperglycemia was demonstrated to be closely correlated with poor outcomes of morbidity and mortal- ity in critically ill patients.14Many patients with T2DM have co- morbid conditions (eg, heart failure, renal disease, liver disease, and obesity), which may increase the risk of severe AP and can be strong predictors of early death from AP.15,16Moreover, diabetic comorbidities require the use of medications that have been associ- ated with pancreatitis. Incretin use in the treatment of T2DM has been investigated in several meta-analyses of the risk of AP.17–21
Experimental studies clearly suggest that preexisting diabe- tes deteriorates the outcome of AP. Zechner et al22showed that di- abetes significantly raises the plasma interleukin 6 concentration and further reduces the number of lymphocytes during AP; diabetes thus exacerbates pancreatitis-induced systemic inflammation. Other studies have also demonstrated that diabetes increases pancreatic fi- brosis23,24and decreases pancreatic regeneration.25–27Importantly, cholecystokinin-promoted pancreatic regeneration was also impaired in diabetic rats after the induction of experimental pancreatitis.28 Unfortunately, little human data are available on the effect of preexisting DM or the complications of AP. No systematic reviews or meta-analyses are available to summarize our knowledge of the effects of preexisting diabetes on the outcome of AP.
In this study, we therefore aimed to demonstrate the influence of preexisting DM on the outcomes of AP, including mortality, length of hospitalization (LOH), incidence of organ failure, and in- tensive care unit (ICU) admission in a large number of patients by using detailed meta-analyses of the data available in the literature.
From the *Institute for Translational Medicine,†Institute of Bioanalysis, Med- ical School,‡Division of Gastroenterology, 1st Department of Internal Medi- cine, University of Pécs, Pécs; §1st Department of Paediatrics, Semmelweis University, Budapest; ||Division of Haematology, 1st Department of Internal Medicine, University of Pécs, Pécs; ¶Department of Pathophysiology, Univer- sity of Szeged, Szeged; #Department of Radiology, Medical School, University of Pécs, Pécs; **Department of Central Radiology, Markusovszky University Teaching Hospital, Szombathely;††Department of Translational Medicine, 1st Department of Medicine, University of Pécs, Pécs; and‡‡Momentum Gas- troenterology Multidisciplinary Research Group, Hungarian Academy of Sci- ences, University of Szeged, Szeged, Hungary.
Received for publication November 13, 2017; accepted June 11, 2018.
Address correspondence to: Péter Hegyi, MD, PhD, DSc, Institute for Translational Medicine, Medical School, University of Pécs, Szigeti út 12, II em, Pécs H-7624, Hungary (e‐mail: hegyi2009@gmail.com).
P.H. and L.C. contributed equally to this article.
This study was supported by Project Grants (K116634 and KH125678 to P.H.) and Economic Development and Innovation Operative Programme Grant (GINOP 2.3.2-15-2016-00048 to P.H.) and Human Resources
Development Operational Programme Grant (EFOP-3.6.2-16-2017-00006 to P.H.) of the National Research, Development and Innovation Office and by a Momentum Grant of the Hungarian Academy of Sciences (LP2014-10/2014 to P.H.). The authors declare no conflict of interest.
Supplemental digital contents are available for this article. Direct URL citations appear in the printed text and are provided in the HTML and PDF versions of this article on the journal’s Web site (www.pancreasjournal.com).
Copyright © 2018 The Author(s). Published by Wolters Kluwer Health, Inc.
This is an open-access article distributed under the terms of the Creative Commons Attribution-Non Commercial-No Derivatives License 4.0 (CCBY-NC-ND), where it is permissible to download and share the work provided it is properly cited. The work cannot be changed in any way or used commercially without permission from the journal.
DOI: 10.1097/MPA.0000000000001122
MATERIALS AND METHODS Search Strategy
This study was conducted according to the principles in the Preferred Reporting Items for Systematic Reviews and Meta- Analyses) statement29(Supplementary Table 1, http://links.
lww.com/MPA/A663) and was registered in the PROSPERO registry (under registration number CRD42016053207). Our meta- analysis was based on the patient, intervention, comparison, and outcome (PICO) format (P, patients suffering from AP; I, diabetic patients; C, nondiabetic patients; O, mortality, LOH, organ failure, ICU admission). A systematic search was made in 3 databases, Pubmed, Embase, and the Cochrane Library, using the following terms:acute pancreatitisanddiabetes mellitus. The search was limited to human data and to full-text English articles. The exact search terms in Pubmed were as follows: (acute[all fields] and (pancreatitis[MeSH terms] orpancreatitis[all fields])) and (dia- betes mellitus[MeSH terms] or (diabetes[all fields] andmellitus [all fields]) ordiabetes mellitus[all fields]) and (humans[MeSH terms] and English[lang]). The database search was conducted up to March 8, 2017. The duplicates were removed using the EndNote X7 reference manager software (Clarivate Analytics, Philadelphia, Penn).
Study Selection
The studies were selected separately by two investigators (A.M.
and L.C.). Disagreements were resolved by consulting a third re- viewer (P.H.). Clinical studies were eligible provided that they re- ported the data for adult patients suffering from AP separately for diabetic and nondiabetic patients. Information on the outcome of pancreatitis (mortality, organ failure, LOH, and admission to ICU) was searched for manually (Supplementary Table 2, http://links.lww.com/MPA/A663). The reference lists in the ar- ticles obtained were also checked, but no additional eligible arti- cles were found.
Data Extraction
For statistical analysis, mortality data were calculated by number of patients30,31; local complications32 and renal failure data33were expressed as percentages. The data for Supplementary Table 2 (http://links.lww.com/MPA/A663) from Mole et al34were computed, and the percentage for ICU admission was calculated for the DM and non-DM groups. Kikuta et al30presented graphs on organ failures in DM and non-DM groups each day in the first 72 hours. These data were confirmed by the investigators, and an average value was calculated from data for 3 days. Nawaz et al35 only presented the median for LOH. The interquartile range for these data was requested for statistical analysis.
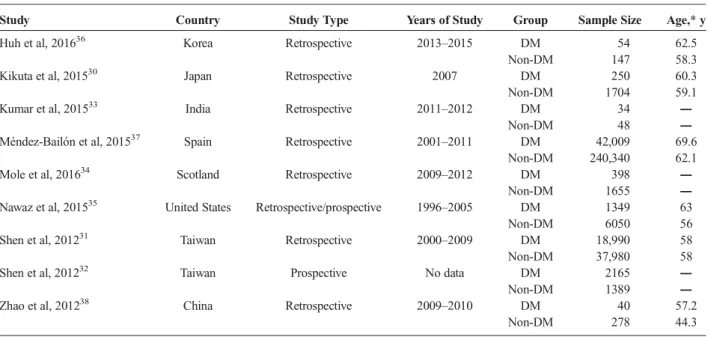
The basic characteristics of the 9 eligible articles included in the meta-analysis are shown in Table 1.
Data Synthesis and Analysis
All meta-analysis calculations were made with Comprehensive Meta-Analysis software version 3 (Biostat, Inc., Englewood, NJ) using the random effects model (DerSimonian-Laird method39).
Odds ratios (OR) and 95% confidence intervals (CIs) were calcu- lated for binary outcomes. In the case of LOH, standardized mean difference with 95% CI was calculated to compare mean data. We used the conversion method by Hozo et al40because only the me- dian and interquartile range were provided in some studies.31,35,37 All analyses were 2-tailed, with anαvalue of 0.05.
Heterogeneity was tested using CochraneQandI2statistics.
Based on theCochrane Handbook,I2= 100%(Q−df)/Qrep- resents the magnitude of the heterogeneity (moderate, 30%–60%;
substantial, 50%–90%; considerable, 75%–100%).41
The results from 4 or more studies were displayed graphi- cally using forest plots. These outcomes are mortality, LOH, and complications. Results were also weighted based on the number of patients studied in the articles. To assess required information size and to estimate the robustness of our conclusions, we con- ducted a trial sequential analysis (TSA; with TSA tool from Co- penhagen Trial Unit, Center for Clinical Intervention Research,
TABLE 1. Description of the Studies Included in the Meta-analysis
Study Country Study Type Years of Study Group Sample Size Age,*y
Huh et al, 201636 Korea Retrospective 2013–2015 DM 54 62.5
Non-DM 147 58.3
Kikuta et al, 201530 Japan Retrospective 2007 DM 250 60.3
Non-DM 1704 59.1
Kumar et al, 201533 India Retrospective 2011–2012 DM 34 ―
Non-DM 48 ―
Méndez-Bailón et al, 201537 Spain Retrospective 2001–2011 DM 42,009 69.6
Non-DM 240,340 62.1
Mole et al, 201634 Scotland Retrospective 2009–2012 DM 398 ―
Non-DM 1655 ―
Nawaz et al, 201535 United States Retrospective/prospective 1996–2005 DM 1349 63
Non-DM 6050 56
Shen et al, 201231 Taiwan Retrospective 2000–2009 DM 18,990 58
Non-DM 37,980 58
Shen et al, 201232 Taiwan Prospective No data DM 2165 ―
Non-DM 1389 ―
Zhao et al, 201238 China Retrospective 2009–2010 DM 40 57.2
Non-DM 278 44.3
*Data expressed as either mean or median.
Denmark; version 0.9 beta, www.ctu.dk/tsa) and a sensitivity analysis. The required information size calculation was based on the assumption of a 10% relative risk reduction, and we adjusted all analysis for heterogeneity (diversity adjustment). The TSA monitoring boundaries were built based on a risk for a type I error of 5% and a type II error of 20%. If a TSA monitoring boundary is crossed with a Z-curve before the required information size is reached, robust evidence might have been confirmed and further trials are unnecessary. Therefore, more trials are needed in this field. With sensitivity analysis, we can assess whether altering any of the assumptions may lead to different final interpretations or conclusions.42
Quality of Studies and Risk of Bias
Because of the low number of articles, publication bias was obtained by visual inspection of the funnel plots. The Newcastle-Ottawa scale43was used for a quality assessment of nonrandomized cohort studies. The selection, comparability, and outcome data were assessed with the star system based on 7 items (Supplementary Tables 3–4, http://links.lww.com/MPA/A663):
high-quality items carrying a low risk of bias were assigned one star, whereas low-quality items carrying a high or unknown risk of bias received no stars. Selection consisted of 4 items, with arti- cles earning 2 stars for comparability and only adequacy of follow-up being rated at outcome. Assessment of outcome and length of follow-up were not rated because most of the articles were retrospective. We assigned a star for responsiveness of study population if all of the AP patients with or without DM were in- cluded, but no stars were given whenever selection criteria were applied. Low risk of bias was assessed if AP diagnosis was
ascertained by 2 of 3 criteria (elevation of serum amylase and/or lipase activity at least 3 times higher than the upper normal limit, presence of abdominal pain, and inflammation detected with abdom- inal ultrasound and/or computed tomography) and if the standard definition of preexisting DM was applied, whereas the inclusion of newly diagnosed DM based on elevated HbA1c was also accept- able.44 Diabetes mellitus and non-DM patients were compared based on age and body mass index because the negative influence of obesity is well known in AP patients.45If there was a follow- up, the adequate number of patients was screened for complications.
RESULTS Study Selection
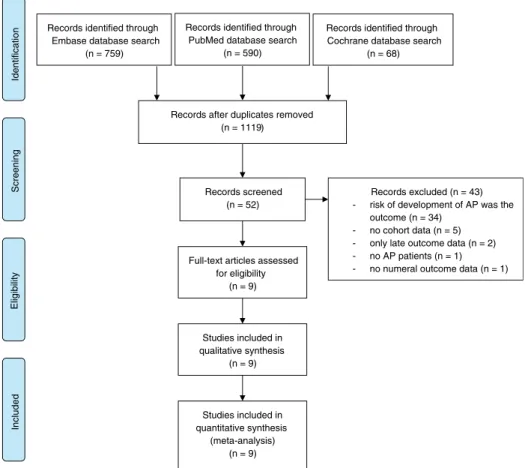
Database searches produced a total of 1417 articles (Embase, 759; PubMed, 590; Cochrane, 68). The flow chart diagram (Fig. 1) shows the strategy for article selection. Studies used in our meta- analysis were dated from 1948 to March 2017. After removal of du- plicates, 1119 unique records remained. Following initial screening based on titles and abstracts, case reports and records with data on children were excluded; 52 articles were finally retrieved and screened. A further 43 articles were excluded: 34 because the main outcome was the risk of development of AP, 5 because of the inappropriate classification of values (there were no DM and non-DM groups), 1 by reason of missing numerical outcome data, 2 with only late outcome data (pancreatic exocrine or endocrine insufficiency), and 1 in which not all of the patients had AP.
The remaining 930–38articles were included in the meta-analysis (Table 1). They consisted of 354,880 patients, 65,289 of whom had preexisting DM as a comorbidity.
FIGURE 1. Flowchart for the study selection procedure.
Complications
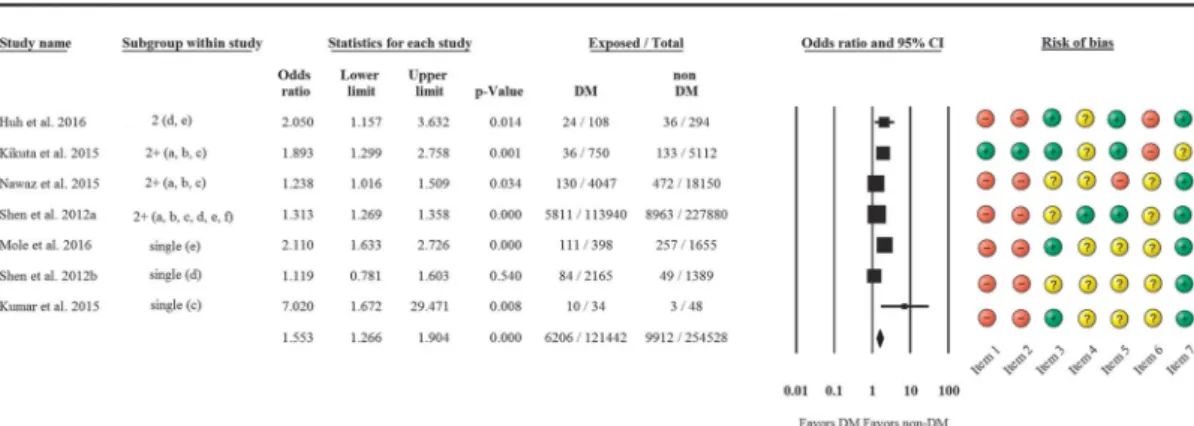
The rate of complications in the 2 AP groups was analyzed first. Overall, based on 7 articles, more complications were seen in DM patients than in non-DM patients (OR, 1.553 [95% CI, 1.266–1.904];P< 0.001) (Fig. 2).
A subgroup analysis was conducted to detect which types of complications are most frequent in DM. In the case of preexisting DM, significantly more ICU admissions (OR, 1.799 [95% CI, 1.442–2.243];P< 0.001) and renal failure (OR, 1.585 [95% CI, 1.278–1.966];P< 0.001) were seen than in non-DM patients. Di- abetic patients more often develop local complications (OR, 1.276 [95% CI, 0.991–1.643]; P= 0.059), but the difference did not reach statistical significance. No differences were found in cardio- vascular (OR, 0.942 [95% CI, 0.722–1.23];P= 0.661), neurological, and respiratory complications (OR, 1.060 [95% CI, 0.833–1.349];
P= 0.636) (Fig. 3).
Mortality and LOH
Among the 9 studies, only 6 included the mortality data for AP patients. A tendency of higher AP mortality was observed in
DM patients as compared with non-DM patients (OR, 1.265 [95% CI, 0.964–1.659];P= 0.090) (Fig. 4). Length of hospital- ization was longer in DM patients than in non-DM patients based on 5 articles (standardized mean difference, 0.217 [95% CI, 0.075–0.360];P= 0.003) (Fig. 5).
Heterogeneity and Quality Assessment of Data High heterogeneity was detected for overall complications (Q = 25.12; DF = 6; I2 = 76.11%; P < 0.001), renal failure (Q= 10.32; DF = 3;I2= 70.96%;P= 0.016), mortality (Q= 49.2;
DF = 5;I2= 89.84%;P< 0.001) and LOH (Q= 414.74; DF = 4;
I2= 99.03%;P< 0.001), whereas lower heterogeneity was observed for ICU admission (Q= 4.43; DF = 2;I2= 54.84%;P= 0.11) and local complications (Q= 1.77; DF = 2;I2= 0%;P= 0.41). To eval- uate publication bias, we only made a visual assessment of the fun- nel plot (Supplementary Fig. 1, http://links.lww.com/MPA/A677) because we were only able to include 9 studies in our meta- analysis. According to theCochrane Handbook,41“tests for funnel plot asymmetry should be used only when there are at least 10 stud- ies included in the meta-analysis, because when there are fewer FIGURE 2. Forest plot representing the differences in complications in DM and non-DM patients suffering from AP. Size of squares for risk ratio reflects weight of trial in pooled analysis. Horizontal bars represent 95% CIs. Single, only 1 complication is available; 2+, more complications are available; a, cardiovascular; b, respiratory; c, renal; d, local; e, intensive care unit admission; f, neurological.
FIGURE 3. Forest plot representing detailed differences in several types of complications in DM and non-DM patients suffering from AP. Size of squares for risk ratio reflects weight of trial in pooled analysis. Horizontal bars represent 95% CIs.
studies the power of the tests is too low to distinguish chance from real asymmetry.”Articles received between 1 and 5 stars out of the maximum 7 stars on the Newcastle-Ottawa scale (Supplementary Table 4, http://links.lww.com/MPA/A663). A high risk of bias was identified in terms of the representativeness of the study pop- ulation because AP patients were selected in most of the articles (Supplementary Fig. 2, http://links.lww.com/MPA/A678). The percentage of unclear risk of bias was 77.8% in the presence of outcome of interest (Supplementary Fig. 2, http://links.lww.com/
MPA/A678), but cardiovascular, renal, and respiratory complica- tions were available in only 3 or 4 articles. Body mass index data were available in only 3 articles, but unfortunately, a statistical dif- ference was observed between DM and non-DM groups. Two ar- ticles earned only 1 star,32,35whereas 1 article received 5 stars38 (Supplementary Table 4, http://links.lww.com/MPA/A663).
Sensitivity analysis showed no significant difference in overall and detailed complications and LOH (Supplementary Figs. 3A, B, D, http://links.lww.com/MPA/A679), whereas if we remove the Méndez-Bailon37and Shen et al31articles with respect to mortality, OR for mortality would change significantly from pooled OR (2.152 [95% CI, 1.063–4.358],P= 0.033 and 2.157 [95% CI, 1.165; 3.995],P= 0.014, respectively) (Supplementary Fig. 3C, http://links.lww.com/MPA/A679). Both articles involve a high number of patients and a longer follow-up time, but both ar- ticles contain data on a large patient population. We therefore in- cluded them in our meta-analysis.
Trial sequential analysis showed that in combinations and mor- tality the information size to achieve is 2,903,700, and these studies do not reach this yet (Supplementary Figs. 4A, B, http://links.lww.
com/MPA/A680). With regard to LOH, studies reached the
appropriate information size (301,416) (Supplementary Fig.
4C, http://links.lww.com/MPA/A680).
DISCUSSION AND CONCLUSIONS
In this meta-analysis, we investigated the influence of preexisting DM on different outcome parameters in AP patients. With regard to overall complications, we found significantly more complica- tions in DM groups than in non-DM groups (Fig. 2), and higher rates of renal failure and ICU admission were also observed (Fig. 3). One quarter to half of the patients diagnosed with DM might develop chronic kidney disease, thus increasing mortality of DM.46The development of renal failure determines the severity of AP according to the revised 2012 Atlanta Classification,3and it raises the mortality of AP.47The mechanism for renal failure during AP is not yet completely understood, but it has been shown that injury due to inflammatory mediators, cytokines, transcription factors, microcirculation changes, and apoptosis are important pathogenic factors.48Development of renal failure increased the mortality of AP, suggesting that it has detrimental effects on pa- tients with preexisting DM. The data in our meta-analysis indi- cated a tendency of higher mortality in DM patients (Fig. 4). It must be noted that there are data that contradict our findings. In- tensive care unit mortality only grew significantly with higher mean blood glucose concentration in non-DM patients but not in DM patients.14,49For example, Graham et al50showed that crit- ically ill patients with DM do not experience higher mortality compared with that seen in patients without DM. This may be ex- plained with the beneficial antioxidant and anti-inflammatory ef- fects of exogenous insulin used for treating hyperglycemia in FIGURE 4. Forest plot representing the differences in mortality in DM and non-DM patients suffering from AP. Size of squares for risk ratio reflects weight of trial in pooled analysis. Horizontal bars represent 95% CIs.
FIGURE 5. Forest plot representing the differences in LOH in DM and non-DM patients suffering from AP. Size of squares for the difference in standardized mean values reflects weight of trial in pooled analysis. Horizontal bars represent 95% CIs.
DM.51,52Insulin acts on the suppression of innate immune mech- anisms and transcription factors NF-ĸB and Egr-1.52With regard to the local complications in our analyses, DM patients tend to de- velop local complications more often. This is most probably due to damage to the endocrine-exocrine axis, which was discussed in detail in the background section.
Based on pooled data, diabetic AP patients spend more time in hospital (Fig. 5). This can be explained by the more intense sys- temic inflammatory response, more frequent complications, slower recovery, and settlement of glucose homeostasis in DM patients.
The OR calculated for mortality and LOH data in Zhao et al38differ from those in the other studies. This is clear from the mortality and LOH data, but we did not remove it because this article received the highest points on the Newcastle-Ottawa scale and the sensitivity analysis showed no difference. In cases of cardiovascular and re- spiratory complications, no difference was observed based on diabetic status.
Several studies have demonstrated that obesity may worsen the clinical outcome of AP.45,53,54Diabetes mellitus patients tend to have higher body mass index, but unfortunately this data was only represented in a few articles and therefore was not suitable for data analysis.
There are several limitations of this study; therefore, the results of this meta-analysis should be regarded with caution. The greatest limitation is the low number of eligible articles included, thus causing higher heterogeneity. Second, the low amount of extracted data causes further difficulties. In addition, this meta-analysis includes mostly ret- rospective cohort studies. Five of 9 articles report patients from East Asia (Taiwan, Japan, Korea, and China), and only 2 present data on patients with severe AP. The Newcastle-Ottawa scale star count is un- fortunately low because the data were incomplete. Trial sequential analysis showed that no sufficient data are available on this topic and further investigations are needed to show the connection be- tween DM and complications of AP. However, despite the limita- tions, a notable advantage of our analysis is that it covers articles with data on patients from the last 20 years.
In summary, our meta-analysis highlights the crucial impor- tance of the diagnosis of DM in AP patients. It is therefore highly recommended that a diagnosis be made by measuring fasting glu- cose and HbA1c levels on admission. The increased risk for renal failure warrants more frequent measurements of renal function pa- rameters in AP patients also suffering from DM. Nevertheless, the high frequency of the cooccurrence of DM and AP patients sug- gests that further prospective high-quality cohort studies are nec- essary to understand the true link between AP and preexisting DM. First, an observational clinical trial would help us to under- stand the differences between the effects of (1) untreated preexisting diabetes with high HbA1c level and (2) well controlled, previ- ously diagnosed diabetes. Second, the local mechanisms behind the harmful effects of preexisting diabetes need in depth scrutiny.
Therefore, another trial should be performed in which the levels of insulin, C-peptide, and glucagon are measured in patients with AP and DM. It is needless to say that further interventional studies should be performed to identify the best treatment options of dia- betes during AP.
In conclusion, our systematic review and meta-analysis clearly shows that preexisting DM negatively influences AP outcomes by raising the incidence of renal failure, ICU admission, and LOH and leads to a tendency of higher mortality.
ACKNOWLEDGMENTS
The present scientific contribution is dedicated to the 650th anniversary of the founding of the University of Pécs, Hungary.
REFERENCES
1. Rebours V. [Acute pancreatitis: an overview of the management]. [Article in French].Rev Med Interne. 2014;35:649–655.
2. Fagenholz PJ, Castillo CF, Harris NS, et al. Increasing United States hospital admissions for acute pancreatitis, 1988-2003.Ann Epidemiol.
2007;17:491–497.
3. Banks PA, Bollen TL, Dervenis C, et al. Classification of acute pancreatitis—2012: revision of the Atlanta classification and definitions by international consensus.Gut. 2013;62:102–111.
4. WHO Press, Global report on diabetes. Geneva, Switzerland. 2016.
5. Vujasinovic M, Tepes B, Makuc J, et al. Pancreatic exocrine insufficiency, diabetes mellitus and serum nutritional markers after acute pancreatitis.
World J Gastroenterol. 2014;20:18432–18438.
6. Xue Y, Sheng Y, Dai H, et al. Risk of development of acute pancreatitis with pre-existing diabetes: a meta-analysis.Eur J Gastroenterol Hepatol.
2012;24:1092–1098.
7. Yang L, He Z, Tang X, et al. Type 2 diabetes mellitus and the risk of acute pancreatitis: a meta-analysis.Eur J Gastroenterol Hepatol. 2013;25:
225–231.
8. Urushihara H, Taketsuna M, Liu Y, et al. Increased risk of acute pancreatitis in patients with type 2 diabetes: an observational study using a Japanese hospital database.PloS One. 2012;7:e53224.
9. Girman CJ, Kou TD, Cai B, et al. Patients with type 2 diabetes mellitus have higher risk for acute pancreatitis compared with those without diabetes.
Diabetes Obes Metab. 2010;12:766–771.
10. Lai SW, Muo CH, Liao KF, et al. Risk of acute pancreatitis in type 2 diabetes and risk reduction on anti-diabetic drugs: a population-based cohort study in taiwan.Am J Gastroenterol. 2011;106:1697–1704.
11. Gonzalez-Perez A, Schlienger RG, García Rodríguez LA. Acute pancreatitis in association with type 2 diabetes and antidiabetic drugs:
a population-based cohort study.Diabetes Care. 2010;33:2580–2585.
12. Aune D, Vatten LJ. Diabetes mellitus and the risk of gallbladder disease:
a systematic review and meta-analysis of prospective studies.J Diabetes Complications. 2016;30:368–373.
13. Laakso M. Lipid disorders in type 2 diabetes.Endocrinol Nutr. 2009;
56 Suppl 4:43–45.
14. Egi M, Bellomo R, Stachowski E, et al. Blood glucose concentration and outcome of critical illness: the impact of diabetes.Crit Care Med. 2008;36:
2249–2255.
15. Frey C, Zhou H, Harvey D, et al. Co-morbidity is a strong predictor of early death and multi-organ system failure among patients with acute pancreatitis.J Gastrointest Surg. 2007;11:733–742.
16. Premkumar R, Phillips AR, Petrov MS, et al. The clinical relevance of obesity in acute pancreatitis: targeted systematic reviews.Pancreatology.
2015;15:25–33.
17. Singh S, Chang HY, Richards TM, et al. Glucagonlike peptide 1-based therapies and risk of hospitalization for acute pancreatitis in type 2 diabetes mellitus: a population-based matched case-control study.JAMA Intern Med. 2013;173:534–539.
18. Knapen LM, de Jong RG, Driessen JH, et al. Use of incretin agents and risk of acute and chronic pancreatitis: a population-based cohort study.Diabetes Obes Metab. 2017;19:401–411.
19. Li L, Shen J, Bala MM, et al. Incretin treatment and risk of pancreatitis in patients with type 2 diabetes mellitus: systematic review and meta-analysis of randomised and non-randomised studies.BMJ. 2014;348:g2366.
20. Goodger RL, Asrani VM, Windsor JA, et al. Impact of metabolic comorbidities on outcomes of patients with acute pancreatitis: a scoping review.Panminerva Med. 2016;58:86–93.
21. Monami M, Dicembrini I, Nardini C, et al. Glucagon-like peptide-1 receptor agonists and pancreatitis: a meta-analysis of randomized clinical trials.Diabetes Res Clin Pract. 2014;103:269–275.
22. Zechner D, Spitzner M, Müller-Graff T, et al. Diabetes increases pancreatitis induced systemic inflammation but has little effect on inflammation and cell death in the lung.Int J Exp Pathol. 2014;95:
411–417.
23. Zechner D, Knapp N, Bobrowski A, et al. Diabetes increases pancreatic fibrosis during chronic inflammation.Exp Biol Med (Maywood). 2014;239:
670–676.
24. Zechner D, Spitzner M, Bobrowski A, et al. Diabetes aggravates acute pancreatitis and inhibits pancreas regeneration in mice.Diabetologia. 2012;
55:1526–1534.
25. Hegyi P, Takács T, Tiszlavicz L, et al. Recovery of exocrine pancreas six months following pancreatitis induction with L-arginine in
streptozotocin-diabetic rats.J Physiol Paris. 2000;94:51–55.
26. Hegyi P, Czako L, Takacs T, et al. Pancreatic secretory responses in L-arginine-induced pancreatitis: comparison of diabetic and nondiabetic rats.Pancreas. 1999;19:167–174.
27. Hegyi P, Rakonczay Z Jr, Sari R, et al. Insulin is necessary for the hypertrophic effect of cholecystokinin-octapeptide following acute necrotizing experimental pancreatitis.World J Gastroenterol. 2004;10:
2275–2277.
28. Takács T, Hegyi P, Jármay K, et al. Cholecystokinin fails to promote pancreatic regeneration in diabetic rats following the induction of experimental pancreatitis.Pharmacol Res. 2001;44:363–372.
29. Moher D, Liberati A, Tetzlaff J, et al. Preferred reporting items for systematic reviews and meta-analyses: the PRISMA statement.PLoS Med.
2009;6:e1000097.
30. Kikuta K, Masamune A, Shimosegawa T. Impaired glucose tolerance in acute pancreatitis.World J Gastroenterol. 2015;21:7367–7374.
31. Shen HN, Lu CL, Li CY. Effect of diabetes on severity and hospital mortality in patients with acute pancreatitis: a national population-based study.Diabetes Care. 2012;35:1061–1066.
32. Shen HN, Chang YH, Chen HF, et al. Increased risk of severe acute pancreatitis in patients with diabetes.Diabet Med. 2012;29:1419–1424.
33. Kumar R, Pahwa N, Jain N. Acute kidney injury in severe acute pancreatitis: an experience from a tertiary care center.Saudi J Kidney Dis Transpl. 2015;26:56–60.
34. Mole DJ, Gungabissoon U, Johnston P, et al. Identifying risk factors for progression to critical care admission and death among individuals with acute pancreatitis: a record linkage analysis of Scottish healthcare databases.BMJ Open. 2016;6:e011474.
35. Nawaz H, O'Connell M, Papachristou GI, et al. Severity and natural history of acute pancreatitis in diabetic patients.Pancreatology.
2015;15:247–252.
36. Huh JH, Jeon H, Park SM, et al. Diabetes mellitus is associated with mortality in acute pancreatitis.J Clin Gastroenterol. 2018;52:
178–183.
37. Méndez-Bailón M, de Miguel Yanes JM, Jiménez-García R, et al.
National trends in incidence and outcomes of acute pancreatitis among type 2 diabetics and non-diabetics in Spain (2001–2011).Pancreatology.
2015;15:64–70.
38. Zhao X, Chang Mei H, Chen L, et al. An increased level of haemoglobin A1C predicts a poorer clinical outcome in patients with acute pancreatitis.
Clin Endocrinol (Oxf ). 2012;77:241–245.
39. DerSimonian R, Laird N. Meta-analysis in clinical trials.Control Clin Trials. 1986;7:177–188.
40. Hozo SP, Djulbegovic B, Hozo I. Estimating the mean and variance from the median, range, and the size of a sample.BMC Med Res Methodol.
2005;5:13.
41. Higgins JPT, Green S, eds. Cochrane Handbook for Systematic Reviews of Interventions. Version 5.1.0(updated 2011). The Cochrane
Collaboration; 2011. Available at: http://handbook.cochrane.org. Accessed April 30, 2017.
42. Viel JF, Pobel D, Carre A. Incidence of leukaemia in young people around the La Hague nuclear waste reprocessing plant: a sensitivity analysis.Stat Med. 1995;14:2459–2472.
43. Wells GA, Shea B, O'Connell D, et al. The Newcastle-Ottawa scale (NOS) for assessing the quality of nonrandomised studies in meta-analyses. 2011.
Available at http://www.ohri.ca/programs/clinical_epidemiology/oxford.asp.
Accessed April 30, 2017.
44. American Diabetes Association. Standards of medical care in diabetes—2010.Diabetes Care. 2010;33(suppl 1):S11–S61.
45. Krishna SG, Hinton A, Oza V, et al. Morbid obesity is associated with adverse clinical outcomes in acute pancreatitis: a propensity-matched study.
Am J Gastroenterol. 2015;110:1608–1619.
46. Radcliffe NJ, Seah JM, Clarke M, et al. Clinical predictive factors in diabetic kidney disease progression.J Diabetes Investig. 2017;8:6–18.
47. Lin HY, Lai JI, Lai YC, et al. Acute renal failure in severe pancreatitis:
a population-based study.Ups J Med Sci. 2011;116:155–159.
48. Zhang XP, Wang L, Zhou YF. The pathogenic mechanism of severe acute pancreatitis complicated with renal injury: a review of current knowledge.
Dig Dis Sci. 2008;53:297–306.
49. Whitcomb BW, Pradhan EK, Pittas AG, et al. Impact of admission hyperglycemia on hospital mortality in various intensive care unit populations.Crit Care Med. 2005;33:2772–2777.
50. Graham BB, Keniston A, Gajic O, et al. Diabetes mellitus does not adversely affect outcomes from a critical illness.Crit Care Med. 2010;38:
16–24.
51. Garg R, Chaudhuri A, Munschauer F, et al. Hyperglycemia, insulin, and acute ischemic stroke: a mechanistic justification for a trial of insulin infusion therapy.Stroke. 2006;37:267–273.
52. Sun Q, Li J, Gao F. New insights into insulin: The anti-inflammatory effect and its clinical relevance.World J Diabetes. 2014;5:89–96.
53. Yoon SB, Choi MH, Lee IS, et al. Impact of body fat and muscle distribution on severity of acute pancreatitis.Pancreatology. 2017;17:
188–193.
54. Jin Z, Xu L, Wang X, et al. Risk factors for worsening of acute pancreatitis in patients admitted with mild acute pancreatitis.Med Sci Monit. 2017;23:
1026–1032.