DOI:10.18136/PE.2021.807 Universiy of Pannonia Faculty of Information Technology Doctoral School of Information Science
Optimal Current Control for Domestic Power Converters
Doctoral (PhD) Thesis
Author: László Richárd Neukirchner
Supervisor: dr. Attila Magyar
Made at:
Universiy of Pannonia
Doctoral School of Information Science
Veszprém 2021
Optimal Current Control for Domestic Power Converters
Thesis for obtaining a PhD degree in the Doctoral School of Doctoral School of Information Scienceof the Universiy of Pannonia
In the branch of Information Technology Sciences.
written by:
László Richárd Neukirchner Supervisor(s): dr. Attila Magyar propose acceptance (yes / no)
dr. Attila Magyar
The PhD-candidate has achieve ... % in the comprehensive exam.
Veszprém, ...
(Chairman of the Examination Committee)
As reviewer, I propose acceptance of the thesis:
Name of Reviewer: ... : yes / no
(Reviewer)
Name of Reviewer: ... : yes / no
(Reviewer)
The PhD-candidate has achieved ... % at the public discussion.
Veszprém, ...
(Chairman of the Committee)
The grade of the PhD Diploma: ...(... %).
Veszprém, ...
Chairman of UDHC
Acknowledgement
I would like to express my special thanks of gratitude to my supervisor and teacher Dr. Attila Magyar as well as our principal of the doctoral school Prof. Katalin Hangos who gave me the wonderful opportunity to pursue this excellent project on optimal current control, which also helped me to develop and better myself on the eld of scientic work, where I could really see myself grow and develop. I really feel gratitude to them. I would like to also thank Dr. Nimród Kutasi, and his restless support and encouragement in the led of predictive control, as well as Dr. András Kelemen in the eld of power electronics. Without they unquestionable and deep technical knowledge on the eld, and they helpfulness, kindness and hospitality this doctoral thesis would not have happened. I would also recognise Dr. Peter Görbe who helped me to put the subject of voltage quality in context and accelerated my progress at the start of my PhD. studies, and Dr. Attila Fodor, who helped me on the led of current control, and system modeling, and also helped me organise my work and guide me in the forest of research. All of they contribution were invaluable to reach this stage of completion.
Any attempt at any level can't be satisfactorily completed without the support and guidance of my spouse Klaudia, my parents Anikó and László, my sister Elisabeth, and my friends. They helped me a lot with they spiritual and nancial support in making this project, despite of their busy schedules. They always could nd enough time and energy to give me enough attention and assistance.
I could not thank you enough!
Abstract
Starting the third decade after the millennium, in the European Union, the approach of the energy-, and with it the automotive industries has changed signicantly since. The increasing governmental interventions on the industry, started with the bad reputation of diesel in passenger cars, and increasingly tighter restrictions on lead battery technologies, also Germany's renewable policies, dismantling nuclear plants encourage manufacturers and researchers for innovation in the direction of power eciency. Solutions, which seemed to occupy the second place on the podium, have been re-assessed and re-thought in the light of this approach in terms of power topologies and algorithms alike.
As the tide of renewable sources has taken the western Europe with a storm, with the high anticipation of getting rid of fossil fuels (or at least reduce they consumption), it brought down a myriad of problems to solve. The rst of these is the high stochastic nature of these source, with the ever increasing demand on storage, to smoothen out the arms of the scale of supply and de- mand. The second comes with the incentive (policy maker, and civic alike in pursuit of "cheap" and non polluting energy) of installing these sources in residual areas, parking lots, schools, household roofs, just to name a few. On top of that, these actors have higher consumers in they disposal, using them on they whim, making the situation even worse.
This introduces two interesting, yet completely understandable phenomena, which act as the "symptoms" on the quality of our well accessible electric power for our consumers, due to the reason of these trends. The rst is the harmonic distortion of the network's voltage phases, tackled with load regula- tions, and a wide range of active and passive lter designs. The second is the voltage phase asymmetry alias the voltage unbalance, appearing when uneven production, consumption, or distribution on the network. This is a major yet often overlooked power quality problem in low voltage residential feeders due to the random location and rating of single-phase renewable sources and un- even distribution of household loads. Here a new indicator of voltage deviation is proposed that may serve as a basis of analysis and compensation methods in this dimension of power quality. The rst half of this dissertation is about indicating such voltage asymmetry and mitigating it with a complex controller and electric power conversion structure, which is integrated with an optimiza- tion based control algorithm that uses asynchronous parallel pattern search as its engine. This structure uses current control on each phase to achieve the results, on the voltage quality.
The second half is zooming down on the current control aspect itself, where
a model of a power converter device is used for an optimal, predictive con- troller structure, to achieve the demanded eciency, also with the calculation capacity in check. Starting with the design of a constrained optimal control of a current source rectier, based on a mathematical model developed in Clarke and Park frame. Despite the clean establishment of the model's dif- ferential equations, the underlying bilinearity would make further controller design complicated. To comply with the system constraints an explicit model- based predictive controller was established. To simplify the control design, and eliminate the bilinearity from the equation system, a disjointed model was utilised due to the signicant time constant dierences between the AC and DC side dynamics. As a result, active damping was used on the AC side, and explicit model based predictive control on the DC side. The results are compared by simulation with the performance of a state feedback control.
VIII
Tartalmi Kivonat
Az ezredév forduló utáni harmadik évtized kezdetén az Európai unió hoz- záállása az autó- és energiaiparhoz nagyban megváltozott. A tagállamok ren- deletekkel és megszorításokkal való beavatkozása az ipari szférába rossz színben kezdte feltüntetni a dízelautókat, illetve er®s szabályozásnak tette ki az ólom- savas akkumulátor alkalmazóit. Németország megújuló energia stratégiája, és atomer®m¶veinek lebontása új kihívások elé állította a kutatókat az energia- hatékonyság innovációja terén. Azon technológiai és algoritmikus megoldások, melyek eddig másodlagos helyen t¶ntek fel, most újra napvilágra kerültek át- gondoltabb formában az új körülményekhez igazodva. Eközben a megújuló energia vihara meghódította nyugat Európát. Ennek mellékterméke és hogy közben hogy a fosszilis üzemanyagoktól megszabaduljanak (vagy legalábbis csökkentsék használatukat), egy sor új megoldandó problémára vetett napvilá- got. Az els®dleges ezek között az energiaforrások meger®södött sztochasztikus termelési és fogyasztási hajlama. Mindemellett a megnövekedett energia tárolási igény, hogy a kereslet és kínálatot szimbolizáló mérleg serpeny®i egyensúlyba kerüljenek. A másodlagos az energiatakarékosság szándéka (mely törvény- hozói és civil oldalon egyaránt az alsó, alacsony káros anyag kibocsátással járó energiát célozza meg), melynek során ezeket a megújuló forrásokat meg- növekedett számban szerelik fel parkolókba, iskolákba, családi házak tete- jére, hogy csak egy párat említsünk. Ezenfelül ezek a szerepl®k azóta meg- növekedett energia igénnyel is rendelkeznek, tovább súlyosbítva a helyzetet.
Ez két gyelemre méltó de ugyanakkor teljesen érthet® jelenséget enged mu- tatni, melyek a fogyasztók által oly könnyen hozzáférhet® energiaforrásaink a "szimptómáit" reprezentálják. Az els® a hálózati fázis feszültségek felhar- monikus torzítása, melyek fogyasztói szabályozással, és széles kör¶ aktív és passzív sz¶réssel igyekeznek orvosolni. A második a fázis feszültség vektorok aszimmetriája, vagy más szóval feszültség aszimmetria, mely a fogyasztók és termel®k kiegyensúlyozatlan hálózati eloszlásán alapulnak. Ez a fontos, ugyanakkor sokszor elhanyagolt energiamin®ségi probléma f®ként annak tudható be, hogy a kisfeszültség¶ hálózatok háztartási termel®inek és fogyasztóinak id®beli és topológiai eloszlása véletlenszer¶. Ebben a disszertációban egy új indikátor kerül bemutatásra a feszültség aszimmetria detektálására, mely ala- pul szolgálhat annak kompenzálására egyaránt, hozzájárulva az áram min®ségi kérdés ezen dimenziójához. A dolgozat els® fele ennek a jelenségnek a detek- tálására, és kompenzálására helyezi a hangsúlyt. Mindezt egy komplex teljesít- ményelektronikai struktúra segítségével, mely optimalizáción alapuló szabály- ozási algoritmussal lett ellátva, mely aszimmetrikus párhuzamos mintakeres®
algoritmust (APPS) használ. Ez a struktúra fázisonkénti áram szabályozást alkalmaz, hogy elérje a kiszabott min®ségjavulási határértéket.
A dolgozat második fele magára az áramszabályozási aspektusra fókuszál.
Ennek során egy "buck" típusú áram vezérelt egyenirányító konverter kapc- solás dierenciál egyenlet rendszerét, modell alapú prediktív szabályozásnak lett alávetve, a hatékonyság és a számítási kapacitás kritériumának jegyében.
Ez a típusú konverter nem annyira elterjedt (a "boost" típusú, a feszültség- átalakítóhoz, a feszültség-inverterhez képest), de jelent®s el®nyei vannak, mert feszültség-csökkent® kapcsolásként használható. A kapott modellt alapul véve, és a rendszert érint® korlátozásnak eleget téve, egy explicit modell alapú predik- tív szabályozó került megtervezésre. Itt modell dierencia egyenleteinek letisz- tultsága ellenére, a beágyazott bilinearitás további szabályozótervezési komp- likációkhoz vezetett volna. A tervezési nehézségek és ezáltal az egyenlet rend- szer bilinearitásának feloldására, egy egyen és váltakozó áramú oldalt szétc- satoló alkalmazás lett megvalósítva, felhasználva az AC és DC oldal id®állandó- beli különböz®ségét. Ennek eredményeképp aktív sz¶rés került implemen- tálásra az AC, míg explicit modell alapú prediktív szabályozás lett megvalósítva a DC oldalon. Az eredmények szimulációs környezetben kerültek összehason- lításra egy állapotvisszacsatoláson alapuló szabályozás teljesítményével.
X
Rezumat
La începutul deceniului trei dup trecerea de mileniu, se observ o abor- dare radical diferit a Uniunii Europene fat, de industria auto s,i energie.
Intervent,ia statelor membre în sfera industrial prin restrict,ii s,i norme din ce în ce mai stricte, a condus la o reputat,ie proast a mas,inilor diesel s,i a restrict,ionat drastic utilizarea acumulatoarelor cu plumb. Strategia Ger- maniei în domeniul energiilor regenerabile, închiderea centralelor nucleare, a impulsionat cercet rile privind ecientizarea consumului de energie. Solut,iile existente de optimizare, algoritmii existent,i dar aat,i pe plan secund au fost regândite s,i folosite cu succes în noul context. Între timp în occident se observ r spândirea furtunoas a solut,iilor de energie regenerabile. Aceste tehnologii, precum s,i dorint,a de a reduce la minim folosirea resurselor de energie fosile, a condus la un s,ir întreg de probleme noi de rezolvat. Problema primar este caracterul aleatoriu atât a surselor de product,ie precum s,i a consumatorilor de energie. Totodat se impune o capacitate ridicat de stocare a energiei, pentru a putea echilibra cererea s,i oferta în orice situat,ie. Problema secun- dar se datoreaz dorint,ei de reduce consumul de energie (atât legislativ cât s,i prin activit t,i civice se dores,te reducerea emisiilor poluante s,i folosirea energi- ilor regenerabile), astfel se monteaz aproape în orice loc posibil generatoare de energie verde, cum ar pe acoperis,ul s,colilor, caselor, a locurilor de par- care, etc. Aceste tendint,e noi de product,ie s,i consum de energie conduc la cel put,in dou fenomene importante în distribut,ia energiei electrice. Prima problem major este cont,inutul armonicilor în tensiunile de faz din ret,elele de alimentare, aceste distorsiuni armonici ind eliminat,i sau redus,i prin regle- ment ri c tre consumatori s,i aplicarea unor ltre active s,i pasive c tre ret,ea.
A doua problem este asimetria tensiunilor de faz , care se datoreaz con- sumului s,i mai nou a product,iei dezechilibrate de energie raportat la cele trei faze din ret,ea. Acest aspect important, dar neglijat de multe ori se datoreaz în principiu faptului c produc torii s,i consumatorii de joas tensiune sunt distribuit,i aleatoriu atât în timp, cât s,i topologic. În aceast tez se introduce un nou indicator pentru detectarea asimetriilor de tensiune din ret,eaua de alimentare, acesta contribuind la solut,iile de compensare a acestor asimetrii.
Prima parte a tezei abordeaz aceast problematic de detectare s,i compen- sare a asimetriilor de tensiune din ret,elele de alimentare. Problema se trateaz pe o structur complex de electronic de putere, în care s-a implementat un algoritm de reglare optimal, folosind un algoritm de c utare asimetric paralel de es,antioane(APPS). Aceast solut,ie foloses,te reglarea curent,ilor de faz pen- tru a obt,ine indiciile de performant, impuse.
Partea a doua a lucr rii abordeaz metode de reglare evoluate pentru un con- vertor electronic de putere AC-DC, tip buck cu invertor de curent. Acest tip de convertor nu este atât de r spândit (comparativ cu convertorul tip boost, ridic tor de tensiune, cu invertor de tensiune) dar are avantaje semnicative, deoarece se poate folosii ca s,i redresor coborâtor de tensiune. În tez am abor- dat modelarea matematic a convertorului s,i am studiat metode de reglare predictive bazate pe model a convertorului. Am constatat c metoda abord- abil este o reglare separat a p rt,ii AC (curent,ii de faz ) s,i reglare separat a m rimilor electrice din partea DC (tensiune s,i curent). Se pot utiliza regu- latoare separate din cauza dinamicii diferite a celor dou p rt,i din convertor, diferent,a ind de câteva ordini de m rime. Pe partea AC am implementat un ltru activ, iar pe partea DC un regulator bazat pe model explicit (Exp-MPC).
Rezultatele sunt demonstrate prin simul ri s,i am realizat o comparat,ie cu un regulator dup stare.
XII
List of contents
1 Introduction 1
2 Voltage unbalance indication 4
2.1 Motivation and aim of research . . . 4
2.2 Literature overview . . . 4
2.3 Denitions of voltage unbalance . . . 6
2.3.1 Phenomena of voltage unbalance . . . 8
2.3.2 Types of voltage deviations and norms . . . 9
2.3.3 Non standardized approximation formulas . . . 10
2.3.4 LVUR . . . 11
2.3.5 PVUR . . . 11
2.3.6 VUF and CVUF . . . 12
2.3.7 Conclusion . . . 13
2.4 Proposed geometrical indicator . . . 14
2.5 The method's novelty compared to V U F . . . 15
2.6 Summary . . . 19
3 Voltage unbalance compensation 21 3.1 Motivation and aim of research . . . 21
3.2 Literature overview . . . 21
3.3 Optimization-based voltage unbalance compensation . . . 24
3.3.1 Problem statement . . . 24
3.3.2 Elements of the problem . . . 25
3.4 Case study . . . 26
3.4.1 Formulation . . . 27
3.4.2 Numerical results . . . 32
Performance analysis . . . 32
Robustness analysis . . . 33
Measurements from a real unbalanced network . . . 33
Performance comparison of dierent unbalance indicators 35 3.5 Summary . . . 36
3.6 Notations used in the chapter . . . 38
4 Explicit model predictive control of a current source buck-type rectier 41 4.1 Motivation and aim of research . . . 41
4.2 Literature overview . . . 41
LIST OF CONTENTS
4.3 Three-phase buck-type rectiers . . . 44
4.3.1 Coordinate transformations . . . 47
Clarke transformation . . . 47
Park transformation . . . 48
4.4 Predictive control of a CSR . . . 48
4.4.1 Overview . . . 48
4.4.2 Modeling . . . 49
Mathematical modeling of the CSR . . . 49
Model simplication . . . 50
Control structure . . . 51
4.4.3 Control . . . 53
DC-side explicit model predictive control . . . 53
Active AC-side damping . . . 57
4.4.4 Modulation . . . 58
4.4.5 Discussion . . . 61
Lyapunov stability . . . 62
Computational eort . . . 62
Horizon performance . . . 64
Simulation results . . . 64
Comparison with a state feedback control . . . 64
4.5 Conclusion . . . 66
4.6 Notations used in the chapter . . . 68
5 Thesis and Summary 70 5.1 Summary . . . 70
5.2 New scientic results . . . 71
5.3 Applications and future work . . . 74
5.3.1 Geometrical voltage unbalance norm . . . 74
5.3.2 Voltage unbalance reducing inverter structure . . . 75
5.3.3 Explicit model predictive control for buck-type rectier . 76 5.4 Network substitute model . . . 77
5.5 Power electronic components for current control . . . 78
5.5.1 Galvanic decoupled bi-directional DC-DC converters . . 79
5.5.2 Current source inverters . . . 80
5.5.3 Implemented asymmetrical inverter topology . . . 82
PV energy source . . . 83
Energy storage . . . 83
Intermediate buer . . . 84
5.6 Asynchronous parallel pattern search . . . 85
5.7 Model based predictive control . . . 87
5.7.1 Quadratic optimization and predictive control . . . 87
Receiding horizon control . . . 95
Stability of MPC . . . 97
5.8 Geometric approach to multi parametric programming . . . 98
5.8.1 Storage of critical regions . . . 102
5.9 Notations used in the appendix . . . 104 XIV
LIST OF CONTENTS 5.10 Abbrevations . . . 105
Chapter 1 Introduction
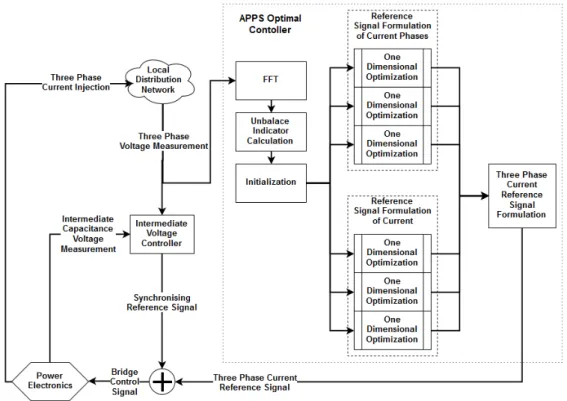
Growth of distributed generation from renewable energy sources and the nature of the electrical power grid initiated a trend to alter from a passive network to an active one. So called smart grids have the ability to provide much more in depth observable measurement results of their customers, grid operators and energy traders alike. Through voltage and current measure- ments, the habits of each actor (household, station, or industrial- commercial facility) can be easily mapped and taken into account. Moreover, the poten- tial failure could be indicated and preemptively acted upon, before irreversible malfunction, signicant amount of wear, or generally, the eciency of energy consuming actor's power electric consumer's diminishes. In most cases, only smart metering is present, whilst central control and measurement is not an option.
In this new environment, the importance and diculty of maintenance and operational stability and cost eective control of the distribution system are increasing together. With this in mind local solutions are the most convenient solutions, and as opposed to this expectation most of a household's possible renewable sources and loads are unevenly distributed, without mindful control over single phase power converters. Some of these could represent an un- evenly high power consumption, or worse a locally signicant energy source in times where it's most unnecessary, especially outside peak zones of consump- tion. The situation is further exacerbated by the stochastic on/o switching of the dierent types of loads. This cause stochastic disturbing unbalance in the load currents which cases unbalanced load of the low voltage transformer, and amplitude- and phase unbalance in the voltage phasor trough the serial impedance of the low voltage transportation line wires and connecting devices cables.
If we observe the opposite side, ideal generators supply symmetrical three- phase sinusoidal positive sequence voltages, which are balanced in terms of their amplitudes phase dierences at a single frequency. With this in mind voltage (as such consumption- and production-) unbalance occurs on the net- work. The terminology of unbalance can be divided into amplitude unbalance, phase dierence unbalance, and unbalanced harmonic disturbance. The occur- rence of at least one of these features is enough for a distribution network to
CHAPTER 1. INTRODUCTION become unbalanced.
Many countries have changed their regulating laws about power supply to al- low for grid-tie inverter systems to provide spare power from renewable sources to local low voltage grids.The unbalance of the grid is further increased by us- ing single phase grid tie inverter systems in the size of typical small household power plants (1 - 5 kVA) and the produced electrical power originating from renewable power source (wind and solar) also admits stochastic behavior. This unbalance yields to a suboptimal operation of low voltage three phase trans- formers and machines to generate undesirable additional yield loss and increase in the probability of malfunction of the low voltage energy transportation sys- tem's components, or the eective current unbalance could cause additional power loss of the transportation line resistances or in the end complete shut- down.
To mitigate or avoid such situations an approach is required, where the system where aforementioned phenomena occurs is an optimization problem. However to formulate an optimization problem, many things should be established to formulate it properly. Most importantly, a cost function should be established which can be served as a measure of goodness for solving the question. For instance, if voltage unbalance would be eliminated, than the correct indicator of unbalance should serve as basis, moreover the deviation from the optimum could be quadratic.
Such tasks can not be achieved without proper instrumentation. To be able to apply control, where he voltage levels are designated, and the end user has no direct control (only the plant or transformer level has such), deviations can be addressed, and current control can be used as actuation. This way a control structure can be imagined for a power electric converter, where every step should count towards the optimum state, with respect to the energy (or control reserves), wear of the device (sub components, namely gates have nite switching capabilities), and safety constraints ( designated level of current and voltage should not trespass a given hard constraint for the sake of malfunction avoidance, and soft constraint for the sake of reducing wear). Additionally it should not be forgotten, that with all the above, the device should operate in the domains of kHz or above, and it should be run on a cheap device, like an embedded micro-controller chip or digital signal processor (DSP). With all this in mind a power electric structure can be designed to fulll the high stan- dards of today's requirements. The problem is, conventional controllers can not achieve al this requirements. The methodology based on optimal control, was originally designed for highly complex, and safety critical systems, with huge amount of inputs and outputs, power plants, and chemical- or renery plants. These systems though, have an incomparably lower time constant, which renders conventional model based predictive controllers useless in the domain of power electronics.
To marry the two approaches together, a solution came up from the automotive industry. A car is also a highly safety critical multiple-input, multiple-output (MIMO) system with obvious constraints, in increasingly changing environ- ment. The main point is, to map the state and input space of the environment,
2
signicantly reducing calculation demands based on the system complexity.
Where constraints are present, nite states can be dened, either by hand (e.g. state machines) or by advanced mapping algorithms, and then in every state of operation, a relatively simple (linear if possible) rule where one state of the system dynamics could be substituted, then to make sure stepping on to the next most applicable rule can be achieved very fast. This way, by choos- ing the resolution of the mapping correctly (too ne resolution gives too high processing requirements, too low gives suboptimal dynamics), the predictive control approach can be applied in both worlds.
Chapter 2
Voltage unbalance indication
2.1 Motivation and aim of research
The motivation of the research was that the evolution of voltage unbalance as a general concept had it's stages through the years coming up with more and more sophisticated variations, suspecting that the topic of voltage qual- ity indicator development may not be a settled debate. After examining the various approaches and the latest solution in use the voltage unbalance factor (V U F), it can be seen that more and more factors are taken into account, with V U F relying on the negative and positive symmetrical components in the end. However, detaching from the great utility symmetrical components hold, and examining the calculation from purely geometrical perspective, non of the indicators are hard coded to achieve a complete overlap to the ideal state of the voltage phasor it is aimed for. As such the aim is to come up and validate the utility of a voltage unbalance indicator, that takes as much infor- mation into account as possible (without the subharmonic components and as such harmonic distortion in scope), and still hold the value that the previous approaches especiallyV U F made, in terms of utility.
2.2 Literature overview
Single phase power injections to the grid are mainly generated by domestic photovoltaic-(PV) and wind power plants. For o-grid, sometimes more com- plex solutions integrating diesel generators, PV and wind generators. Such as proposed, in [1], and [2], where presented the economical aspects of a PV system. The economic results are strongly inuenced by the annual average insolation value, which encourages the areas most exposed to the sun and the southern areas. The consumption of consumers is not critically important, but the design principle used has as signicant eect on the maximization of the performance of PV plants. In the paper [3] it is worth noticing, that autonomous photovoltaic systems are strongly responsible of their reactive en- ergy requirements. To support photovoltaic systems with sucient battery banks one should be able to establish that their reactive energy requirement share fairly compensated by the corresponding energy yield. Additionally, in
2.2. LITERATURE OVERVIEW [4] the author emphasizes that PV systems are increasingly being deployed in all over the world, and this is the source of a wide range of power quality prob- lems. With a view on consistently measuring and assessing the power quality characteristics of PV systems, they had presented an in-depth overview and discussion of this topic.
The study [5] explored implementation issues of electric vehicle battery packs.
They suggest that high voltage battery packs with large format cells has ad- vantages in assembly, thermal management, monitoring and control, services and maintenance. On the other hand, quality, reliability and limited specic energy of large format cells are obstacles need to overcome. Solving these problems will further aect the cost, performance, reliability and safety of the electric vehicles. Smart energy systems in specially in urban areas are dis- cussed in [6] where a design methodology has been suggested.
A numerical study was done by [7] on the distribution network faults and the ef- fects on unbalance factor and the matrix representation of network impedances with the symmetrical component and phase component method. The study concluded, that during fault voltages and currents are greatly affected by the system unbalance and the fault impedance. The increase of the system un- balance causes an increase of the during-fault voltages and currents variation.
The increase of the fault impedance reduces the fault current and therefore the effect of the system unbalance on during fault voltages and current diminishes.
For each system there is a characteristic value of fault impedance that is related to the load impedances. Larger fault impedances values produce fault currents similar to nominal load currents and therefore the effect of these faults in terms of during-fault voltages and currents cannot be differentiate from nominal op- eration conditions. Variation of power quality in non-faulty scenarios leads to thermal transients in electrical machines. This problem can be especially im- portant in the case of low-power machines, because they have shorter time constants than high-power ones. The rate of thermal responses of a machine also signicantly depends on the type of power quality disturbances. Voltage unbalance can cause machine overheating within a mere few minutes. Fur- thermore, uctuating unbalance could cause an extraordinary rise in windings temperature and additional thermo-mechanical stress. Consequently, voltage unbalance is found to be more harmful to induction motors than the results from previous work [8]. Additionally beside the heat factor, voltage unbalance can cause increased reactive power [9], various copper loss [10] torque pulsa- tion in electric motors [11]. The authors of [12] were discussing the eects of unbalanced voltage on a three-phase induction motor, one has to consider not only negative-sequence voltage but also the positive-sequence voltage. With the same voltage unbalance factor, the status of voltage unbalance could be judged by the magnitude of positive sequence voltage. Also the eect of voltage unbalance has been studied on three-phase four-wire distribution networks for dierent control strategies for three-phase inverter-connected distributed gen- eration units on voltage unbalance in distribution networks [13]. Here the negative-sequence component and the zero sequence component were studied where unbalance conditions could lower stability margin and increasing the
5
CHAPTER 2. VOLTAGE UNBALANCE INDICATION
power losses. On the other hand, the adaptive coordination of distribution systems included distributed generation is also an emerging problem as it was discussed by [14]. A small voltage unbalance might lead to a signicant current unbalance because of low negative sequence impedance as highlighted in [15].
As such a previous work of [16] a complex control unit has been proposed that is capable of lowering extant harmonic distortion. In the work of [17]
the eect of a small domestic (photovoltaic) power plant on the power qual- ity, mainly the total harmonic distortion has been examined. The aim of this work is to examine and compensate three phase voltage asymmetry of the electrical network based on the extended simulation model proposed by [16].
Further control methods were applied for the solution for balancing of the most sensitive with regard to electric energy quality part of power system in [18], minimizing the active power losses, stabilization of three-phase voltages, enhancement of asynchronous machine performance stability and reduction of errors occurring in power consumption measuring circuits.
In many articles the authors presents a dierent viewpoint of calculating un- balance on the network. [19] showed to assess the harmonic distortion and the unbalance introduced by the dierent loads connected to the same point of common coupling have been applied to an experimental distribution network.
By [20] the focus was to bring out the ambiguity that crops up when we refer to a particular value of voltage unbalance that exists in the system. By mak- ing use of the complex nature of voltage unbalance, the voltage combinations that lead to the calculation of complex voltage unbalance factor could be nar- rowed down to a great extent. A fast and accurate algorithm for calculating unbalance has been presented by [21]. The magnitudes of zero, positive, and negative sequences are obtained through simple algebraic equations based on the geometric gure, which is also called as 4 and 8 geometric partitions. Also a three-phase optimal power ow calculation methodology has been presented by [22], that is suitable for unbalanced power systems. The optimal algorithm uses the primal-dual interior point method as an optimization tool in associ- ation with the three-phase current injection method in rectangular coordinates.
2.3 Denitions of voltage unbalance
In a symmetric three-phase power supply system, three conductors each carry an alternating current of the same frequency and voltage amplitude rel- ative to a common reference but with a phase dierence of one third of a cycle between each. The common reference is usually connected to ground and often to a current-carrying conductor called the neutral. Due to the phase dier- ence, the voltage on any conductor reaches its peak at one third of a cycle after one of the other conductors and one third of a cycle before the remaining conductor. This phase delay gives constant power transfer to a balanced linear load.
In general symmetric three-phase systems described, are simply referred to as three-phase systems because, although it is possible to design and implement
2.3. DEFINITIONS OF VOLTAGE UNBALANCE asymmetric three-phase power systems (i.e., with unequal voltages or phase shifts), they are not used in practice because they lack the most important advantages compared to the symmetric. In a three-phase system feeding a balanced and linear load, the sum of the instantaneous currents of the three conductors is zero. In other words, the current in each conductor is equal in magnitude to the sum of the currents in the other two, but with the opposite sign. The return path for the current in any phase conductor is the other two phase conductors.
Constant power transfer and cancelling phase currents would in theory be pos- sible with any number (greater than one) of phases, maintaining the capacity- to-conductor material ratio that is twice that of single-phase power. However, two-phase power results in a less smooth (pulsating) torque in a generator or motor (making smooth power transfer a challenge), and more than three phases complicates infrastructure unnecessarily.
Three-phase systems may also have a fourth wire, particularly in low-voltage distribution. This is the neutral wire. The neutral allows three separate single- phase supplies to be provided at a constant voltage and is commonly used for supplying groups of domestic properties which are each single-phase loads. The connections are arranged so that, as far as possible in each group, equal power is drawn from each phase. Further up the distribution system, the currents are usually well balanced. Transformers may be wired in a way that they have a four-wire secondary but a three-wire primary while allowing unbalanced loads and the associated secondary-side neutral currents [23].
The voltage quality is described by the European standard EN-50160, which denes, and describes the main characteristics of the voltage at the network users supply terminals (or point of connection) in public networks. The most important factors are listed here:
Frequency
50 Hz ± 1 % during 99.5 % of the year.
50 Hz +4 % or -6% during 100 % of the year.
Supply voltage variations
During each period of one week 95 % of the 1 min mean r.m.s.
values of the supply voltage shall be within the range of ± 10 %.
all 10 min average r.m.s. values of the supply voltage shall be within the range of +10 or -15 %.
Rabid voltage change
Only icker severity is dened. For single rapid voltage changes, an indication is given that the voltage change should not exceed 5 % of the nominal voltage.
Flicker
7
CHAPTER 2. VOLTAGE UNBALANCE INDICATION
During each period of one week, the long term icker severity caused by voltage uctuations should be less than or equal to 1 for 95 % of the time.
Unbalance
During each period of one week, 95 % of the 10 min r.m.s. value of negative fundamental phase sequence component of the supply voltage shall be within the range of 0 and 2 % of the positive fun- damental sequence as it shall be displayed in (2.9).
Harmonics
During each period of one week, 95 % of the 10 min r.m.s. value of each individual harmonic voltage shall be less or equal than 5 % of the 3rd harmonic, 6 % of the 5th, and 2 % of the 2nd and so forth (table is included in [24]).
The THD (total harmonic distortion of the supply voltage (includ- ing all harmonics until the order of 40 shall be less or equal than 8
%.)
For more information see the standard EN-50160, and [24].
In this dissertation form the listed voltage quality problems only the voltage unbalance and it's indicators shall be examined.
2.3.1 Phenomena of voltage unbalance
In a domestic network, three-phase electric power systems have at least three conductors carrying alternating voltages that are oset in time by one- third of the period. A three-phase system may be arranged in delta or star.
A star system allows the use of two dierent voltages from all three phases, such as a 230/400 V system which provides 230 V between the neutral (center hub) and any one of the phases, and 400 V across any two phases displayed on Fig.(2.1a). The denition is the following:
Va = V sin(θ)ˆ Vb = V sin(θˆ + 43π) Vc = V sin(θˆ + 23π),
(2.1)
where Va, Vb, Vc are the phase voltage vectors, Vˆ is the voltage peak, and θ is the phase angle.
First, if a quality indicator is chosen and used to describe a system, in this case the three phase low voltage network, the value is used, is advised to be a norm. As such it needs to comply the mathematical definition of a norm.
A given vector space V over a eldF of real (or complex) numbers, a norm on V is a non-negative function of p:V → R with the following properties:
1. Triangle inequality: p(ϕ1+ϕ2)≤p(ϕ1) +p(ϕ2),
2.3. DEFINITIONS OF VOLTAGE UNBALANCE 2. Absolute scalability: p(aϕ) = |a|p(ϕ),
3. Positive denite: if p(ϕ) = 0 then ϕ= 0, whereϕ is a chosen norm candidate.
Secondly, the physical property needs to be identied. Voltage unbalance is a phenomena where the three phase voltages dier in amplitude normal 120 de- gree phase relationship shown in Fig.(2.1b). In most cases both are happening at the same time. This includes unequal voltage magnitudes at the fundamen- tal frequency, either under, or over voltage, at the fundamental phase angle deviation.
(a) Three phase sine wave of network voltage.(b) The three phase voltage phasor whith IdealandReal voltage vectors.
This is observed as a frequently cited power quality issue in low-voltage domestic distribution networks and in systems that supply large single phase loads distributed unevenly among the phases. Eects of voltage unbalance are complex, but can be categorized as structural or functional. The former refers to the asymmetry in the three-phase impedances of transmission lines, cables, transformers, etc. It occurs because it is neither economical nor necessary to maintain distribution system with perfectly symmetrical impedances. The latter refers to uneven distribution of power consumption over the three phases.
Although the term voltage unbalance is unambiguous, the root phenomenon may be various as well as the standard norms used to measure unbalance.
In this section a detailed explanation is presented about the types of currently used method for indication.
2.3.2 Types of voltage deviations and norms
Voltage unbalance is not a straightforward term. To understand the con- cept, unbalance is when on a given frequency (mostly fundamental frequency) voltage vectors (phase or line depending on the denition) deviating from the ideal in terms of length or angle. The rst fall in to the category of unbalance,
9
CHAPTER 2. VOLTAGE UNBALANCE INDICATION
namely any kind of phase deviations, and unbalanced amplitude deviations, and balanced amplitude deviations, like under-voltage. There are many dier- ent technological causes with more or less practical importance. The following conditions are examined and tested in the sequel:
Single phase under-voltage unbalance If there is a single phase uncom- pensated overload in the system, the voltage in the overloaded phase will be lower than the other two.
Two phase under-voltage unbalance Two of the three phases are over- loaded without compensation, the two overloaded phases will have higher voltage drop than the third phase.
Balanced three phase under-voltage The loads of all three phases are overloaded in a balanced manner.
Unbalanced single phase angle If the three phase voltage amplitudes are balanced but the relative angles between them (ideally it should be equal to ±120 degree). It is assumed, that Va would be the reference. If one of the other two phase angles is deected, unequal displacement.
Unbalanced two phase angles displacement Similar to the single phase angle unbalance, if the other two phase angles are both deected, then unequal angle displacement in two phase angles occurs.
An indicator of the voltage unbalance is supposed to measure the extent of unbalance but it is not expected to classify between the above types.
2.3.3 Non standardized approximation formulas
Up to now, the following denitions have not been adopted by any stan- dard or rule to indicate the degree of voltage unbalance, but used by various manufacturers. Firstly based on [25] recommended by the CIGRE (Interna- tional Council on Large Electric Systems, in French: Conseil International des Grands Réseaux Électriques), the voltage unbalance is determined with:
V U F actor =
v u u u t1−
v u ut3−6 V
4 ab+V4
bc+V4 ca
(Vab2+V2 bc+V2
ca)2
1+
v u ut3−6 V
4 ab+V4
bc+V4 ca
(Vab2+V2 bc+V2
ca)2
(2.2)
where, {Vab, Vbc, Vca} are the line-to-line voltages. Note, that the CIRGE variant has no distinct notation, as such it would be indicated as V U F actor in this thesis. Moreover, the author of [26] recommends two more variants, based on manufacturer recommended "standards":
V U = 82·
√
(Vab−Vavgline)2+(Vbc−Vavgline)2+(Vca−Vavgline)2
Vavgline ×100 (2.3)
2.3. DEFINITIONS OF VOLTAGE UNBALANCE
V U R = max(|Vab−VbcV|,|Vbc−Vca|,|Vca−Vab|)
avgline ×100, (2.4)
where the mean of line voltages is noted by Vavgline = Vab+V3bc+Vca. This formulas were created with the intention to avoid the use of the complex al- gebra in symmetrical components and give a good approximation of the later described V U F standard. With the indicator of (2.3), and as well as (2.4).
It is worth noticing, that only the voltage magnitude unbalance is reected, completely ignoring Fortescue's method of symmetrical components [27] (shall presented later in the thesis), which considers negative sequence components as harmful on electric equipment and yield. Later it will be shown that other methods try to push the same methodology, until the currently used norm (V U F) is used.
2.3.4 LVUR
One of the rst voltage unbalance in percent is dened by the National Electrical Manufacturers Association (NEMA) [28] is dened as the ratio of the maximum voltage deviation from the average line voltage magnitude to the average line-voltage magnitude.
LV U R = max(|Vab−Vavgline|,|Vbc−Vavgline|,|Vca−Vavgline|)
Vavgline ×100 (2.5)
The LVUR assumes that the average voltage is always equal to the rated value, which is 480 volts for the US three-phase systems, and it works only with magnitudes. Phase angles are not considered in this denition.
2.3.5 PVUR
The next phase voltage unbalance in percent described in IEEE standard 141.[29] (derived from [30]), isP V U RIEEE−141. It is dened as the ratio of the maximum voltage deviation of phase voltages from the average phase-voltage magnitude to the average phase voltage magnitude. In various elds, LVUR and P V U RIEEE−141 are commonly used to estimate the degree of voltage un- balance due to simplicity of calculation. The two unbalance factors mentioned above cannot completely reect system voltage unbalance eects, such as the phase displacements of unbalanced voltages.
P V U RIEEE−141 = max(|Va−Vavgphase|,|Vb−Vavgphase|,|Vc−Vavgphase|)
Vavgphase ×100, (2.6)
where the voltages {Va, Vb, Vc} denotes the phase-to-neutral voltages, and Vavgphase = Va+V3b+Vc. The second variant is, P V U RIEEE−936, mentioned in [31]
is dened as the ratio of the dierence between the highest and the lowest phase-voltage magnitude to the average phase-voltage magnitude. Therefore, the numerical values of voltage balance quantied byP V U RIEEE−936 are gen- erally larger than those ofP V U RIEEE−141 and LVUR.
11
CHAPTER 2. VOLTAGE UNBALANCE INDICATION
P V U RIEEE−936 = max(|Va|,|Vb|,|VVc|)−min(|Va|,|Vb|,|Vc|)
avgphase ×100, (2.7)
The number of possible combinations of three phase or line voltages that satisfy the denitions of voltage unbalance mentioned above will become in- nite as only the magnitudes of voltages are considered.
2.3.6 VUF and CVUF
The voltage unbalance factor (V U F) was dened by the International Elec- trotechnical Commission [32], [33]. From the theorem of symmetrical compo- nents [27], voltage unbalance can be considered as a phenomenon that positive sequence voltage (Vp) is disturbed by negative (Vn) and zero-sequence (V0) voltages:
V0 Vp Vn
= 13
1 1 1 1 υ υ2 1 υ2 υ
·
Va Vb Vc
, (2.8)
Whereυ =e2jπ/3 is the Fortesque operator. From that the formula ofV U F can be expressed as:
V U F =
Vn
Vp
×100, (2.9)
Figure 2.2: Simplied graphical display of symmetrical components.
This norm is currently in use world wide for voltage unbalance indication.
The main focus in on the negative sequence component Vn, on which many studies attributes importance of the cause of negative eects the voltage un- balance causes.
As such, three-phase electric loads without path through the neutral, negative- sequence voltage is the primary cause of voltage unbalance. Normally, positive- sequence component of three-phase voltages is very close to rated value. If
2.3. DEFINITIONS OF VOLTAGE UNBALANCE expressed in per-unit quantities, the positive-sequence voltage will be very close to1.0p.u., and the corresponding negative-sequence voltage will be very close to the V U F. Thus, the V U F can indeed be considered as the negative- sequence component in per-unit. This explains the advantage of using the VUF as an index for analyzing the eects of voltage unbalance considering the phase deviations. An extension of the VUF is the complex voltage unbalance factor (CV U F) that is dened by the ratio of the negative- sequence voltage phasor to the positive-sequence voltage phasor studied in [34], and [35]. The CVUF is a complex quantity having the magnitude and the angle. Although the CVUF has not yet been widely used by practicing engineers, it has been proposed in some studies (e.g., [36], [37], [38]) due to its richness of information on unbalance. The formula of CV U F is similar to V U F:
kv = VVn
p =kv·ejθv =kv̸ θv, (2.10) where kv is the magnitude and θv is the angle of CV U F.
It can be observed, that the previously mentioned norms (2.2), (2.3), (2.4), (2.5), (2.6), (2.7), and (2.9) indicate dierent values for a single case with various correlations. The rst two standard indicators, P V U RIEEE−936 and P V U RIEEE−141, ignore the±120 degree phase dierence unbalance and only take the amplitudes into account. Additionaly, the zero-sequence components never present in the line-to-tine voltages regardless of the level of unbalance, only phase-to-neutral voltages. It has been proven, that these components are unelectable in some cases like bridge control of converters [39], or synchronous machine diagnosis [40].
The actual state of the art denition in use, V U F, is sensitive to the phase dierence unbalance. LastlyCV U F considers also phase and magnitude of the voltage unbalance, but the two units (kv, and θv) are hard to merge together as a singular optimization cost. To be able to employ CV U F as a success- fully the weighting factor of the ratio of negative and positive symmetrical component's amplitude and phase shall be considered, which is non-trivial, and situation dependent (different network failure modes can be targeted with different weighting factors). Moreover, these denitions ignore zero sequence components and harmonic distortion that are always present in three-phase four-wire systems [15] hence,CV U F not in the scope of this thesis.
2.3.7 Conclusion
As it was shown, establishing a straight forward denition for measuring a three phase network's voltage unbalance was not an easy task, and still not settled. With new attempts to come up with a more accurate and wholesome method e.g. CV U F, which paves the path for further research potential.
However, going with the with the initial criteria of this thesis's level of analysis:
1. all deviations from the ideal voltage phasor in terms of amplitude and phase are causing a decline of network quality,
13
CHAPTER 2. VOLTAGE UNBALANCE INDICATION
2. the indicator shall serve as a cost function candidate, with fullling the denition of a norm.
Before the standardisation the actors of the industry came up with methods, that suited they point of view of network quality with V U F actor, calculating an approximate double square mean of amplitude dierences, and V U with a normalised square mean and V U R indicating the maximum linear amplitude deviation, neglecting all the other properties.
Later on with the need for standardisation and consensus, more sophisticated attempts were made, withLV U R, andP V U Ras the direct successor ofV U R, with P V U RIEEE−936 the most advanced one, sill indicating the largest am- plitude deviation from the ideal, neglecting not considering other amplitude deviations as well as completely neglecting phase deviations. Finally after a complete rework, V U R became the standardised indicator as of today, em- ploying the symmetrical components theorem a.k.a. the Fortescue method [27]. With this the negative sequence was identied as the main contributor of voltage unbalance caused failures from power factor distortions to increased network and machine losses. As suchV U F approach with giving the ration of negative and positive symmetrical components as well as having one scalable value for control makes V U F an excellent candidate. Unfortunately, the sim- plicity ofV U F comes with a downside, meaning the zero sequence components are neglected, as such making the indicator blind to balanced undervoltages, and dips. Finally the newest candidate the CV U F attempts to further rene what V U F may omitted, with separating the angles of voltages into a second value, giving a complex result. Unfortunately this violates the second initial criteria such as since the value is complex and there is no trivial weighting ratio, CV U F falls out of the scope of analysis as a cost function. This begs the question, how could voltage unbalance be measured loss-less, but result- ing one (conveniently square-like) value, easily applicable for an optimization algorithm.
2.4 Proposed geometrical indicator
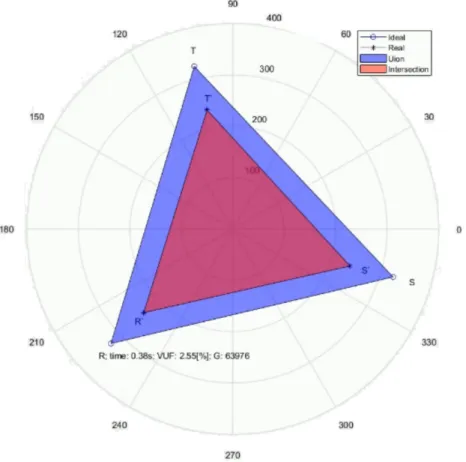
Hence it can be stated that every dierence between the ideal and the measured voltage in both amplitude phase and sub-harmonics is caused by a form of voltage deviation from the ideal. The problem can also be investigated from a geometrical point of view as it is depicted in Figure (2.3). The three- phase voltage system's phasor diagram contains three phase-to-neutral voltage vectors which can be regarded as the points of a triangle (similarly, the three line-to-line vectors can play the role of the edges of the triangle). The two triangles (i.e. the ideal and the actual ones) always intersect except from very extreme and physically meaningless cases. The area where the two triangles do not cover each other (i.e. the dierence of their union and intersection) can be used as a norm of voltage quality. In fact it is computationally more demanding compared to the previous methods, but takes every deviation into consideration [P1], [P2]. This way the error is given by (2.11).
2.5. THE METHOD'S NOVELTY COMPARED TO V U F
G = Area of (△Ideal∪ △Real− △Ideal∩ △Real), (2.11)
△Ideal indicates the triangle spanned by the ideal voltage vectors and△Real the triangle of real voltage vectors. Dierence of the ideal and the real triangle's union and intersection denes the normG. Basically, the algorithm calculates the symmetrical dierence of the triangles, stretched from three phase ideal and real voltage vectors. This approach fullls the norm definition as well, displayed in section (2.3.1).
0 30 60
120 90
150
180
210
240 270 300
330 0 100 200 300
Ideal voltage phasor Real voltage phasor
Figure 2.3: The triangles spanned by the ideal and the real peak voltage phasors.
The extent of voltage deviation on the network can be measured by the sum of areas where the two triangles are not overlapping.
2.5 The method's novelty compared to V U F
When using a new norm for calculation and cost function it is reason- able to test it's viability compared to the prevalent or regulated method, the voltage unbalance factor (V U F) dened by the International Electrotechnical Commission, as discussed in section 2.3.6. In this case the geometrical norm's utility (2.11) against the currently used V U F (2.9) shall be examined.
The geometrical norm was validated experimentally, by investigating the cor- relation between the regulated and geometrical norms subjected to random, uniformly distributed unbalance on the voltage vector amplitude and phase values with20 V amplitude and 1/300·π rad phase variance (Fig. (2.4), and Fig. (2.5)).
Although there is correlation between the two norm values in the general case, but for some situations the V U F indicates low, while geometrical norm still indicates high value.
15
CHAPTER 2. VOLTAGE UNBALANCE INDICATION
Figure 2.4: Correlation between the geometrical voltage unbalance indicatorGand the regulated voltage unbalance indicatorV U F using 1000 samples. In every itera- tion each three phase voltage vector's amplitude and phase values changed randomly, according to uniform distributions with±20V amplitude and ±13π·10−2 rad phase variance. The dashed line indicates the axis across the main correlation cloud. It can be seen, that the geometric norm contains more information than V U F form the right of the dashed line. The four asymmetry cases of Figure (2.6) are denoted by black symbols on the picture. It is apparent, that in case (c), and (d) the G norm holds additional information than the V U F.
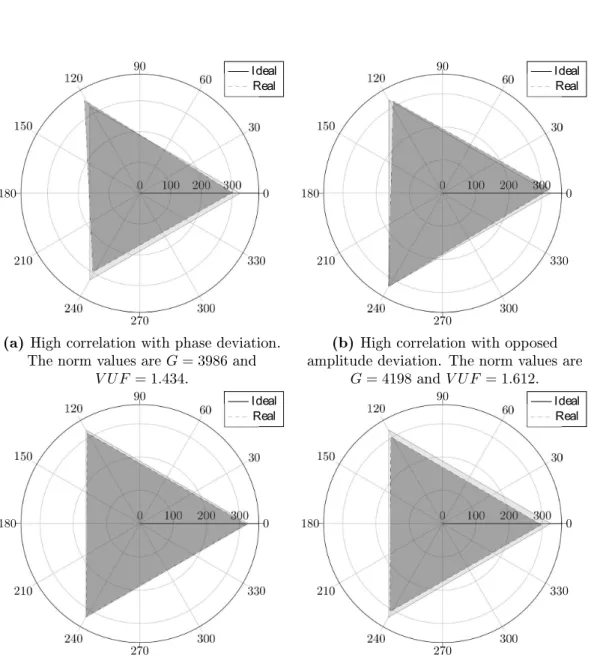
On Figure (2.6a) dominant phase deviation can be observed, while Figure (2.6b) shows amplitude deviation but with opposite direction. When there is such deviation on the grid both indicators present almost identical results. On (2.6c) there is still an observable unbalance (two phase deviate stronger than the third in terms of amplitude), but the correlation is signicantly lower. In the last case in the lowest correlation area, amplitude deviation is present, but the deviation direction is identical on all phases (balanced over-voltage or under-voltage, can be observed on Figure (2.6d)), still, the V U F indicates very low values. In this case other methods are utilised in parallel in terms of network diagnostics to detect the under-voltage phenomena.[41].
To clarify this, the V U F's calculation method needs to be investigated (see (2.9)). The symmetrical component mutual impedance matrix on a three phase connection point is given by (2.12),
2.5. THE METHOD'S NOVELTY COMPARED TO V U F
Figure 2.5: Correlation between the regulated unbalance indicator and the fraction of geometrical and regulated indicator. It can be seen that there is a functional connection between the two values.
Zs = 13
1 1 1 1 υ υ2 1 υ2 υ
·
Zaa Zab Zac Zba Zbb Zbc Zca Zcb Zcc
·
1 1 1
1 υ2 υ 1 υυ2
=
=
Z00 Z01 Z02 Z10 Z11 Z12 Z20 Z21 Z22
,
(2.12)
whereZsis the symmetrical component mutual impedance matrix, andυ = ej23π. If there are both negative and zero sequence symmetrical components present on the network, the dominant part of the voltage drop's negative and zero sequence can be calculated as follows (2.13).
∆U2 ≈ Z21I1+Z22I2
∆U0 ≈ Z01I1+Z00I0, (2.13)
∆U0,∆U1, ∆U2 are the voltage drop's zero positive and negative sequence components, I0, I1, I2 are the current's drop's zero positive and negative se- quence components, and Z00, Z01, Z21, Z22 are mutual impedances, respec- tively. If there is only positive and negative sequence present, then the right hand side's second term is zero. As such, the indication of negative and zero sequence present the network calculates (2.14):
m21 = | ZZ21
11 | ×100 m01 = | ZZ01
11 | ×100, (2.14) where m21 is the negative sequence factor which is identical to the V U F, and m01 is the zero sequence factor.
As such from (2.14), it can be derived, that the geometrical method shown in (2.11), compared to the V U F shown in (2.9) incorporates the zero sequence
17
CHAPTER 2. VOLTAGE UNBALANCE INDICATION
0 30 60 90
120
150
180
210
240
270
300
330 0 100 200 300
I deal Real
(a) High correlation with phase deviation.
The norm values areG= 3986and V U F = 1.434.
0 30 60 90
120
150
180
210
240
270
300 330 0 100 200 300
I deal Real
(b) High correlation with opposed amplitude deviation. The norm values are
G= 4198andV U F = 1.612.
0 30 60 90
120
150
180
210
240
270
300
330 0 100 200 300
I deal Real
(c) Low correlation with opposed amplitude deviation. The norm values are G = 9322 andV U F = 0.5198.
0 30 60 90
120
150
180
210
240
270
300 330 0 100 200 300
I deal Real
(d) Low correlation with uniform voltage drop. The norm values areG= 6280and
V U F = 0.156.
Figure 2.6: Four distinct cases of voltage triangles examining correlation between the regularV U F and geometricalGmethod.
2.6. SUMMARY Table 2.1: Comparison of dierent voltage unbalance indicators, according to the scope dened in section 2.3.7.
Indicating
Capabilities Amplitude
deviation only Phase
deviation only Balanced three
phase under-voltage Trivial cost candidate
V U F actor Yes No No Yes
V U Yes No No Yes
V U R Yes No No Yes
LV U R Yes No No Yes
P V U RIEEE−141 Yes No No Yes
P V U RIEEE−936 Yes No No Yes
V U F Yes Yes No Yes
CV U F Yes Yes No No
G Yes Yes Yes Yes
factor as well. This can be observed on Figure (2.4), with the dashed line across the main correlation cloud on the scatterplot. The perpendicular dislocation from the dashed line to the right is proportional to the uniform amplitude deviation (case (d) on Figure (2.6)). Since the geometrical method calculates with error surfaces, the approximation would be the V U F's value (including the zero sequence) squared. To understand the context, the zero sequence deviation (can be interpreted as uniform amplitude deviation from the ideal phasor) can be an indication of undervoltage, or voltage dip, which are com- mon network errors.
As such comparing the results from Figure (2.4), as well as the observations from (2.12)-(2.14) the best cost function candidate as well as the most promis- ing unbalance indicator would be Gaccording to the initial criteria laid down in section 2.3.7. A comprehensive overview the can be observed in Table (2.1).
This comes from G's property of calculating the deviations based on the symmetrical dierence of the voltage phasors, and since surfaces instead of numerical dierences are considered the value follows a square-value nature.
It is worth to keep in mind, that the definition ofV U F can not be applied to the proposed method, since it was designed around the percentage difference of positive and negative symmetrical components, but this allows to establish a square-like cost function to minimize with an optimizer employed in an active, network connected lter.
2.6 Summary
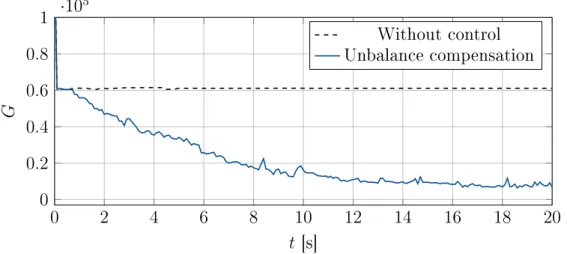
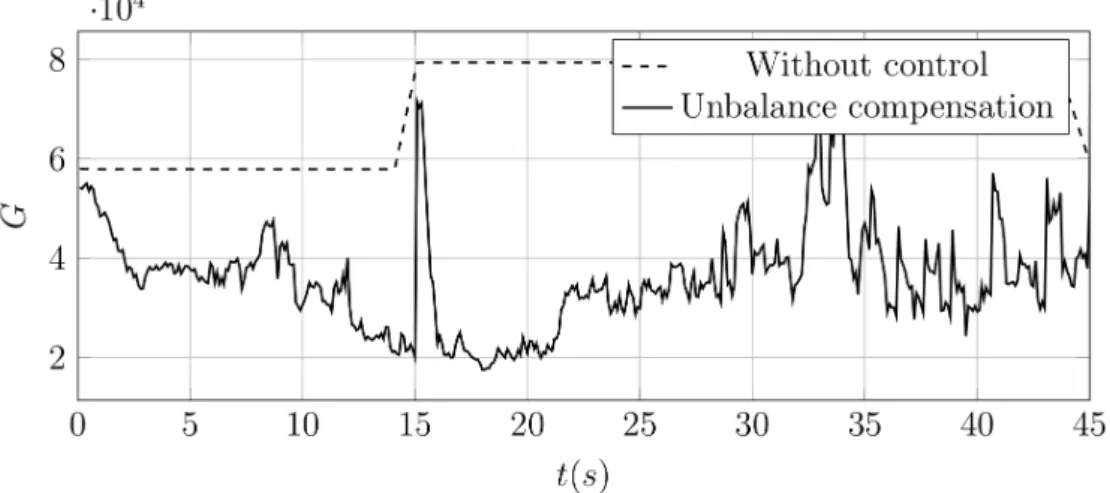
At the previously described balanced over- or under-voltage case the posi- tive sequence value is dominant, so the regular indicator will take considerably lower value. In other words, aside from indicating voltage unbalance, the ge- ometrical method incorporates the balanced deviations as well. In a control
19
CHAPTER 2. VOLTAGE UNBALANCE INDICATION
design perspective, a general case, where notably highly unbalance values may appear, using V U F as cost function could introduce hidden errors in control due error cancellation. Additionally the geometrical solution checks electri- cal asymmetry, i.e. the norm of a ±120 degree rotated version of the ideal three-phase phasor is zero in the geometrical sense. Moreover, the geometrical norm is more sensitive for small scale unbalance, as opposed to the V U F. To summarize, the geometrical indicator a more suitable solution for a more gen- eral case indicator, and a good candidate for cost function in optimal control design.