Ground-surface deformation investigation in Paks NPP area in Hungary using D-InSAR and PSI techniques
M u h an n ad H a m m a d 1- B o u d ew ijn v a n L eeuw en2 - L ászló M u csi3
1 PhD student, University o f Szeged, Department o f Physical Geography and Geoinformatics, muhannad@geo .u-szeged.hu
2 assistant professor, University o f Szeged, Department o f Physical Geography and Geoinformatics, leeuwen@ geo .u-szeged.hu
3 associate professor, University o f Szeged, Department o f Physical Geography and Geoinformatics, mucsi@ geo .u-szeged.hu
Abstract: Ground-surface deformation can be monitored using leveling measurements. However, this method is costly and time-consuming. In addition, it can monitor just a limited number o f benchmarks.
Interferometric synthetic aperture radar (InSAR) can provide sub-centimeter accuracy when time series analysis techniques such as permanent scatterer InSAR (PSI) technique or differential interferometric synthetic aperture radar (D-InSAR) technique are employed. Also, InSAR has an additional advantage because it can monitor large areas. D-InSAR and PSI techniques were employed in this research with the help o f GIS to determine ground-surface deformation in Paks’ nuclear power plant area. The results reveal ground-surface deformation along the satellite line-of-sight with maximum value reaches to around - 1 0 mm in Paks NPP site, while maximum rate o f this deformation reaches to around - 2 0 mm/
year.
Introduction
The Paks’ nuclear power plant, which belongs to the Hungarian Electricity Company, is the only nuclear power plant in Hungary. It is located on the western side o f Danube river and about 5 kilometers from Paks town in the center o f Hungary with an elevation o f 97.15 m above mean sea level. In the site, the maximum flood level is 96.07 m, and the low water level o f the Danube river is 84.65 m ( Vo l e n t G. 2018).
It is always necessary to study and monitor all the potential hazards that may negatively affect the work efficiency o f such sensitive facilities and thus the safety o f people in the same area. One o f the most important hazards which should be monitored is the deformation in the ground-surface. Using InSAR techniques to monitor ground-surface deformation has become common worldwide nowadays.
The basic principle o f D-InSAR technique depends on using the phase information o f the radar waves to obtain the ground-surface deformation phase - the so-called displacement phase - from the complex interferogram generated from two images in the repeat-pass mode. The complex interferogram generated by these two images has fringes which represent the different components o f the phase information
<|) as follows ( Mo r a e t a l. 2003; Ve c i L. 2016):
<|) = <|)elev + <|)disp + <|)atmos + (|)flat + <|)noise where
(|)elev is the topographic phase;
4>ciisp is the displacement phase which is caused by the deformation o f a ground-surface pixel location along the satellite line-of-sight direction (slant-range);
<|)atmos is the atmospheric phase which is a signal delay error caused by the changing atmospheric heterogeneities in time and space;
4>flat is the flat-Earth phase which is an error caused by the curvature o f the reference surface;
<|)noise is the phase o f noise caused by either variability in scattering from a pixel, thermal noise or co-registration errors.
Through the interferometric processing, we always try to eliminate other sources o f error to be left with only the contributor o f interest which is typically either elevation phase or displacement phase which their values are wrapped between
—7i and +7t. Snaphu is a freely available software runs on most Unix/Linux platforms and uses suitable algorithm for phase unwrapping to obtain the absolute unwrapped phase value. Interferometric fringes, which represent a full 2n cycle, appear on an interferogram as cycles o f arbitrary colors, with each cycle representing half the sensor’s wavelength. Relative ground movement between two points can be calculated by counting the fringes and multiplying them by h alf o f the wavelength. The closer the fringes are together, the greater the strain on the ground. In interferometric processing also the coherence estimation can be generated. The coherence between master and slave images can show if the images have strong similarities and are therefore good candidates for producing good interferometric results. Loss o f coherence can produce poor interferometric results. Loss o f coherence can be caused by any o f temporal (time between acquisitions), geometric (orbit errors) and volumetric (vegetation) reasons.
The PSI technique allows better selection o f coherent pixels. It detects stable pixels or scatterers that are almost not affected by noise, and tries to estimate deformation rates and height differences parameters from their phase (Ru c c i a e t a l. 2012). The PSI technique uses a software package, runs in matlab under Linux, called Stanford method for persistent scatterers (StaMPS), multi-temporal InSAR (MTI) version, for unwrapping processes o f different time series SAR data through advanced algorithms in order to determine the relative values o f the line-of-sight (LOS) deformation (Ho o p e r e t a l. 2012; Ho o p e r e t a l. 2013).
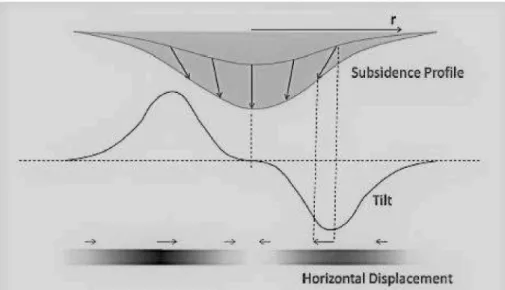
In general, the relative values o f the deformation in LOS direction have a strong relationship with the absolute vertical displacement values, since the line-of- sight deformation is considered as the projection o f the vertical displacement on the LOS direction. The linear relation between a subsidence profile and the horizontal displacement measurements in LOS direction can be drawn taking into consideration that the tilt was defined as the first derivative o f the subsidence profile (Fig. 1).
r
Horizontal Displacement
Figure 1 The linear relation between subsidence profile, tilt and horizontal displacement measurements in LOS direction (Esfahany 2009)
Material and methods
In this research, both D-InSAR and PSI techniques were employed to detect and compare the ground-surface deformation in Paks’ nuclear power plant (Paks NPP) and the surrounding area.
For the D-InSAR technique, Sentinel-1 data o f single look complex (SLC) images in interferometry wide swath mode (IW) with VV polarization and descending direction for two acquisition dates 16 December 2017 and 26 May 2017 were co
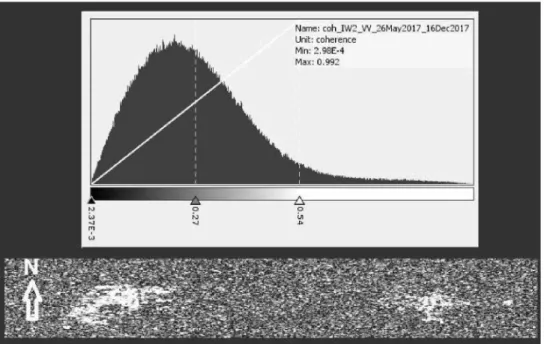
registered as master and slave respectively. These two images, which have a 67.48 m perpendicular and a 204 days temporary baseline and a coherence o f about 76 % between the whole two SAR images (Table 1) were used after subtraction processes for both o f flat-earth phase and topographic phase to generate a complex interferogram for Paks NPP site and the surrounding area using the Sentinel-1 Toolbox in the free open source ESA’s software, SNAP.
WGS84 geometric reference system was used as a reference surface to subtract the flat-earth phase, and a referenced DEM from SRTM 1 Sec HGT (Auto Download) were used to subtract the topographic phase. Coherence estimation was also included in the produced complex interferogram, and maximum coherence value in the area was 99.2 % (Fig. 2).
Table 1 Overview o f Sentinel-1 data used in D-InSAR technique in this study File Name Mst/Slv Acquisition Bperp [m] Btemp
[days]
Modeled Coherence S1A IW
SLC 20171216 Master 16Dec2017 0.00 0.00 1.00
S1A IW
SLC 20170526 Slave 26May2017 -67.48 -204.00 0.76
Figure 2 Coherence values between 26May2017 and 16Dec2017 SLC SAR images o f the study area
After interferogram formation process, deburst process was applied to seamlessly join all burst data into one single image (Grandest2015). Also, Goldstein phase filtering was applied to the interferogram phase to remove the noise phase from the complex interferogram, which is directly related to interferometric coherence and the look number o f the interferogram (Li e t a l. 2008). Then, with the help o f SNAPHU, the interferogram phase was unwrapped to recover the integer number o f cycles so it can be added to the wrapped phase o f the complex interferogram in order to get the unwrapped phase ( Fe r r e t t i e t a l. 2007). Finally, the values o f the
Table 2 Overview o f Sentinel-1 data used in PSI technique in this study Acquisition Mst/Slv Bperp
[m] Coh. Acquisition Mst/Slv Bperp
[m] Coh.
15May2017 Slave -61.11 0.86 31Aug2017 Slave -36.67 0.96
14Jun2017 Slave -31.50 0.91 06Sep2017 Slave 98.45 0.90
02Jul2017 Slave -15.79 0.94 12Sep2017 Slave -66.18 0.92
08Jul2017 Slave 68.60 0.91 18Sep2017 Slave 10.08 0.96
14Jul2017 Slave -23.16 0.95 24Sep2017 Slave -14.36 0.95 20Jul2017 Slave -28.63 0.95 30Sep2017 Slave -80.88 0.90
26Jul2017 Slave -7.95 0.97 060ct2017 Slave 58.34 0.91
01Aug2017 Slave -18.00 0.97 12Oct2017 Slave -87.02 0.88
07Aug2017 Slave 46.31 0.95 18Oct2017 Slave 77.18 0.88
13Aug2017 Slave -43.54 0.96 300ct2017 Slave -27.40 0.91
19Aug2017 Master 0.00 1.00 17Nov2017 Slave 76.39 0.86
25Aug2017 Slave 31.37 0.97 17Dec2017 Slave 129.45 0.79
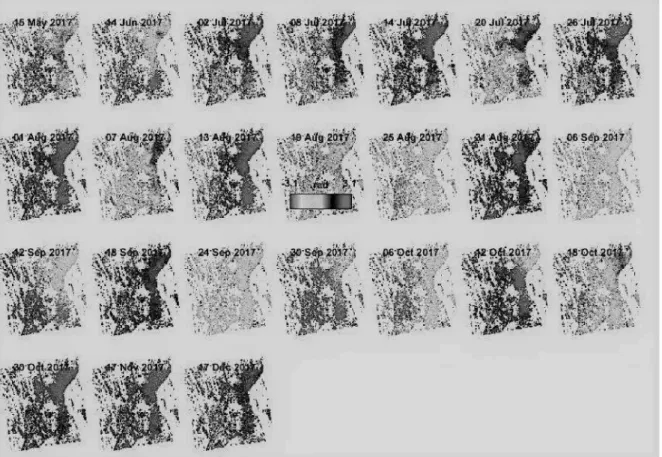
Figure 3 23 unwrapped phases o f 23 different interferograms from. 24 Sentinel-1 images fo r Paks area
unwrapped phase were converted into displacement values using SNAP in order to get the relative ground-surface deformation values in the LOS direction.
When applying the PSI technique, 24 Sentinel-1 SLC images in IW mode with W polarization and descending pass direction and acquired between 15 May and 17 December o f 2017 were used to generate 23 different interferograms. The image o f
19 August 2017 was used as a master {Table 2).
Then, the StaMPS matlab code was used under Linux for the unwrapping process to generate the unwrapped phase from each interferogram. So, in total, 23 unwrapped phases were generated for Paks NPP area {Fig. 3).
Then, the values o f the unwrapped phases were processed and converted into relative displacement values.
Results
InSAR time-series analyses indicates the presence o f LOS ground-surface deformation in the Paks NPP area.
Mainly, in InSAR, the results o f ground-surface deformation with positive values correspond to the motion toward the satellite, and the results o f ground-surface deformation with negative values correspond to the motion reverse the satellite.
Figure 4 Ground-surface deformation in Paks area on Google Earth image using D-InSAR between the two SAR images 26May2017 and 16December2017
The D-InSAR technique shows ground-surface deformation at the Paks NPP site when the result was laid on a Google Earth image with help o f ArcGIS. The ground-surface deformation values in the satellite line-of-sight direction at the Paks NPP site between 16 December 2017 and 26 May 2017 reached to around -1 0 mm (Fig. 4).
In contrast, the PSI technique shows all pixels that present low decorrelation with time and baseline and nondeformation signals are reduced by modelling or filtering. As a result o f using this technique, ground-surface deformation was detected at the Paks NPP site when the results was laid on a Google Earth image with help o f ArcGIS. The annual ground-surface deformation rate value at the Paks NPP site was around o f -2 0 mm/year (Fig. 5).
Nevertheless, these values are basically reflect the ground-surface deformation in just east - west direction along the LOS direction.
Discussion
This research demonstrates the potential and capability o f In-SAR time-series to detect and monitor points and patterns o f ground-surface deformation, and also to measure millimeter variations in the line o f sight distance over time using freely available data and software.
The D-InSAR technique can be considered as an attractive technique and
mm/yr
Figure 5 The annual rate o f ground-surface deformation fo r Paks area on Google Earth image using PSI technique
operational tool for geodetic tasks such as ground-surface deformation detecting and monitoring. Furthermore, the PSI technique is a very promising technique since the SAR data become more and more freely available, and it is very effective technique in urban areas where permanent scatterers remain coherent within a multi-temporal SAR data-set.
More studies are needed to check and understand different circumstances o f ground-surface deformation in the Paks NPP area, and if there is a possible relationship between the ground-surface deformation and the ground-water level variation in the area.
Above all, satellite-data-based ground-surface deformation precise calculations are complementary to the field measurements, but for sure do not replace them.
References
Esfahany, S. - Hanssen, R. - Van Thienen-Visser, K. - Muntendam-Bos, A. (2009): On the Effect o f Horizontal Deformation on InSAR Subsidence Estimates. Proceedings o f FRINGE 2009 workshop.
Ferretti, A. - Guamieri, A. - Prati, C. - Rocca, F. - Massonnet, D. (2007): InSAR Principles:
Guidelines for SAR interferometry processing and interpretation [ESA TM-19]. ESA Online Publications.
Grandest, R. (2015): Interferometric Processing o f SLC Sentinel-1 TOPS Data. Proceedings o f FRINGE 2015 workshop.
Hooper, A. - Bekaert, D. - Spaans, K. - Arikan, M. (2012): Recent advances in SAR interferometry time series analysis for measuring crustal deformation. Tectonophysics, 514—517, pp.1-13.
Hooper, A. - Bekaert, D. - Spaans, K. (2013): StaMPS/MTI Manual Version 3.3bl.
University o f Leeds Publications. URL: http://homepages.see.leeds.ac.uk/~earahoo/
stamps/StaMPS_Manual_v3.3b 1 .pdf Downloaded: March 2018.
Li, Z. - Dinga, X. - Huanga, C. - Zhub, J. - Chena, Y. (2008): Improved filtering parameter determination for the Goldstein radar interferogram filter. Journal o f Photogrammetry
& Remote Sensing, 63, pp. 621-634.
Mora, O. - Mallorqui, J. - Broquetas, A. (2003): Linear and Non-Linear Terrain Deformation Maps from a Reduced Set o f Interferometric SAR Images. EEEE Transactions on Geoscience and Remote Sensing, 41(10), pp. 2243-2253.
Ruccia, A. - Ferrettib, A. - Monti Guarnieria, A. - Roccaa, F. (2012): Sentinel 1 SAR interferometry applications: The outlook for sub millimeter measurements. Remote Sensing o f Environment, 120, pp. 156-163.
Veci, l. (2016): TOPS Interferometry Tutorial. ESA Online Publications. URL: https://www.
scribd.com/document/353837718/S1TBX-TOPS AR-Interferometry-With-Sentinel-1 - Tutorial Downloaded: March 2018.
Volent, G. (2017): Severe accident management at Paks NPP, Presentation. URL: https://
nucleus.iaea.org/sites/gsan/act/CN-251/presentations/G.%20Volent.pdf Downloaded:
March 2018.