THESES OF DOCTORAL (PhD) DISSERTATION
MIHÁLY SOÓS
Kaposvár University Faculty of Economic Science
2014
Kaposvár University Faculty of Economic Science Department of Marketing and Trade
Head of doctoral school:
PROF. DR. SÁNDOR KEREKES MTA doctor
Supervisor:
PROF. DR. ZOLTÁN SZAKÁLY university professor
Co-supervisor:
DR. VIKTÓRIA SZENTE associate professor
RELATIONSHIP BETWEEN FOOD CONSUMER BEHAVIOUR AND BODY MASS MANAGEMENT
Written by:
SOÓS MIHÁLY
KAPOSVÁR
2014
1 Table of contents
1. HISTORY AND OBJECTIVES OF THE RESEARCH ... 2
2. MATERIAL AND METHODS ... 5
3. RESULTS AND THEIR EVALUATION ... 8
3.1. Satisfaction with body mass... 8
3.2. Direction of change for body mass ... 10
3.3. Factor analysis of Three-factor Eating Questionnaire and Body Attitude Test .. 11
5.4. Cluster analysis of Three-factor Eating Questionnaire and Body Attitude Test ... 13
3.5. Judgement on body image ... 16
3.6. Switch to nutrition considered to be healthy ... 17
3.7. Switch to regular physical activity ... 20
3.8. Information sources on the nutrition considered to be healthy and the regular physical activity ... 22
3.8.1. Information sources on the nutrition considered to be healthy ... 22
5.8.2. Information sources on regular physical activity ... 23
4. CONCLUSIONS, RECOMMENDATIONS ... 24
5. NEW SCIENTIFIC RESULTS ... 29
6. PUBLICATIONS IN THE TOPICS OF DISSERTATION ... 30
2
1. HISTORY AND OBJECTIVES OF THE RESEARCH Body mass of the Hungarian population is not only individual responsibility and interest any more but it also plays a serious role in the social security expenses that charges the budget. Beside the food fill that characterises nowadays’ food consumption, the poor exercise way of life has appeared and together with the people’s genetic traits most of the society has overweight (TOLNAY and SZABÓ, 2004). The World Health Organisation (WHO) involved in its strategy for 2008-2013 – because of the reduction of the main mortality risk factors – the lifelong physical activity as a basic determinative factor of health (CSÁNYI, 2010; WHO, 2008). Beside the negative health effects, the overweight and the obesity cause esthetical, public- and self-assessment disturbances within the population (KOCSÁNDI, TOLNAY and SZABÓ, 2005). The cumulative public health problems are impossible to manage only by the side of the Hungarian State (health), because the individual’s own motivation and his intention to act are also needed.
This topic’s timeliness and actuality are supported by the recently launched recreation and prevention campaigns which are coordinated by several national hospitals and health institutes. Their main mission is to prevent diseases caused by overweight and obesity and their complications.
As an effect of the scientifically based advice on food consumption, nutritional composition, exercises, way of living the group of conscious body mass managing people has appeared. Instead of applying popular fashion diets, the base of maintainable body mass management is the regular consumption of food suggested by nutritional advice.
Body mass management chosen for the topic of this dissertation can be defined as a lifelong process which consists of choosing the consumed food
3
and doing exercises in order to have a healthy style of life in a way that the energy intake and use are balanced (SHANNON, 1997).
In the course of body mass management, the relationship between food consumption behaviour and physical activity factors will be analysed.
Based on the previously mentioned facts the null hypothesis of this dissertation is the following: The group of conscious body mass managing people has appeared whose food consumption habits and physical activity are subordinated according to this in a way that after reaching their desired body mass they maintain their modified habits.
Objectives of the dissertation:
C1: To structuring of Hungarian and international literature on the relationship between food consumption and body mass management.
C2: To determine the rate of the public who desire to lose or gain weight.
C3: To analyse the body attitudes.
C4: To assess the public’s rate of switch to nutrition considered to be healthy and regular physical activity and to analyse the applied information sources of these two fields that are considered to be trustworthy.
4 Hypotheses of the dissertation:
H1: In Hungary, the group that consciously manages its body mass has not been determined in details yet.
H2: People desiring to lose weight want to answer themselves and not their external environment.
H3: The ideal body image for an individual typically differs from what the environment thinks about the individual.
H4: The applied and trustworthy information sources differ from each other both on the field of nutrition considered to be healthy and the regular physical activity.
H5: In the course of body mass management typically the young women reach the phase of maintainability.
H6: According to our assumptions, today the Hungarian consumers are dissatisfied with their body mass at a higher rate than it was measured previously by researchers.
5
2. MATERIAL AND METHODS
In the dissertation primary and secondary data and information collection were also executed. The review of the chosen topic and the basis of the research were started by collecting secondary information and data. By the national and foreign literature I got a complex picture on the results of prior research results and the recent statements of science.
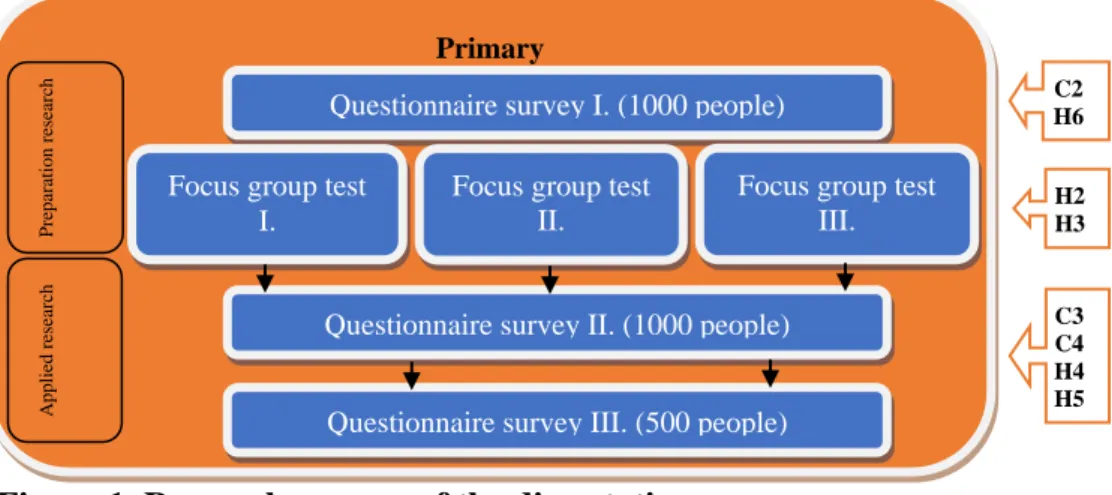
Figure 1. shows the research process, the analysis place of objectives and hypotheses.
Figure 1. Research process of the dissertation Source: Own compilation, 2014.
In the course of primary research a questionnaire survey with 1000 people was made to create a basis for the further research, and according to the results three groups were formed (satisfied with their body mass, people desiring to decrease and increase their body mass) which were used to execute focus group tests. After the first questionnaire survey and three focus group tests (preparation research) again a questionnaire survey with 1000 people were held to analyse their food consumption habits and body attitudes. By the applied statements in the course of analysing food consumption habits, we identified the conscious body managers’ group in
Primary
Questionnaire survey I. (1000 people)
Focus group test I.
Focus group test II.
Focus group test III.
Questionnaire survey II. (1000 people)
Questionnaire survey III. (500 people)
Preparation research
C2 H6
H2 H3
C3 C4 H4 Applied research H5
6
the population. The primary research was closed by a questionnaire survey with 500 people when body image attitudes, change in food consumption and physical activity behaviour and surplus effort on healthy nutrition and regular physical activity were analysed within the group of conscious body mass managers.
The results of quantitative research were evaluated by SPSS 22.0 mathematical-statistical software package. In the course of data recording metric and non-metric scales were also used. The answers got for the questionnaire survey were evaluated by descriptive statistics connecting to nominal, ordinal, interval and ratio scales (SAJTOS and MITEV, 2007;
MURRAY, 1995).
During focus group tests sound was recorded by a Dictaphone, so the dialogues and conclusions could be written down in details after the test.
The table consisting the number and length of meals on weekdays and weekends were evaluated on paper by hand.
First of all, before processing the results frequency indices, arithmetic mean and standard deviation were calculated (SAJTOS and MITEV, 2007;
MOLNÁR, 2007). These methods are widely known and their application is a daily practice in market research tasks, so the detailed presentation of these is not needed here (KÖVES and PÁRNICZKY, 1973). To calculate the significant relations Pearson’s Chi2 test and variance analysis were applied. The determination of the significance for variables were executed by cross tables (significance level: p<0.05). An outstanding advantage of the cross-table analysis is that it is suitable to analyse variables on metric and non-metric scales as well.
In the course of applied research (questionnaire survey II.) factor analysis was executed in two steps, first by the Three-factor Eating Questionnaire and after that by the Body Attitude Test. Before starting these tests KMO and Bartlett’s tests were made in order to decide if these factors
7
are suitable to execute factor analysis. After the application of both the main component analysis and Maximum likelihood method’s Varimax rotation the latter had more valuable results in both cases. By the statement filtered out by the factor analysis the explanation value could be increased, so in the first step by three, in the second step by four factors we made hierarchical clustering (Ward’s method) to determine the ideal number of clusters. After this by K-means clustering with setting 10 iterations we reached smaller cluster sample number than 10% in the case of 5 clusters.
8
3. RESULTS AND THEIR EVALUATION
In this chapter the main results of primary preparation research (questionnaire survey I.; focus group test I., II. and III.) and the applied research (questionnaire survey II. and III.) will be presented in chronological order.
3.1. Satisfaction with body mass
The research covered the analysis on the satisfaction with body mass as well. Table 1. shows the results of the executed research’s results written down in hypothesis H6 (According to our assumptions, today the Hungarian consumers are dissatisfied with their body mass at a higher rate than it was measured previously by researchers.)
Table 1.
Satisfaction with body mass (N=1000)
Level of satisfaction Head %
Fully satisfied 369 36,9
Satisfied to a certain extent 171 17,1
Both satisfied and dissatisfied 163 16,3
Dissatisfied to a certain extent 165 16,5
Not satisfied at all 132 13,2
Source: Own compilation, 2014, based on questionnaire survey I.
According to the data in the table it can be seen that 36.9% of the respondents are fully satisfied with their body mass. This rate is by 11.9%
lower compared to the data of 2005 of GFK Market Research Institute, so it can be stated that the rate of dissatisfied people has increased significantly during the last 9 years in Hungary.
43.2% of men and 31.1% of women are satisfied fully with their body mass. The overrepresented rate of male respondents also shows that women are typically more critical in this field than men. It is also strengthened by
9
the fact that men think at a very low rate (8.7%) that they are not satisfied with their body mass.
Analysing the satisfaction of men and women according to BMI value, a significant difference can be experienced between the two genders. Men who have ideal BMI are mostly (63.8%) satisfied with their body mass, but women who have low BMI are satisfied with their body mass at a higher rate (48.1%).
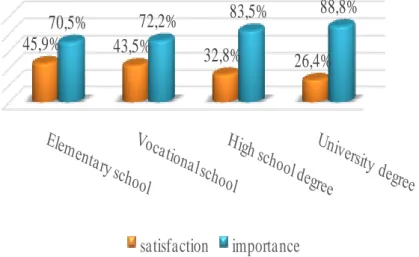
There is a positive correlation between the importance of body mass and the satisfaction with it (corr: 0.211; sig: 0.000). According to this, more educated people consider their body mass more important and more dissatisfied with it. Results are presented in Figure 2.
45,9% 43,5% 32,8% 26,4%
70,5% 72,2% 83,5% 88,8%
satisfaction importance
Figure 2. Importance of body mass (N=369) and satisfaction with it (N=790) for education and training
Source: Own compilation, 2014, based on questionnaire survey I.
70.5% of those who finished elementary school, 83.5% of those who have high school degree and 88.8% of those who have university degree consider their body mass as important. There is a reverse tendency in the satisfaction
10
with body mass. 45.9% of those who finished elementary school are satisfied with it. This rate is 43.5% in the case of those who attended vocational school. In the case of those who have high school degree and university diploma these rates are even lower (32.8% and 26.4%).
3.2. Direction of change for body mass
As a next step the direction of change for body mass was analyses which results are shown in Table 2.
Table 2.
Direction of change for people who are dissatisfied with their body mass (N=631)
Direction of change Head %
Wants to decrease his body mass 546 86,5
Wants to increase his body mass 56 8,9
Cannot decide 29 4,6
Source: Own compilation, 2014, based on questionnaire survey I.
According to the results it can be stated that among those who are dissatisfied with their body mass, most of the people want to decrease their body mass (86.5%). 8.9% of the respondents want to increase their body mass, while 4.6% cannot decide which direction to go. Compared to the survey of Gfk Market Research Institute in 2005 – presented in Chapter 2.2.2. – the rate of people who desire to lose weight has significantly shifted. Based on the results of the survey 37.0% want to decrease and 7.0%
want to increase their body mass among the dissatisfied. Respondents who want to increase their body mass increased by 1.9% and the number of those who want to decrease it have almost doubled among the dissatisfied. One of the most decisive reason of body mass increase according to the respondents is that they feel thin/skinny (60.7%), so they have discomfort feeling and they are not enough self-confident in their everyday lives.
Results got by the analysis with the variables will be presented first through those who want to decrease and then to increase their body mass.
11
The results show that women want to lose weight at a higher rate (89.9%) than men (82.1%). 58.8% of men with ideal BMI and 28.6% of men with low BMI would lose weight from their smaller body mass than the ideal one. 83.8% of women with ideal BMI and 63.1% of women with low BMI would like to decrease their body mass. Therefore, it can be concluded that in cases of both gender there is a general desire to decrease their body mass regardless if they are over weighted according to the literature or have ideal or low BMI.
94.5% in the age group of 40-49 years old want less body mass.
Members in the age group of 30-39 and 18-29 years old want to decrease it at a lower level than the average (83.8% and 79.3%).
Analysing this issue for the education and training, we can state that respondents with higher education degree would like to decrease their body mass at a higher level (93.1%) than the less educated (elementary) (81.0%).
12.0% of male and 6.4% of female respondents want to increase their body mass and at the highest rate (16.6%) there are the members in age group 18-29 years old.
When the education and training as a variable was analyses, it turned out that the higher is the qualification of someone, the less the person wants to increase its body mass. Among the people who finished only elementary school this rate is 11.4% and 4.6% of those who have university degree.
In contrast to those who want to decrease their body mass – at both gender – people with low BMI desire to gain weight. For men with ideal BMI this rate is 66.4% and for women it is 37.0%.
3.3. Factor analysis of Three-factor Eating Questionnaire and Body Attitude Test
In the first step factor analysis was performed with the items of the Three- factor Eating Questionnaire to explore the factor structure of the items on the test sample. The new structure clearly reflects the original factors
12
(therefore we use the same denominations), but 9 items had to be taken out of the original 21 to get a factor structure with a reasonably high (70.115%) explanatory power. The first and strongest factor, Emotional eating explains 37.019% of the total variance, while Uncontrolled eating (explained variance: 16.621) and cognitive restraint (explained variance: 16.621) represent a similar rate.
The reliability of the new scales was also tested by examining the Cronbach’s alpha, and as all the values were over 0.8 it can be stated that the scales are homogeneous enough for measuring amongst the Hungarian population. Uncontrolled eating (Cronbach’s alpha=0.817), Cognitive restraint (Cronbach’s alpha=0.825) show reasonably good reliability, while Emotional eating (Cronbach’s alpha=0.955) is an even more homogeneous scale, so further items could be taken out if the propose of the research or practical reasons indicates. (Method: Maximum Likelihood, Rotation method: Varimax with Kaiser Normalization a. Rotation converged in 5 iterations. KMO=0,918; Bartlet (Approx. Chi Sq.) 9183,963; (Sig) 0,000;
Communalities: 0,504-0,862; Explained variance: 70,115; N=1000.)
In the second step the factor structure of the Body Attitude Test was examined with factor analysis, and it resulted in a two factor model.
(Method: Maximum Likelihood, Rotation Method: Varimax with Kaiser Normalization. a. Rotation converged in 5 iterations. KMO=0,908; Bartlet (Approx. Chi Sq.) 5653,086; (Sig) 0,000; Communalities: 0,332-0,791;
Total Variance Explained: 63,927; N=1000.)
Out of the original three factors ‘Lack of familiarity with one’s own body’ and ‘Negative apperception of body size’ constitute the new structure, there is only one item (When I look at myself in the mirror, I’m dissatisfied with my own body) that originally belongs to the General body dissatisfaction factor and it has become part of the ‘Negative apperception of body size’ now. The reason might lie in the fact that the body size is the
13
main cause of dissatisfaction, and it seems to be a more specific and homogenous feature than general dissatisfaction. To verify the reliability of the new scales the Cronbach’s alpha value of the factors was calculated again, (‘Negative apperception of body size’ = 0.851; Lack of familiarity with one’s own body = 0.905) and as both are higher than 0.8 they could be accepted as reliable scales to measure body attitudes.
5. 4. Cluster analysis of Three-factor Eating Questionnaire and Body Attitude Test
After the factor analysis presented in the last sub-chapter, cluster analysis was carried out with the aggregated factors of the examined two questionnaires in order to segmentate the Hungarian population on the basis of body attitudes and eating attitudes. As a result of this process 5 clusters could be separated.
Cluster 1 – Uncontrolled Emotional Eaters (N=174)
The strongest feature of this cluster is emotional eating, that means they tend to eat more than it would be necessary to satisfy their needs in emotional situations. They are less, but still strongly affected by uncontrolled eating, so this impulsivity expands to general level as well, although their body attitude is not negative at all. Within this group men are slightly overrepresented (55.7%), they mainly own a secondary school degree, their income is just about enough to earn a living, the single population is represented with the highest percent amongst the clusters, they are mainly active physical workers (39.1%) and 56.3% are the primary food purchaser in the family.
14 Cluster 2 – Dissatisfied Tense (N=118)
The body attitude of this group is extremely negative, they often feel anxiety, tension and frightened about their physical processes. They are not satisfied with their body size and tend to eat in emotional situations;
considerably eating plays an important role in dissipating tension in their lives. Members of this group are mainly women (57.6%) with average or lower than average income, the percent of widows is the highest (19.5%) amongst the groups, they represent the older population according to their age and legal status as well. They are typically primary food purchasers (68.6%) as they mainly live alone.
Cluster 3 – Uninterested (N=382)
The body attitude of this group is neither negative nor positive, they do not tend to lose control of eating in emotional or other situations, the only factor that features this group is the lack of cognitive restraint. This value considering the whole pattern means that the members of this group do not care about their bodily sensations and nutrition at all. Men are overrepresented in this group (59.2%), they mainly have vocational school or high school degree, slightly above average income equally characterises them than slightly below average. There is no special difference from average on other socio demographic dimensions, they are not typical food purchasers (51.8%) in the family.
Cluster 4 – Overweight Impulse Eaters (N=130)
The Overweight Impulse Eaters are featured with negative body attitude, especially on the dimension of negative apperception of body size. They think that they are too thick and have a strong desire to be thinner. They cannot resist eating if they see or smell any delicious food. They are mainly women (63.8%), their income is enough for their living or they can even put
15
apart, usually they have a partner or a family, in which they are the primary food purchasers.
Cluster 5 – Conscious Consumers (N=196)
The main feature of this group is conscious restraint, it means that they are conscious about their food choices, and do not waver even in emotional situations. As a result of conscious nutrition they are mainly satisfied with their body, but they are also motivated to be thinner. The members of this consumer group are mainly women (64.3%), with high school or university degree, their income rate is the highest amongst the five segments, this is the only group where mental workers are overrepresented than physical workers, and they tend to be the primary food purchasers of the household.
It can be therefore stated that 38.2% of the population belongs to the group of ‘Uninterested’ who fully refuse conscious nutrition and it doesn’t cause them discomfort feeling either which could be motivating for them, so this group is more difficult to address. The cluster of ‘Uncontrolled Emotional Eaters’ (17.5%) is also difficult to address who usually eat as a stress easer solution in negative emotional status, and based on the examined variables it proves to be satisfactory for them, so they consider eating fully as a source of joy. These two hard-to-reach groups come out at 55.6% of the total, so most of the consumers belong to this category.
The group of ‘Dissatisfied Tense’ is in quite bad situation considering their body image and eating attitudes according to their subjective feeling, however, this judgement is given expression in the form of distress and dissatisfaction, so they are aware of their situation and under this stress they could be willing to change, but the producer that chooses this group has to ensure an efficient solution to decrease their distress. Based on the income status of the target group not the premium category is worth to be chosen in
16
pricing and the information and marketing channels must be chosen according to the needs of older consumers. From the point of marketing it is not optimal to consider health conscious consumers who are in good circumstances, however, by a proper strategy a significant market share can be reached, since 11.8% of the country’s population belong to this group.
With greater financial potential and significant motivation the group of
‘Overweight Impulse Eaters’ (13%) can be addressed, however, in order to get their loyalty particular attention must be given to this target group because of their impulse eating habit. At the same time they have desire to lose weight and the emotional and uncontrolled eating, so probably this consumer segment is the main target group for the so-called fashion diets:
they buy it, try it out, but they give up in a short time if the method requires insistence, long term lifestyle change. In their case it is worth placing particular emphasis on the retention and not the address of these consumers.
The group of ‘Conscious Consumers’ takes almost 20% which is the primary target group of consuming health protecting food. Members of this cluster changed their eating habits a long time ago and they have been maintaining it for a longer period, since emotional eating is not characteristic for them. Based on their financial status they can afford premium category products as well, and they are willing to buy if they are convinced, because they are the primary food purchasers in the household.
Probably, first of all the members of this group react to the call of ‘health’, we can meet them at lifestyle clubs, fitness events and screening tests. They can be convinced by scientifically proved arguments and they are loyal consumers in a long term.
3.5. Judgement on body image
In this chapter the judgement on body image will be examined defined in H3 hypothesis (The ideal body image for an individual typically differs
17
from what the environment thinks about the individual). By using nine man figure drawings of Fallon Rozin Test presented in Chapter 2.2.2. of the dissertation, respondents were asked to mark first their own figure and after that their ideal male and female figures, and at the and the least attractive figures both for men and women.
Respondents prefer the figure that is close to average (4.14). Men consider their figure as ideal if it is plumper (4.27), but women think the thinner figure as ideal for man shape (4.01). Male respondents think that the most attractive female figure for them has higher body mass (4.05) than female respondents chose (3.64). Therefore, it can be stated that the ideal male figure and also it is the most attractive one for women is the same.
About the least attractive male figure both gender judged in the same way: men with overweight are more repulsive that if they have thin figure.
77.6% of men and 83.0% of women consider the fattest male figure as the least attractive, but on the contrary to this 15.8% of male and 12.0% of female respondent thought this about the thinnest male figure.
65.0% of men with low BMI, 71.0% of men with overweight and 45.0% of obese men consider the female figure with the highest body mass as the least attractive. Besides, the skinniest female figure is thought to be attractive proportionately with the rise of BMI. Women with ideal and higher than the ideal BMI consider the obese female figure as repulsive at a high rate (79.2% and 80.6%).
3.6. Switch to nutrition considered to be healthy
Related to hypothesis 5 (H5: In the course of body mass management typically the young women reach the phase of maintainability) the change of food consuming behaviour will be analysed by the Transtheoretical Model of Behaviour Change through the individual’s switch to the nutrition that is
18
considered to be healthy. The statements of the table involve five stages:
precontemplation, contemplation, preparation, action, maintenance.
Precontemplation: 21.6% of people are not intending to switch to healthy nutrition. 27.0% of men and 16.6% of women refuse the change, so men are more passive on this field. Precontemplation is characteristic for the older age groups to the highest degree. 35.7% of people over 60 do not plan a change towards the healthier eating. Precontemplation is present the least in the age group of 40-49 years old people (12.5%). 35.0% of men with low BMI do not plan to change in their food consuming habits within the next 6 months. Therefore, this group is the most precontemplated. Similar to men, women with low BMI are the most precontemplated (25.0%). The least passive consumers are the people with overweight at both genders (male:
16.5%; female: 2.8%). According to the variable of income there is a significant relationship with the precontemplation. 80% of the respondents are in this stage who have daily financial problems. This value proves that according to the preconception of consumers the healthier eating comes together with higher costs, so people with modest income cannot afford it.
24.0% of those respondents who make a living of their salary but cannot save much, and 23.2% of those respondents who make a living of their salary but cannot save at all are not planning any change toward the healthier eating.
Contemplation: 22.6% of respondents feel strong urge to switch to healthy nutrition. Both genders feel this urge at the same extent, but in this stage the women are more present (20.5%). This stage is characteristic mostly for the age group of 40-49 (37.5%) and 50-59 (47.1%). The status of contemplation is typical for those who can just make a living out of their salary, but cannot save at all. Those respondents are present to a similar extent in this group
19
whose salary is not even enough to make both ends meet (26.9%).
Contemplation is the most typical for obese men (28.9%) and obese women (27.8%). Contemplation is the least characteristic in the circle of men with ideal BMI (13,4%) and for women with low BMI.
Preparation: Only 17.2% of respondents are in the stage of preparation.
13.7% of male respondents and 20.5% of female plan to switch to a healthier diet in the next half year. Surprisingly, 23.1% of respondents with lower than average income can be identified to the phase of preparation, and proportionately with the increase in income the rate of respondents decreases who intend to change their eating habits in the next 6 months.
Mostly obese women plan to change their nutrition (30.6%).
Action: 18.6% of respondents – mostly women (22.4%) – have switched to a healthier diet during the last half year. A tendency can be witnessed that age groups above 30 years are present at a higher extent in the previous three stages than the respondents of 18-29 years old. 23.2% of young adults (18-29 years old) belong to the action stage, the rate of older age groups does not reach 15%, and people over 60 are not present at all in this stage.
26.9% of people in the action stage cannot make both ends meet. The rate of respondents in the other income categories does not reach 20%.
Similar to those in the preparation stage, the obese women (27.8%) are present at a higher rate than respondent with other BMI categories.
Maintenance: According to the results, 20.0% of respondents are maintaining a healthier diet for more than 6 months and few think that they will return to their previous eating habits. The lower rate of women (17.8%) can be explained with the fact that after having a slimming diet they return to their original eating habits. Maintenance is more typical for the younger
20
than the older. 24.4% of 20-29 years old, 21.9% of 30-39 years old maintain their healthier eating habits for more than 6 months. This maintenance stage is characteristic for 31.4% of people with higher than average income, 25.6% of men with ideal BMI and 19.2% of women with low BMI.
3. 7. Switch to regular physical activity
My research also covered the analysis of switch to regular physical activity beside the switch to nutrition considered to be healthy. Similar to the previous chapter it will be analysed by the Transtheoretical Model of Behaviour Change’s stages (precontemplation, contemplation, preparation, action, maintenance).
Precontemplation: The table shows that only 8.0% of respondents refuse the switch to more regular physical activity. This value is the one- third of the refuse of healthier food consumption, so respondents are more open on the field of physical activity than changing their eating habits. At a higher rate (11.2%) men refuse it and only 5.0% of women answered that they do not plan the switch. Considering the variable of age we can state that most of the precontemplators are over 60 (14.3%). Within the group the younger age groups dominate (18-29 years old 5.9%; 30-39 years old 5.9%
and 40-49 years old 6.2%). 66.7% of the widow do not intend to do regular physical activity, beside them people with common-law partners are at a high rate in this group. The least precontemplated are the single respondents (6.4%).
On the contrary to the switch to healthier food consumption, people with higher than average income are present in this group (55.0%), besides, at both genders passivity is more typical for people with lower than ideal BMI (male: 25.5%; female: 7.7%).
Contemplation: 24.2% of respondents feel a strong urge to switch to a more regular physical activity (28.6% of women, 19.5% of men). There is a
21
higher rate in the age groups of 50-59 years old (47.1%) and 40-49 years old (40.6%) in this stage. It can be stated that the rate of single respondents is the lowest (18.8%) in this stage. Unemployed and active physical workers are present at a rate over 40.0% in this stage; however, they go further in the next stages (Action and Maintenance). This stage is the most typical among people with average income (32.8%). Analysing the stages of behaviour change by the income it can be stated that people with lower income reach the active stage at a higher rate, however, people with higher than average income belong to the stages of action and maintenance. In the background of this there is a fact that more regular physical activity comes with surplus costs which is not affordable for people with lower income. Considering the respondents’ BMI it can be stated that at the highest rate obese women (30.6%) feel a strong urge to switch to more regular physical activity.
Preparation: 20.0% of respondents make steps to change to a more regular physical activity in the next month. 17.0% of men and 22.8% of women belong to the preparation stage. However, the results show that respondents over 60 reach this stage in a high rate (35.7%), but the action and maintenance are not typical for them. On the contrary, age groups of 30- 39 and 40-49 years old are present at a higher rate in the stages after the preparation and from these people will be the most people in whose everyday life the regular physical activity will be present. Single respondents are at an extremely high rate among the members in the stage of preparation (25.0%). The importance of body mass is also high in this group, so we can state that they do not just consider their own body mass as important, but they make something for it to happen. In case of both women (27.8%) and men (28.9%) the rate of obese respondents is higher.
Action: 22.0% of respondents said that they switched to a more regular physical activity in the last six months. 25.1% of women and 19.1% of men reached this stage. 23.5% of 18-29 year-olds and 23.0% of 30-39 year-olds
22
belong to this group. Half of the divorced, one-third of the living apart (33.3%) does regular physical activity. Furthermore, the rates of respondents with average income (24.8%) and higher than average income (24.3%) are determinative in this group. According to the BMI of the respondents, among obese men (25.0%) and obese women (27.8%) regular physical activity is most representative.
Maintenance: 25.6% of respondents maintain their regular physical activity formed during their body mass management after more than half a year. Men are present at a higher rate among the maintainers (62.5%) than women (37.5%). Regular physical activity is the most characteristic for the age group of 50 to 59 (35.3%; 57.8% of 18 to 29 and 30.5% of 20 to 29).
According to marital status, for the living apart (33.3%) and the single (26.1%) it is typical to maintain the regular physical activity on a long term.
There are in small number those men who have low (40.1%) and ideal BMI (39.0%) who can be grouped into the maintainer at a higher rate than others.
3.8. Information sources on the nutrition considered to be healthy and the regular physical activity
In this chapter connected to H4 hypothesis (The applied and trustworthy information sources differ from each other both on the field of nutrition considered to be healthy and the regular physical activity.) we analysed the respondents by the used information sources and among these which ones they consider as trustworthy on the field of food consumption and physical activity.
3.8.1. Information sources on the nutrition considered to be healthy
Respondents have mostly recourse to search engines on the internet (60.6%), advice of friends, acquaintances (50.8%) and the opinion of the family (40.0%). On the contrary, the most trustworthy information sources
23
are the dieticians/doctors (63.8%) and the information books (41.6%).
Conventional communication channels – such as television, radio, and printed media – are considered as trustworthy at a very low level and they are not often used either.
Based on the results of the analysis with the variables, 65.4% of respondents with university degree use internet browser pages to get information on food consumption. 74.1% of women and 52.7% of men consider the doctor/dietician as the most trustworthy. Women with low BMI and obese women are also at a significantly higher rate (67.3% and 69.4%) than women with ideal BMI who consider this source as trustworthy.
5.8.2. Information sources on regular physical activity
This chapter presents the information sources on regular physical activity used by the respondents and which they consider as trustworthy.
Respondents have mostly recourse to search engines on the internet (58.4%), advice of friends, acquaintances (58.2%) and the opinion of the family is also determinative (32.0%). In the rank of trustworthy information sources the personal trainer is on the first place (53.0%), which is followed by the advice of a dietician/doctor (44.0%) and then the information books come (37.8%). Conventional communication channels – such as television, radio, and printed media – are considered as trustworthy at a very low level and they are not often used either similar to the information sources on food nutrition.
Analyses with variables show that there are significant results only in the case of age, so it can be stated that 61.9% of men in the age of 30 to 39 and 29.5% of men in the age of 18 to 29 use search engines on the internet.
24
4. CONCLUSIONS, RECOMMENDATIONS
In this chapter the main statements, conclusions will be presented connected to the dissertation’s secondary and primary objectives and hypotheses and recommendations will be given as solutions to some questions.
Research hypothesis Approved/
Disapproved
New scientific result
Result in details H0: The group of conscious body
mass managing people has appeared whose food consumption habits and physical activity are subordinated according to this in a way that after reaching their desired body mass they maintain their modified habits.
Approved T1 Chapter 5.3.
Source: Own compilation, 2014.
Based on the results of the adaptation of Transtheoretical Model of Behaviour Change on the fields of food consumption and regular physical activity the present ‘active’ groups, beside by the factor analysis of Three Factor Eating Questionnaire the presence of ‘Weakly Controlled’ factor prove the presence of conscious body mass managers within the population.
Accordingly, null hypothesis of the research is approved and accepted (The group of conscious body mass managing people has appeared whose food consumption habits and physical activity are subordinated according to this in a way that after reaching their desired body mass they maintain their modified habits)
C1 objective: To review of Hungarian and international literature on the relationship between food consumption and body mass management.
Research hypothesis Approved/
Disapproved
New scientific result
Result in details H1: In Hungary, the group that
consciously manages its body mass has not been determined in details yet.
Approved T2 Chapter 2.
Source: Own compilation, 2014.
25
The analysis of this hypothesis was executed according to the process written down in the chapter of Literature review (Chapter 2). The literature’s degree of processing is high, but there aren’t many publications on the detailed analysis of the conscious body mass managers, so H1 hypothesis is approved.
C2 objective: To determine the rate of the public who desire to lose or gain weight.
Research hypothesis Approved/
Disapproved
New scientific result
Result in details H2: People desiring to lose weight
want to answer themselves and not their external environment.
Approved T4
Chapter 5.1.3 Chapter
5.2.2.
Source: Own compilation, 2014.
Analysing the direction of body mass change, it can be stated that 93.8% of respondents would change their body mass because of themselves and not because of their external environment. According to the results of this research in all three groups the reason for change was health among the first three places. In case of people desiring to lose weight the feeling of being
‘fit’ was on the third place after stamina. Therefore, H2 hypothesis (People desiring to lose weight want to answer themselves and not their external environment.) is approved.
Recommendation: Strengthening further the motivations in the consumers to change body mass, for example with the means of health marketing.
26
C3 objective: To analyse the body image attitudes
Research hypothesis Approved/
Disapproved
New scientific result
Result in details H3: The ideal body image for an
individual typically differs from what the environment thinks about the individual.
Approved T4 Chapter
5.4.1.
Source: Own compilation, 2014.
Based on the results of Fallon Rozin Test and Body Attitude Test it can be stated that for men the ideal shape has bigger body mass than women think for the men to be ideal. Men consider the plumper female shape as ideal for them. Male figure that is attractive for women has less body mass than the ideal one. According to the judgement of men the most attractive for them has bigger body mass than the ideal. All in all, we can state that there is a difference at both genders between the ideal and attractive shapes for themselves and for the other ones. Therefore, the third hypothesis (The ideal body image for an individual typically differs from what the environment thinks about the individual.) is approved and accepted.
Recommendation: Organizing programs for men and women separately even in the topic of ideal body image and health.
27
C4 objective: To assess the public’s rate of switch to nutrition considered to be healthy and regular physical activity and to analyse the applied information sources of these two fields that are considered to be trustworthy.
Research hypothesis Approved/
Disapproved
New scientific result
Result in details H4: The applied and trustworthy
information sources differ from each other both on the field of nutrition considered to be healthy and the regular physical activity.
Approved T4 Chapter
5.2.5.
H5: In the course of body mass management typically the young women reach the phase of maintainability.
Disapproved T3
Chapter 5.4.2.
Chapter 5.4.3.
H6: According to our assumptions, today the Hungarian consumers are dissatisfied with their body mass at a higher rate than it was measured previously by researchers.
Approved T4
Chapter 2.2.2.
Chapter 5.1.2.
Source: Own compilation, 2014.
Considering the information sources on food consumption and regular physical activity we can state that there is a difference between the used and the trustworthy sources. While respondents use primarily search engines on the internet, the advice of friends/acquaintances, they consider the personal trainer, dietician/doctor and books as trustworthy. The positive experiences of friends/ acquaintances are only thought to be trustworthy in the case of food consumption. Both in the case of used and trustworthy information sources the conventional communication tools (newspaper, radio, television) are in the back. Therefore, hypothesis 4 (The applied and trustworthy information sources differ from each other both on the field of nutrition considered to be healthy and the regular physical activity.) is approved.
In the case of switching to food consumption considered to be healthier and regular physical activity most of the respondents are in the stage of
28
contemplation. The rate of respondents in the stages of preparation and action shows an increasing tendency on both fields. Besides, those who have made a change for more than 6 months consider the chance of fallback as minimum; the rate is higher in the case of those who do regular physical activity. In the stage of maintenance men are present at a higher proportion in the case of healthy food consumption and regular physical activity.
Therefore, hypothesis 5 (In the course of body mass management typically the young women reach the phase of maintainability.) is disapproved.
Based on the fact written down in chapter 2.1.1. of the dissertation, 45%
of the population was satisfied with their body mass, 37% wanted to lose weight and 7% wanted to increase it in 2005 (GFK, 2005; SZAKÁLY, 2011). According to the presented facts in chapter 5.1.2., 36.9% of respondents were fully satisfied with their body mass, so last years the rate of dissatisfied has increased significantly. Therefore, hypothesis 6 is approved.
Recommendation: From the side of professionals (personal trainer/dietician/doctor) organized news campaigns, targeted messages should be communicated on the social web pages (Facebook, Twitter) on the field of body mass decrease.
Beside more effective communication of nutrition suggestions, individual motivations should be strengthened to reach the proper nutrient intake.
Organizing health days and recreation programs with screening tests and lifestyle advice.
29
5. NEW SCIENTIFIC RESULTS
T1: By the application of Three Factor Eating Questionnaire and Body Attitude Test through factor and cluster analyses I identified the group of conscious food consumers (Cluster 5, Conscious Consumers), which consists 19.6% of the sample.
T2: In the course of secondary research recent trends of body mass management was systematized and models analysing consumer attitudes and behaviours were collected.
T3: By the Transtheoretical Model of Behaviour Change I identified the rate of consumers within the society who have switched to healthy food consumption and do regular physical activity and they also maintain their habits, and it can be stated that in the stage of maintenance young men dominate and not young women.
T4: I assessed the Hungarian population’s satisfaction with their body mass and the direction changes were determined among those who want to change their body mass. The primary reasons for changing body mass, the body image attitudes of Hungarian population and the customers’ used and trustworthy information sources in order to find the possibilities to lose weight were identified.
30
6. PUBLICATIONS IN THE TOPICS OF DISSERTATION 1. Soós Mihály, Szabó Sára, Szakály Zoltán.
The characteristics of consumer attitudes in the food market in Hungary
APSTRACT 8:(2-3) (2014) IF: 0,03.
2. Soós Mihály, Szakály Zoltán.
Testtömeg-menedzselési attitűdök kvalitatív és kvantitatív vizsgálata hazánkban.
Élelmiszer, táplálkozás és marketing 10:(1-2) pp. 29-32 (2013) 3. Szakály Zoltán, Pető Károly, Soós Mihály, Szente Viktória
Az életstílus hatása az egészségmagatartás és a funkcionális élelmiszerek fogyasztására
Élelmiszer, táplálkozás és marketing 9:(1) pp. 3-12. (2013) 4. Szabó Sára, Soós Mihály, Szakály Zoltán
Alternatív táplálkozási módok fogyasztói megítélése
Magyar Táplálkozástudományi Társaság XXXVIII. Vándorgyűlése, Eger, 2013. október 3-5. (2013)
5. Soós Mihály, Szakály Zoltán
Testtömeg-menedzselési attitűdök Magyarországon In: Bényi E, Pajor F, Tőzsér J (szerk.)
IV. Gödöllői Állattenyésztési Tudományos Napok: Előadások és poszterek összefoglaló kötete. Konferencia helye, ideje: Gödöllő, Magyarország, 2013.10.24-2013.10.26. Gödöllő: Szent István Egyetem, Egyetemi Kiadó, 2013. p. 122.
6. Soós Mihály, Szakály Zoltán
Testtömeg-menedzselési attitűdök Magyarországon
IV. Gödöllői Állattenyésztési Tudományos Napok, Gödöllő, 2013.
október 25-26. (2013) 7. Soós Mihály
Mit eszik a magyar ember?
ÉLELMISZER: IPAR ÉS KERESKEDELEM 21:(11) pp. 46-47.
(2013)
31 8. Soós Mihály, Szakály Zoltán
Kiknek és miért fontos a testtömegük alakulása?
Magyar Táplálkozástudományi Társaság XXXVIII. Vándorgyűlése, Eger, 2013. október 3-5. (2013)
9. Soós Mihály, Szakály Zoltán
Hízni, vagy fogyni vágyik a magyar?
ÉLELMISZER: IPAR ÉS KERESKEDELEM 21:(4) p. 54. (2013) 10. Soós Mihály, Szente Viktória, Szabó Sára, Szakály Zoltán
A fogyni vágyók élelmiszer-fogyasztási attitűdjei - Hizlaló és nem hizlaló élelmiszerek és élelmiszer-összetevők
IX. Nemzetközi Táplálkozásmarketing Konferencia, Debrecen, 2013. november 21. (2013)
11. Soós Mihály, Szente Viktória, Szabó Sára, Szakály Zoltán
A fogyni vágyók élelmiszer-fogyasztási attitűdjei - Hizlaló és nem hizlaló élelmiszerek és élelmiszer összetevők [Food consumption attitudes of people on a diet - Obesing and non-obesing food and ingredients]
In: Fehér A, Huszka P., Jasák H., Soós M., Szabó S., Szendrő K.
(szerk.)
IX. Nemzetközi Táplálkozásmarketing Konferencia Összefoglalók:
Felelős marketing: hitelesség, bizalom, avagy a fogyasztónak mindig igaza van.. Konferencia helye, ideje: Debrecen,
Magyarország, 2013.11.21 Debrecen: Tóth Könyvkereskedés és Kiadó Kft., 2013. p. 25.
12. Soós Mihály, Jasák Helga, Szakály Zoltán
Az élelmiszer-fogyasztás és testtömeg-menedzselés kapcsolatának vizsgálata a hazai felnőtt lakosság körében [Examining connection between food consumption and body weight management among the hungarian adult population]
In: Troján Sz, Teschner Gergely (szerk.)
Hensch Árpád nyomdokain - A Gazdálkodásban publikált PhD hallgatók és kutatók III. Országos Tudományos Konferenciája. 83.
Konferencia helye, ideje: Mosonmagyaróvár, Magyarország, 2013.04.25 (Nyugat-Magyarországi Egyetem)
Mosonmagyaróvár: Nyugat-magyarországi Egyetem Mezőgazdaság- és Élelmiszertudományi Kar, 2013. p. 77.
32 13. Mihály Soós, Zoltán Szakály
Consumer’s Habits on the Body Mass-Managing
In: Szendrő Katalin, Soós Mihály, Nagy Miklós (szerk.) Abstracts of the 4th International Conference of Economic Sciences. 98 p.
Konferencia helye, ideje: Kaposvár, Magyarország, 2013.05.09- 2013.05.10. Kaposvár: Kaposvár University, 2013. p. 75.
14. Mihály Soós, Zoltán Szakály
Consumer’s Habits on the Body Mass-Managing
4th International Conference of Economic Sciences, Kaposvár, 2013. május 9-10., Poszter (2013)
15. Soós Mihály, Szakály Zoltán
Testtömeg-menedzselési attitűdök vizsgálata a lakosság élelmiszer- fogyasztásán és testmozgásán keresztül
In: Soós Mihály, Szakály Zoltán, Szigeti Orsolya, Szente Viktória, Polereczki Zsolt, Huszka Péter, Olsovszkyné Némedi Andrea, Fehér András (szerk.)
Táplálkozástudományi Kutatások II.: Innováció - Táplálkozás - Egészség - Marketing : Összefoglalók. 28 p.
Konferencia helye, ideje: Kaposvár, Magyarország, 2012.12.10- 2012.12.11. Kaposvár: Kaposvári Egyetem, 2012. p. 8.
16. Soós Mihály, Szakály Zoltán
Élelmiszer-fogyasztási és testtömeg-menedzselési attitűdök vizsgálata
In: Gilingerné Pankotai Mária, Gelencsér Éva, Lugasi Andrea, Horváth Zoltánné (szerk.)
A Magyar Táplálkozástudományi Társaság 37. vándorgyűlése:
Program, előadás összefoglalók. 35 p.
Konferencia helye, ideje: Balatonőszöd, Magyarország, 2012.10.04- 2012.10.06. Budapest: Magyar Táplálkozástudományi Társaság, 2012. p. 28.