Nonlinear Modeling of a Switched Reluctance Motor using LSSVM - ABC
Jebarani Evangeline Stephen
1, Selvaraj Suresh Kumar
2, Jayaraj Jayakumar
31 Department of Electrical and Electronics Engineering, Karunya University, Karunya Nagar, Coimbatore 641 114, Tamil Nadu, India;
jeba_eva@karunya.edu
2 Department of Electronics and Communication Engineering, Dr. N. G. P Institute of Technology, Dr. N. G. P Nagar, Kalapatti Road, Coimbatore 641 048, Tamil Nadu, India; hod_ece@drngpit.ac.in
3 Department of Electrical and Electronics Engineering, Karunya University, Karunya Nagar, Coimbatore 641 114, Tamil Nadu, India;
jayakumar@karunya.edu
Abstract: To enhance the performance of a Switched Reluctance Motor (SRM), it is essential to build a precise model of the machine. Due to its double salient structure, the model is nonlinear. It is complicated to develop a simple mathematical model for such nonlinear systems. However, owing to the advancements in kernel based learning methods for statistical learning and structural risk minimization,the use of Least Square Support Vector Machine (LSSVM) for function estimation is powerful and accurate, with less computations needed. The accuracy of the regression model and generalization ability depends upon the proper selection of hyperparameters of LSSVM. It is necessary to employ a meta-heuristic technique for the optimal values of hyperparameters. This paper presents a nonlinear flux modeling of SRM based on LSSVM regression optimized by Artificial Bee Colony (ABC) algorithm. The training and testing sample data are obtained by 2D FEA using MagNET software. It was analyzed that the tuning by ABC algorithms offers a high degree of accuracy when compared to the values obtained by Particle Swarm Optimization (PSO), Differential Evolution (DE) and Genetic Algorithm (GA).
Keywords: Switched Reluctance Motor; Magnetic Characteristics; Modeling; Least Square Support Vector Machine regression; Artificial Bee Colony Algorithm
1 Introduction
Switched Reluctance Motors are a smart alternative to the conventional induction motors and to the variable speed motor drive applications because of its high efficiency, low cost, rugged structure, fault tolerant capability and wide range of speed operations. Due to its doubly salient structure and magnetic saturation, its
flux linkage characteristics and torque characteristics are highly nonlinear and dependent on the rotor position and phase current [1]. It is difficult to model the SRM with accuracy due to its nonlinearity. To accurately model the SRM, there are three methods:
1) Analytical modeling
2) Finite-Element Analysis (FEA) method 3) Direct or Indirect measurement techniques.
The mathematical expression for flux linkage was developed using (i) the geometrical data of the machine [2-4] (ii) the magnetic equivalent circuit [5-6] and (iii) data from the FEA method [7-11]. A simple and traditional look up table approach is used to calculate the flux and torque values. The intermediate values of current and rotor position could be obtained using interpolation [12-17]. As the above method is time consuming and involves intensive computation, there is a possibility for tradeoff in accuracy. The nonlinear model of SRM was also developed with the traditional neural network (NNs) such as Back Propagation, Radial Basis Function, Polynomial Neural Network, Pi-Sigma Neural Network, etc. [18-22] Regardless of its advancement, the neural network model suffers fromthelocal minima solution, possibility of over fitting and dependency on quality and quantity of data.
In order to overcome the drawbacks of artificial neural networks, Support Vector Machine (SVM) was proposed. Like ANNs, SVM also can be used to solve both classification and regression problems. An SVM is a classifier derived from the statistical learning theory and was first introduced by Vapnik. In regression problems, a non-linear function is learned by a linear learning machine in a kernel induced feature space, while the capacity of the system is controlled by a parameter that does not depend on the dimensionality of the space [23]. The process of employing SVMs in regression problems is referred to as Support Vector Regression (SVR). The SVM has the capacity to prevent over fitting by the generalization theory. It can be formulated as a quadratic programming problem with linear inequality constraints. The Least Squares Support Vector Machine (LSSVM) is a least square version of SVM which considers the inequalities for classical SVM. As a result, the solution of LSSVM follows directly from solving a system of linear equations instead of quadratic programming, which makes LSSVM faster than SVM with reduced computational time [24-27]. LSSVM could also be used for classification and regression [23]. However, the accuracy of the regression model using LSSVM relies on the values of the hyper-parameters used. In the past, several reports were available for LSSVM based forecasting model, which is used in wide range of applications [29-34]. In this paper, the flux characteristics of the SRM are forecasted and the hyper-parameters are optimized using optimization techniques like Genetic Algorithm (GA), Particle Swarm Optimization (PSO) [35-37].
A four phase, 500W, 8/6 SRM was used for the present study. The static characteristics of the machine wereanalyzed usinga 2-D finite element method with MagNET software. In this paper, the nonlinear modeling of the Switched Reluctance Motor characteristics based on the LSSVM - ABC has been studied.
The hyper-parameters of the model were optimally selected using Artificial Bee Colony (ABC).The paper has been organized as follows: the mathematical model of SRM is briefed in section II. In section III, the basics of LSSVM and Artificial Bee Colony algorithm are discussed. In Section IV, the implementation of forecasted model using LSSVM – ABC is discussed. The results of the parameter optimization are given in section V.
2 Mathematical Model of SRM
The SRM is doubly salient with an unequal number of rotor and stator poles.
Torque is produced by the tendency of the rotor poles to align with poles of the excited stator phase and is independent of the direction of the phase current. The mathematical model of the SRM for flux and torque is very difficult to calculate due to its nonlinearity [1]. When neglecting the mutual inductance between the winding, the voltage equation for each phase is written as:
(1) where is the voltage applied across the phase winding, is thevoltage drop due to winding resistance and ψ is the total flux-linkage of the coil. If the saturation effect is neglected, the relation between flux (ψ) and current (i)is defined as follows:
( ) (2) Where ( ) is the phase inductance of the winding. Due to the double saliency of the machine, the inductance varies with the rotor position θ and current i.
The general expression for the torque produced by one phase at any given rotor position θ is:
( ) ( ( ) )
(3) Where is the co-energy. Co-energy can be calculated as:
( ) (∫ ( ) )
(4) Total instantaneous torque is given by the sum of the individual phase torques.
( ) ∑ ( ) (5)
Where is the number of phases in the machine. The electromagnetic dynamic model of the motor and the load are expressed as shown in (6)
(6) where is the load torque, J is the moment of inertia of rotating masses and B is the viscous friction coefficient. The load torque is a function of the angular speed, depending on the type of load.
3 Methodology
3.1 Least Square Support Vector Machine for Regression
A Russian scientist Vladmir N. Vapnik introduced the Support Vector Machine (SVM) based on the Statistical Learning Theory (SLT) and the Structural Risk Minimization principle. In SVM, the solutions are obtained by solving the set of nonlinear equations using Quadratic Programming (QP) and thereby avoiding the local minima. Suykens proposed a modified version of SVM known as Least Square Support Vector Machine (LSSVM) which transforms the quadratic optimization problem into a set of linear constraints. This can be specifically described as follows [24].
Consider the given set of training data (D)
{( ) } (7) Where N is the number of training data pairs, is the regression vector and is the output. The regression model is formulated by a nonlinear mapping function ( ) which maps the input data to a higher dimensional feature space.
( ) (8)
Where and b are the weight vector and bias respectively. The LSSVM can be used as both a classifier and function estimation. When it is used for function estimation, the quadratic loss function is taken as the cost function for optimization. The standardized cost function of LSSVM is
( ) ∑ (9) subject to the constraint
( ) (10)
Where is the desired error and is regularization parameter, which equates the model’s complexity and training error. A lagrangian is formulated to solve the above constrained optimization problem.
( ) ( ) ∑ { ( ) } (11) Where is the lagrange multiplier and it is otherwise known as support value.
The above equation can be solved by partially differentiating with respect to each variable and when equated to zero. With the removal of and , the Karush – Kuhn – Trucker (KKT) system is obtained as:
[ ] [ ] [ ] (12) with
[ ] [ ]
[ ] [ ]
{ | } ( ) ( ) ( ) Where ( ) is the kernel function and must satisfy Mercer’s condition. The commonly used kernel functions are linear, polynomial, radial basis function (RBF) kernel and multi-layer perceptron (MLP). In this paper, RBF kernel is used.
( ) ( | |) (13) In the above equation, is the kernel or bandwidth parameter.
The LSSVM regression function can be defined as:
( ) ∑ ( ) (14) The performance of the LS-SVM depends on a value of regularization parameter and the kernel parameters. These parameters determine the accuracy and generalization ability of LS-SVM model. Therefore, it is essential to optimize these parameters [28].
3.2 Artificial Bee Colony (ABC) for Parameter Optimization of LSSVM Model
To obtain the optimal hyper-parameters for LSSVM, the Artificial Bee Colony Algorithm (ABC) proposed by Karaboga is used [38-41]. It is a swarm based meta-heuristic algorithm used for numerical optimization. The methodof the ABC algorithm imitates the foraging behavior of a honey bee swarm. In the bee colony,
certain tasks are performed by specialized individuals. The principal task of the specialized bees is to identify the best food source which gives the maximum nectar amount in a self organized manner. The ABC model consists of three essential groups of bees: employed bees, onlooker bees and scout bees. The size of a colony depends on the number of employed bees and onlooker bees. The number of food sources/nectar sources equals half of the colony size. The aim of the whole colony is to maximize the nectar amount. Employed bees search for the food sources (solution) and each solution is a D-dimensional vector where D refers to the number of optimization parameters. The nectars’ amount (fitness value) is computed. The information obtained is shared with the onlooker bees which are waiting in the hive (dance area). The onlooker bees exploit a nectar source based on the information shared by the employed bees. The onlooker bees also determine the source to be abandoned and allocate its employed bee as scout bees. The task of the scout bees is to find the new valuable food sources. They search the space near the hive randomly.
The steps of the ABC algorithm are as follows:
1. Initialization Phase 2. Employed Bees Phase 3. Onlooker Bees Phase 4. Scout Bees Phase
5. Memorize the best solution achieved so far
6. until (cycle = maximum cycle number) proceed step2 else stop
Initialization Phase: The D-dimensional vector of the population of food sources are initialized (m = 1…SN, SN: Colony size) by scout bees and control parameters are set. Since each food source is a solution to the optimization problem, each vector holds n variables (n = 1….D, D: no of parameters to be optimized) which are to be optimized so as to minimize the objective function.
( ) ( ) (15) Where and are the lower and upper bound of the parameter respectively.
Employed Bees Phase: Employed bees search for new food source ( ⃗⃗⃗⃗ ) having higher nectar amount within the neighborhood of the food source ( ⃗⃗⃗⃗⃗ ) in their memory. The neighbor food source ( ⃗⃗⃗⃗ ) can be determined using the formula:
( ) (16) Where k and n are the randomly selected index for new solution and is a random number within the range [-1, 1]. Once the new solution is obtained, the fitness is calculated and the best solution is selected based on greedy selection method. The fitness value of the solution is calculated using the formula
{ ( ⃗⃗⃗⃗⃗⃗ ) ( ⃗⃗⃗⃗⃗ )
( ( ⃗⃗⃗⃗⃗ )) ( ⃗⃗⃗⃗⃗ ) } (17) Where ( ⃗⃗⃗⃗⃗ ) is the objective function value of solution ⃗⃗⃗⃗⃗ .
Onlooker Bees Phase: Employed bees share their food source information with onlooker bees waiting in the hive and then onlooker bees probabilistically choose their food sources depending on the information. The onlooker bee exploits a food source based on the probability of fitness. The probability of fitness can be calculated by using the formula:
∑ (18) Once a food source for an onlooker bee is chosen, a neighborhood is determined and its fitness value is computed and best solution is selected based on greedy selection methods.
Scout Bees Phase: Scout bees randomly choose their food sources. Employed bees whose solutions cannot be improved become scout bees and their solutions are abandoned. Then, the converted scouts start to search for new solution.
4 Experiment
4.1 Measurement of Flux Linkage
In nonlinear characteristics of the SRM, the value of flux and torque varies with the rotor position and phase current. Therefore, the knowledge about the values of flux and torque is essential for better control of the motor. Therefore, the flux and torque profiles of the machine can either be obtained using numerical computation or experimentally. Finite Element Analysis (FEA) is a powerful technique for obtaining the numerical solutions to the considered machine structure. The FEA can be conveniently used to obtain the magnetic vector potential values throughout the motor in the presence of complex magnetic circuit geometry and nonlinear properties of magnetic materials. This vector potential value A determines the magnetic field inside the motor using the Poisson’s equation.
( ) ( ) (19) Where is the magnetic reluctivity and is the current density vector. A 2D static field analysis was been carried out using a FEA based CAD package called MagNET. Since the number of rotor poles are six, the magnetic circuit becomes the same every 60˚ when only one phase is excited. The unaligned and aligned condition of stator and rotor poles occurs at every 30˚ interval. For the machine
considered, the aligned condition of the rotor occurs at 60˚ whereas, it is in unaligned position at 31˚. At a rotor position , the co-energy, torque and the flux linkage in the excited phase are noted down for different values of winding current.
4.2 Data Preparation
The specification of the four phase 8/6 SRM is given in Table 1. Since all the phases of the machine are identical to each other, it is sufficient to consider the data of one phase for analysis. For training data set of flux linkage characteristics, the rotor position and current i ranges from [0-5A] and [31°- 60°] respectively.
For testing data set, the rotor position and current i with an interval of 3˚ and 0.5A were considered for the analysis of the proposed model. To improve the accuracy of prediction model, input for training and testing data set, are normalized by Min-Max normalization procedure. In the Min-Max normalization, a linear transformation is performed on the original data values and values are mapped in the new interval [new_maxA, new_minA] using the formula (20).
( ) (20) 450 pair of samples were chosen for the training set and 154 pair of samples were considered for testing.
Table 1 Specification of the SRM
Parameter Value
Rated Output Power 500 [W]
Coil Voltage 150 [V]
Rated Current 3 [A]
Rated Speed 4000 [rpm]
Rated torque 4.5 [Nm]
Number of stator poles 8 Number of rotor poles 6
Figure 1 Field distribution of SRM
4.3 Parameter Tuning
In LSSVM regression, only two parameters have to be tuned (i.e. kernel parameter and regularization parameter ). The model performance and generalization ability depends upon these parameters. These parameters cannot be tuned separately. The main idea is to find the optimal parameter values with minimum prediction error. The prediction error can be calculated using leave-one-out cross validation on the training set. The optimization ranges for these parameters are defined arbitrarily. The following optimization algorithms have been used for tuning the parameters: Genetic Algorithm (GA), Particle Swarm Optimization (PSO), Differential Evolution (DE) and Artificial Bee Colony (ABC).
Figure 2
Torque Profile of SRM for various current
30 35 40 45 50 55 60
0 0.5 1 1.5 2 2.5 3 3.5 4 4.5 5
Rotor Position (Degrees)
Torque (Nm)
Torque Profile of SRM for various current
0.5A 1.0A 1.5A 2.0A 2.5A 3.0A
Figure 3
Flux linkage characteristics of SRM
4.4 Performance Evaluation
To obtain the perfect fit of the proposed regression model, the Mean Absolute Percentage Error (MAPE) is used as the objective function for the optimization processi.e., MAPE is used as main performance indicator. In addition, normalized mean square error (NMSE) is also used to evaluate the prediction error during the cross validation.
MAPE = [∑ | ̂|] (21)
NMSE = (∑∑ ( ( ̂)
̅) ) (22)
Where and ̂ is the actual value and forecasted values respectively, ̅ is the average of actual data and n is the number of data. For a good fit, the value of MAPE and NMSE should be closer to zero.
5 Result
The proposed algorithm was implemented using MATLAB R2010a and the relevant codes were developed and processed on a 3.0 GHz Intel Pentium IV PC with 2.0 GB RAM under the Windows XP environment. In order to verify the efficiency of the proposed regression model, the results were compared with other prediction models such as LSSVM, LSSVM-GA, LSSVM-PSO and LSSVM-DE.
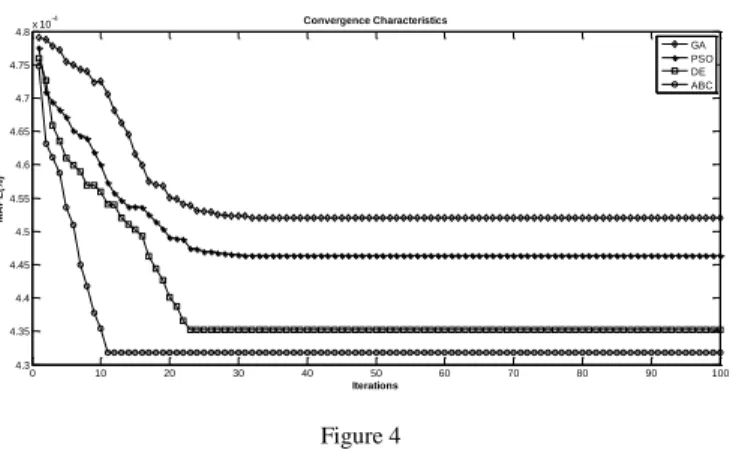
The hyper parameters of the LSSVM are well tuned usingthe ABC algorithm. The minimal fitness value (shown in Figure 4) was achieved after 11 iterations with the value of C=3545.88 and =0.04512 with a mean absolute error of 0.066% and mean relative error of 0.379x .
0 0.5 1 1.5 2 2.5 3 3.5 4 4.5 5
0 0.1 0.2 0.3 0.4 0.5 0.6 0.7 0.8
Current (Amperes)
Flux (Webers)
Flux Linkage Characteristic of SRM at various rotor position
Unaligned Rotor Position Aligned Rotor Position
Figure 4 Convergence Characteristics
Table 2 (a)
Comparison of optimized parameters and its performance indicators
Model Method C MAPE NMSE
Flux Linkage
LSSVM 3173.08 0.05890 5.310x 2.337x LSSVM - GA 3384.71 0.04835 4.521x 1.885x LSSVM - PSO 3534.92 0.04796 4.463x 1.857x LSSVM - DE 3539.63 0.04591 4.352x 1.774x LSSVM - ABC 3545.88 0.04512 4.318x 1.741x
Figure 5
(a). MAPE (%) of predicted output at different rotor position (b). NMSE of predicted output at different rotor position
0 10 20 30 40 50 60 70 80 90 100
4.3 4.35 4.4 4.45 4.5 4.55 4.6 4.65 4.7 4.75
4.8x 10⁻⁴
Iterations
MAPE(%)
Convergence Characteristics
GA PSO DE ABC
0 5 10 15 20 25 30
1 2 3 4 5x 10⁻⁴
MAPE(%)
Rotor Angle (Degrees) A. MAPE of Predicted Model at different rotor position
0 5 10 15 20 25 30
1 1.5 2 2.5 3 3.5
4x 10⁻⁷
Rotor Angle (Degrees)
NMSE(%)
B. NMSE of Predicted Model at different rotor position
Table 2 (b)
Comparison of errors for the optimized parameters
Model Method C
Average Absolute error (%)
Average Relative error (%)
Flux Linkage
LSSVM 3173.08 0.05890 0.082 0.656x LSSVM - GA 3384.71 0.04835 0.070 0.619x LSSVM - PSO 3534.92 0.04796 0.069 0.577x LSSVM - DE 3539.63 0.04591 0.067 0.493x LSSVM - ABC 3545.88 0.04512 0.066 0.379x Due to the fine tuning of LSSVM parameters by LSSVM–ABC, it is observed from Table 2 that the value of MAPE is decreased to 4.318x and NMSE is decreased to 1.741x %. The MAPE absolute error at various rotor positions are shown in Figure 5(a) and the NMSE at rotor position is shown in Figure 5(b). As the value of mean absolute error is less with LSSVM-ABC, the proposed regression model gives a high degree of accuracy and the output is highly precise.
Conclusions
Apposite values for regularization parameters are essential to Least Squares Support Vector Machines (LS-SVM) which result in better learning and generalization abilities. This paper presents a novel parameter optimization method for LS-SVM based on an Artificial Bee Colony (ABC) algorithm. The LSSVM – ABC gives better forecast of flux values of the SRM at various rotor angles. Due to the ability for global search, ABC algorithm does not to consider LS-SVM dimensionality and complexity. The proposed method proves to be an effectiveapproach for fitting the values with an improved statistical result.
Acknowledgement
The authors wholeheartedly thank the management of Karunya University (Karunya Institute of Technology & Sciences), Coimbatore for providing necessary facilities. The authors would like to acknowledge the support and guidance given by Mr. R. Karthikeyan, Associate Professor, Sri Venkeswara College of Engineering, Sripermabadur, Chennai during the FEM analysis of SRM using MagNET.
References
[1] T. J. E. Miller: Electronic Control of Switched Reluctance Machines,Newnes Power Engineering Series, Newnes Publishers, Oxford, 2001
[2] S. A. Hossain,I. Husain: A Geometry Based Simplified Analytical Model of Switched Reluctance Machines for Real-Time Controller Implementation, IEEE Transactions on Power Electronics, Vol. 18, No. 6, 2003, pp. 1384- 1389
[3] V. Radun: Analytically Computing the Flux Linked by a Switched Reluctance Motor Phase When the Stator and Rotor Poles Overlap, IEEE Transactionson Magnetics, Vol. 36, No. 4, 2000, pp. 1996-2003
[4] H. C. Lovatt: Analytical Model of a Switched-Reluctance Motor, IEE Proceedings on Electrical Power Applications, Vol. 152, No. 2, 2005, pp.
352-358
[5] J. M. Kokernak, D. A. Torrey: Magnetic Circuit Model for the Mutually Coupled Switched Reluctance Machines, IEEE Transactions on Magnetics, Vol. 36, No. 2, 2000,pp. 500-507
[6] M. A. Preston, J. P. Lyons: A Switched Reluctance Motor Model with Mutual Coupling and Multi-Phase Excitation, IEEE Transactions on Magnetics, Vol. 27, No. 6, 1991, pp. 5423-5425
[7] C. Roux, M. M. Morcos: A Simple Model for Switched Reluctance Motors, IEEE Power Engineering Review, Vol. 20, No. 10, October 2000, pp. 49-52 [8] I. A. Viorel, L. Strete, I. Husain: An Analytical Model of Switched
Reluctance Motor Based on Magnetic Field Analysis Results, Proceedingsof 3rd International Symposium on Electrical Engineering and Energy Converters, Suceava, Romania, 2009, pp. 97-100
[9] C. Ong, M. Molloam: Predicting the Steady-State Performance of a Switched Reluctance Machine, Proceedings of Conference Record of the 1989 IEEE Industry Applications Society Annual Meeting, Vol. 1, 1989, pp. 529-537
[10] E. Afjei, K. Navi, S. Ataei: A New Two Phase Configuration for Switched Reluctance Motor with High Starting Torque, Proceedings of 7th International Conference on Power Electronics and Drive Systems, PEDS
’07, 2007, pp. 517-520
[11] S. F. Ghousia, Narayan Kar: Performance Analysis of an 8/6 Switched Reluctance Machine using Finite-Element Method, Proceedings of IEEE Power Engineering Society General Meeting, 2007, pp. 1-7
[12] B. Fahimi, G. Suresh, J. Mahdavi, M. Ehsami: A New Approach to Model Switched Reluctance Motor Drive Application to Dynamic Performance Prediction, Control and Design, Proceedings of 29th Annual IEEE Power Electronics Specialists Conference PESC-98, Fukuoka, Vol. 2, 1998, pp.
2097-2102
[13] H. P. Chi, R. L. Lin, J. F. Chen: Simplified FluxLinkage Model for Switched Reluctance Motors, IEE Proceedingof Electrical Power Applications, Vol. 152, No. 3, 2005, pp. 577-583
[14] J. M. Stephenson, J. Corda: Computation of Torque and Current in Doubly Salient Reluctance Motors from Nonlinear Magnetization Data, Proceeding ofInstitution of Electrical Engineers, Vol. 126, No. 5, 1979, pp. 393-396
[15] D. W. J Pulle: New Database for Switched Reluctance Drive Simulation,Proceeding of IEE proceedings B on Electric Power Applications, Vol. 138, No. 6, 1991, pp. 331-337
[16] D. A. Torrey, J. H. Lang: Modeling a Nonlinear Variable Reluctance Motor Drive, Proceeding of IEE proceedings B on Electric Power Applications, Vol. 137, No. 5, 1997, pp. 314-326
[17] P. Chancharoensook, M. F. Rahman: Dynamic Modeling of a Four-phase 8/6 Switched Reluctance Motor using Current and Torque Look-up Tables, Proceeding of 28th Annual Conference of the Industrial Electronics Society, Vol. 1, 2002, pp. 491-496
[18] C. Elmas, S. Sagiroglu, I. Colak, G. Bal: Modeling of a Nonlinear Switched Reluctance Drivebased on Artificial Neural Networks,Proceedings on 5th International Conference on Power Electronics and Variable-Speed Drives, London, 1994, pp. 7-12
[19] W. Z. Lu, A. Keyhani, A. Fardoun: Neural Network based Modeling and Parameter Identificationof Switched Reluctance Motors, IEEE Transactions on Energy Conversion, Vol. 18, No. 2, 2003, pp. 284-290
[20] T. Lachman, T. R. Mohamad, C. H. Fong: Nonlinear Modeling of Switched Reluctance Motors using Artificial Intelligence Techniques, IEE Proceedings on Electric Power Applications, Vol. 151, No. l, 2004, pp. 53- 60
[21] Yan Cai, Qingxin Yang, Yanbin Wen, Lihua Su: Nonlinear Modeling and Simulating of Switched Reluctance Motor and its Drive, Proceedings of the 2nd International Conference on Computer and Automation Engineering (ICCAE), Singapore, Vol. 3, 2010, pp. 465-469
[22] R. Vejian, N. C. Sahoo, R. Gobbi: Mathematical Modeling of Flux Linkage Characteristics of Switched Reluctance Motors using Polynomials Neural Networks, Proceedings of IEEE International Power and EnergyConference, Kuala Lumpur, 2006, pp. 378-382
[23] V. Vapnik: The Nature of Statistical Learning Theory, Springer-Verlag, New York, 1995
[24] J. A. K. Suykens, T. VanGestel, J. De Brabanter, B. De Moor, J.
Vandewalle: Least Squares Support Vector Machines,World Scientific, Singapore, 2002
[25] J. Valyon, G. Horváth: ExtendedLeast Squares LS-SVM,International Journal of Computational Intelligence, Vol. 3, 2007, pp. 234-242
[26] L. Jun: Identification of Dynamic Systems using Support Vector Regression Neural Networks, Journal of Southeast University, Vol. 22, No.
2, 2006
[27] Bahman Mehdizadeh, KamyarMovagharnejad: A Comparative Study Between LS-SVM Method and Semi Empirical Equations for Modeling the Solubility of Different Solutes in Supercritical Carbondioxide, Chemical Engineering Research and Design, Vol. 89, No. 11, 2011, pp.
2420-2427
[28] Xie, Chunli, Cheng Shao, Dandan Zhao: Parameters Optimization of Least Squares Support Vector Machines and its Application, Journal of Computers, Vol. 6, No. 9, 2011, pp. 1935-1941
[29] P. Pingfeng, H. Weichiang: Forecasting Regional Electricity Load based on Recurrent Support Vector Machines with Genetic Algorithms, Electric Power Systems Research, Vol. 74, No. 3, 2005, pp. 417-425
[30] Yuansheng Huang, Jiajia Deng: Short-term Load Forecasting with LS- SVM Based on Improved Ant Colony Algorithm Optimization, Journal of Computational Information Systems, Vol. 6, No. 5, 2010, pp. 1431-1438 [31] ZurianiMustaffa, YuhanisYusof: A Hybridization of Enhanced Artificial
Bee Colony-Least Squares Support Vector Machines for Price Forecasting, Journal of Computer Science, Vol. 8, No. 10, 2012, pp. 1680-1690
[32] ZurianiMustaffa, YuhanisYusof: Optimizing LSSVM using ABC for Non-Volatile Financial Prediction, Australian Journal of Basic and Applied Sciences, Vol. 5, No. 11, 2011, pp. 549-556
[33] L. Yu, H. Chen, S. Wang, K. K. Lai: Evolving Least Squares Support Vector Machines for Stock Market Trend Mining, IEEE TransactionsonEvolutionary Computation, Vol. 13, No. 1, 2009, pp. 87-102 [34] Fazeli, Hossein, Reza Soleimani, Mohammad Ali Ahmadi, Ramin Badrnezhad, Amir H. Mohammadi: Experimental Study and Modeling of Ultrafiltration of Refinery Effluents, Energy & Fuels, Vol. 27, No. 6, 2013, pp. 3523-3537
[35] S. Linyun, L. Hui, L. Zhen: Modeling of Switched Reluctance Motors based on LS-SVM,Chinese Society for Electrical Engineering, Vol. 27, No.
6, 2007, pp. 26-30
[36] Wanfeng Shang, Shengdun Zhao, YajingShen: Application of LSSVM with AGA Optimizing Parameters to Nonlinear Modeling of SRM, Proceeding of 3rd IEEE Conference on Industrial Electronics and Applications, Singapore, 2008, pp. 775-780
[37] Qianwen Xiang, Yukun Sun, XiaofuJi: Modeling Inductance for Bearingless Switched Reluctance Motor based on PSO-LSSVM, Chinese Control and Decision Conference (CCDC), Mianyang, 2011, pp. 800-803 [38] DervisKaraboga, B. Basturk: A Powerful and Efficient Algorithm for
Numerical Function Optimization: Artificial Bee Colony (ABC) Algorithm, Journal of Global Optimization, Vol. 39, No. 3, 2007, pp. 459-471
[39] Dervis Karaboga: Artificial Bee Colongy Algorithm, Scholarpedia, 5(3):6915
[40] Dervis Karaboga: A Comprehensive Survey: Artificial Bee Colony (ABC) Algorithm and Applications, Artificial Intelligence Review, March 2012 [41] DervisKaraboga, BahriyeAkay: A Comparative study of Artificial Bee
Colony Algorithm, Applied Mathematics and Computation, Vol. 214, 2009, pp. 108-132