SOLUTE UPTAKE AND MEMBRANE TRANSPORT BY MONONUCLEAR PHAGOCYTES
Phyllis R. Strauss
I. INTRODUCTION
The transport of small nutrients, both electrolytes and nonelectrolytes, is a membrane function that also serves as an excellent indicator of cell health. In addition, knowledge of transport is important to the worker interested in macromolecu- lar biosynthesis, degradation, or turnover because these pro- cesses withdraw from or feed into intracellular precursor pools.
Specific activity of pools, in turn, depends on the rate at which small molecules enter and leave. Thus, alteration in in-
flux, which feeds the pool, or efflux, which bleeds the pool, during the course of an experiment may alter the pool's size or its specific activity, thereby altering apparent rates of synthesis or degradation.
The total amount of solute that a cell accumulates during any interval is the reflection of a number of dynamic processes.
These include: (1) influx of the solute across the plasma mem- brane by one of several mechanisms described below; (2) trapping
METHODS FOR STUDYING Copyright © 1981 by Academic Press, Inc.
MONONUCLEAR PHAGOCYTES 9 0 9 All rights of reproduction in any form reserved.
ISBN 0-12-044220-5
by metabolic conversion to a product that can no longer pene- trate the membrane, e.g., phosphorylation of nucleosides or in- corporation of amino acids into protein; (3) efflux of the solute out of the cell. The term uptake is used to denote the sum of all of these processes. Only the first and third compo- nents, influx and efflux, involve movement across the plasma membrane. In the discussion that follows, methods are presented that make it possible to dissect the flux component from subse- quent metabolic steps. The principle in both methods is rapid separation of incubation medium from cells.
Small molecules enter and leave the cell primarily via two processes. One is passive diffusion, which is nonspecific and nonsaturable. The other is a carrier-mediated process known as facilitated diffusion. I shall refer to the second as transport and stress that measuring transport requires measuring movement of solute from one side of membrane to the other. In other words, this represents flux, which in animal cells often re- quires extremely rapid measurements as short as or shorter than 4 sec. Neither of these processes requires energy or concentra- tes permeant against a gradient inside the cell. It is also presumed that permeant metabolism such as the phosphorylation usually occurs after influx. The energy-requiring process known as active transport, which concentrates permeant inside the cell against a gradient, probably uses the same membrane carriers as are used by facilitated diffusion. The reader is referred to Heinz (1) for further consideration of active transport. It should be emphasized that active transport refers to accumula- tion of unmetabolized permeant.
Two methods are described here, one suitable for cells that adhere rapidly to glass and the other for cells in suspension.
The first has been applied to rabbit ( 2 - 6 ) and mouse (7) pha- gocytes; the second has been applied to rabbit phagocytes (6) as well as mouse lymphocytes (8, 9 ) . Both methods differentiate passive diffusion from carrier-mediated transport at all time intervals.
For detailed discussions of membrane transport processes in eukaryotic cells, the reader is referred to several recent re- views: Heinz (1) and Kotyk and Janecek (10) on theoretical as- pects, Guidotti (11) and Christensen (.12) on amino acid trans- port, Paterson (13), Berlin (14), and Plagemann (15) on nucleo- side transport, and Hatanaka (16) on sugar transport. The in- vestigator should keep in mind that many solutes are transported by several systems. This is particularly true of amino acids in certain cultured cells (12).
I I . REAGENTS
A. Transport by Adherent Cells
(1) Circulating water bath(2) Transport box (2) to ensure maintenance of desired temperature. The box consists of a Plexiglass base
(39 x 26 x 6.5 cm^) with a copper plate (0.6 cm thick) as the top surface. Two water inlets on the back of the box are con- nected to the water bath that circulates water at a controlled temperature. A hollow Plexiglass cover (37.4 x 13.9 x 5.0 cm3) serves to create a temperature-controlled space over the rear area of the copper plate, since water from the circulating bath is also allowed to flow through the top of the cover. A wet paper towel is placed on the surface of the copper plate under the cover to provide humidity. Aluminum bars (33.5 x 0.9 x x 0.3 cm3) serve to move groups of monolayers from one area of the box to the other.
(3) Round microscope coverslips, 22 or 12 ram in diameter, No. 2 thickness
(4) Forceps (reverse action)
(5) Radioactive transport substrate repurified by one of several ascending paper chromatography systems described by Fink et al. (17). The strip corresponding to the unlabeled standard is cut out and the purified radiolabeled compound eluted in a very small volume (less than 1 ml) of water or phosphate-buffered saline (PBS).
(6) Transport test solutions, prewarmed to the desired tem- perature in the water bath. One half ml solution is allocated for each 22 mm coverslip. While concentrations of permeant in different solutions are chosen and prepared in PBS as described below, the amount of repurified radioisotope is "maintained at 1 - 2 yCi/ml.
(7) Stopwatch
(.8) 0.5 N KOH containing phenol red indicator (.9) 10% Perchloric acid (PCA)
(10) Scintillation vials, wide mouth, low potassium glass (Rochester Scientific, Rochester, New York)
(11) Scintiverse (Fisher Scientific, Medford, Massachusetts) or other scintillation cocktail that will absorb at least 1.5 ml water per 10 ml cocktail
(12) Scintillation counter
S. Transport by Cells in Suspension
(1) Water bath(2) Microfuge at room temperature
(3) 400-yl Polyethylene microfuge tubes (Brinkman Instru- ments, Westbury, New Y o r k ) . The tubes should be checked b e - cause some varieties form hairline cracks during the final cen- trifugation.
(4) Silicone oil mixtures: mixture of Dow Corning silicone oil 550 and 510 (4:6) or Dow Corning silicone oil 550 and 556
(1:1), well mixed daily (see Section III.E) (5) 10% Perchloric acid (PCA)
(6) Fisher fibrin tips and Fibrin gun (Fisher Scientific, Medford, Massachusetts)
(7) Isotope previously repurified as described above.
(8) Transport test solutions prewarmed to the desired tem- perature in the water bath. Three tenths ml solution is pre- pared for each determination. The concentration of permeant and radioisotope individually should b e 3/2 the desired final concentration. While the permeant concentration may vary, the amount of repurified radioisotope in the test solution is main- tained at 4 - 6 yCi/ml.
(9) - (14) As above, Section H . A . (7) - (12)
C. Intracellular Volume Measurements
(1) H20 , Originally at 25 mCi/ml (Schwartz-Mann, Orange- burg, New Y o r k ) , diluted to 1.25 mCi/ml with distilled water.
(2) [1 4c] Sucrose, about 500 mCi/mM (Schwartz-Mann, Orange- burg, New York).
(3) Test solution for a standard experiment consisting of 5 different cell concentrations, each examined in quadrupli- cate: 60 pi 3H2° ' 6 0 0 ^1 14C-sucrose, 6000 yl buffer.
III. PROCEDURES
A. Transport by Adherent Cells Determined by the Coverslip Method
Macrophages are washed three times in phosphate-buffered saline (10 mM PO4 pH 7.4; 0.15 Ji NaCl) and resuspended at 6 x 10^ cells/ml for subsequent adherence to 22 mm coverslips.
Four coverslips for each point are placed on an aluminum bar located in the humidity controlled back of the transport box.
One half ml cell suspension is applied to each coverslip and allowed to incubate 30 min. If smaller coverslips are used, the volume applied will be smaller and the corresponding num- ber of cells per milliliter must be greater to attain the same final number of cells on each coverslip. After 30 min virtually
all the cells attach and will remain so despite vigorous washing in multiple changes of PBS, either at 0°C or at room tempera- ture. The bar is then brought to the front of the box without disturbing the monolayers. Each coverslip is drained on paper towels to remove excess medium and replaced on the bar. The coverslips are handled by means of forceps. The transport test is initiated immediately by dripping test solution previously warmed to 37°C onto the monolayer as the stopwatch is started.
Several seconds before the end of the test, the monolayer is drained of the test medium. The uptake process is terminated at the desired moment by dipping the cover slip into iced PBS and rinsing vigorously through four changes of iced PBS. After the back of the coverslip is wiped, the monolayer is placed face up inside the cover of a scintillation vial. Upon drying, the glass is crushed and tapped gently into the scintillation vial. If smaller coverslips are used, they can be placed di- rectly into the scintillation vial without crushing.
Cellular material is digested with 1.0 ml of 0.5 N KOH con- taining phenol red for at least 30 min at room temperature.
The base is neutralized by dropwise addition of 10% PCA. After After the scintillant (10 ml) is added, the vial is capped and vigorously shaken. Scintillation spectrometry should in- clude efficiency determinations for each vial since significant quenching of tritium can occur under these conditions. In this laboratory efficiencies range between 25 - 42% under these con- ditions. Aliquots (10 μΐ) of each transport test solution must also be counted under the same conditions in order to determine actual dpm/mole in the transport test solution.
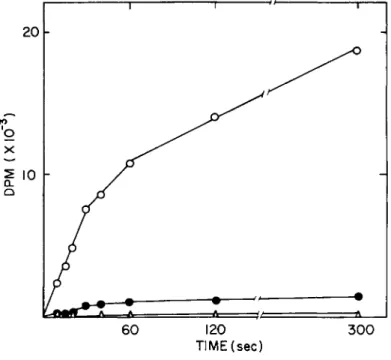
Initial experiments should determine (1) whether there is time-dependent association of radiolabeled permeant (see Fig. 1 ) , and (2) how much of the uptake of substrate is due to passive diffusion and how much can be assigned to a carrier-mediated process, (see Figs. 1 and 2 ) . Monolayers in quadruplicate are incubated for 4, 8, 12, 16, 20, and 60 sec with radiolabeled substrate at a low concentration, 10 or 20 \iM (1-2 pCi/ml) ; an intermediate concentration, usually 100 μΜ ( 1 - 2 yCi/ml);
and a high concentration 10 or 20 mM (1-2 uCi/ml). At this stage in the project, cell-associated radioactivity at the low- est specific activity (0.1 - 0.2 mCi/mW) is assumed to repre- sent nonspecific, nonsaturable, and noncarrier-mediated pro- cesses. Thus, these dpm at each time interval can be sub- tracted from dpm that are cell associated at lower concentra- tions over the same time interval. In Fig. 1 the open circles represent uptake measured at 20 μΜ; the closed circles indicate uptake measured at 1000 ]iM and the open triangles indicate cell- associated radiolabel when the external concentration was 20 mM.
The last is interpreted as the diffusion control. The assump- tion is verified in later experiments when concentration de- pendence is examined.
120 TIME (sec)
Fig. 1. Time dependence of phenylalanine uptake (total radiolabel). Phenylalanine uptake by 3
x10$ macrophages was measured at external phenylalanine concentrations of 20 yM (ο) , 1000 \iM ( · ) and 20,000 \xM (à). Total cell associated radio- label after thorough washing is presented as a function of time.
Initial rates hold for about 30 sec. At early times the radio- label, which is cell associated at 20 mM ( Δ ; , comprises a greater percentage of the uptake measured at lower concentra- tions than at later times.
The radioactivity per unit volume should be the same at all the substrate concentrations. However, small differences in the dpm/ml can be accommodated by calculation. For example, the transport test solution may be 50,000 dpm/10 yl, while the diffusion test solution may be 60,000 dpm/10 yl. Therefore, the radioisotope, which is cell-associated at 10 mM, must be multiplied by 1.2 before the subtraction is carried out. The diffusion component usually represents 2 - 8% of the cell- associated radiolabel when the external concentration of the permeant is the low Km concentration. The difference between total cell-associated dpm and dpm that are cell-associated at
300
m
"ω m o- 200
X ro
\ (0 Φ o
E Q .
UJ X
°- 100
1 1 Γ~Ί
J
^ _ _ _ _ ·
έ _ i i i_J
60 120 300
TIME(sec)
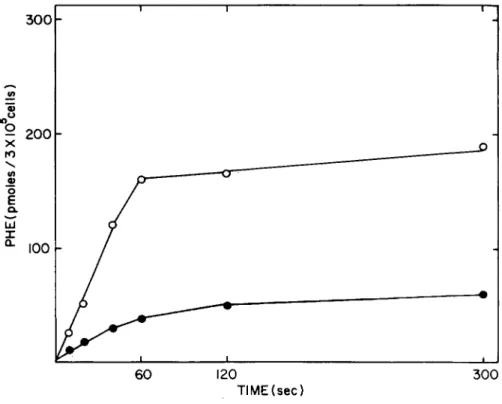
Fig. 2. Time dependence of phenylalanine transport. In an experiment similar to the one presented in Fig. 1, the dpm which are cell associated at 20 mM external phenylalanine have been subtracted from cell-associated radiolahel at lower concentra- tions. The remainder has been converted to pmoles transported by 3 x 10
5cells. (·), 20 \xM phenylalanine; ( °), 1000 \iM phenylalanine. In this figure it is clear that initial rates hold for no longer than 30 sec.
the lowest specific activity (normalized) is used to calculate moles of permeant transported. The difference is divided by the specific activity (dpm/mole) of the transport test solution.
If there is no difference, no measurable carrier-mediated trans- port has occurred. Figure 1 represents total uptake (dpm) for phenylalanine uptake by adherent normal rabbit lung macrophages at three different concentrations. Figure 2 represents similar data after the noncarrier-mediated component has been subtracted and after the data are converted to pmoles transported/3 x 10^
cells.
After determining that a time-dependent, saturable pro-
cess occurs, one can select a sampling time well within the
linear portion of the uptake process for all substrate concen-
trations to be tested. On the basis of data presented in Figs. 1 and 2, 20 sec was chosen as an appropriate interval.
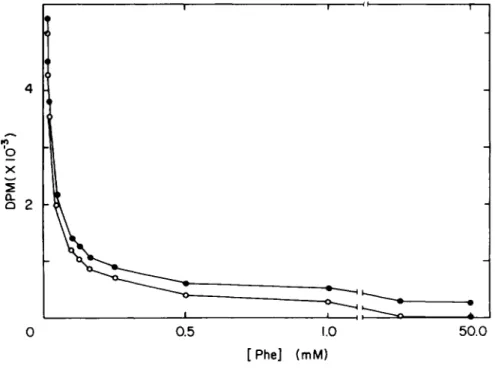
To determine the concentrati on dependence of the process , so- lutions are prepared so that the amount of radiolabeled sub- strate per milliliter is held constant while the amount of un- labeled substrate is increased. As shown in Fig. 3 for phenyl- alanine transport by normal rabbit lung macrophages, cell- associated radioactivity decreases as substrate concentration increases; above 10 mM there is no further diminution in the radioactivity that is cell-associated (closed circles). Thus, those counts are considered as the nonsaturable component, rep- resenting diffusion - adsorption. The dpm due to diffusion are subtracted from the curve to give the saturable component (open circles). In this experiment the diffusion component was de- termined at 20 mM and represented 6% of cell-associated radio- label at 20 sec when the external concentration was 25 yAf.
o X
& 2
[Phe] (mM)
Fig. 3. DPM dependence on external phenylalanine concen- tration» Total cell associated radiolabel after a 20-sec incu- bation is measured at different phenylalanine concentrations
(* ) . Above 10 mM phenylalanine no further diminution in cell-
associated radiolabel occurs. Those counts, which are still
cell-associated, are viewed as nonsaturable and are subtracted
from each point, leaving the carrier-mediated component (o).
0.5
[Phe] (mM)
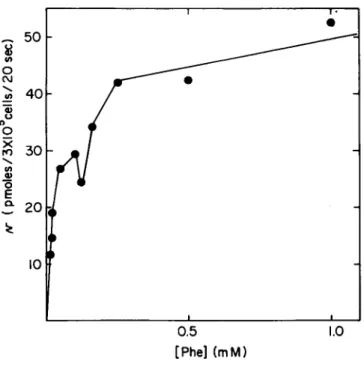
Fig. 4. The data presented in Fig. 3 are converted to pmoles transported/20 sec - 3 x 10$ cells from the calculated specific activities of the individual transport test solutions.
After the specific activity of each transport test solution has been calculated, the dpm due to the saturable component is con- verted to pmoles transported. These values are then plotted as a function of external concentration (Fig. 4). If there is a single transport system for the substance under study, the ex- pected hyperbolic curve is smooth. It is clear that for phenyl- alanine transport in these cells the hyperbolic curve is dis- continuous, indicating that two K s may be present (see below).
At this point, standard methods for handling data for
enzyme-mediated processes are followed to obtain a Lineweaver-
Burke plot, Eadie - Scatchard plot, or Wolf - Augustinsson
plot (18) in order to calculate K and V for the transport
system. The presence of more than one system is suggested by
the shape of the concentration versus velocity curve and by
the specificities of the transport system for chemically related
compounds (1, 8, 9, 18, 19). Ultimate proof requires genetic
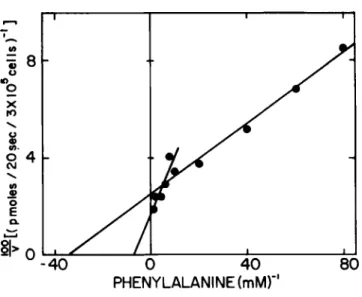
-40 0 40 PHENYLALANINEimM)" 80
Fig. 5. The data presented in Figs. 3 and 4 are trans- formed by the method of Lineweaver-Burke to obtain a standard reciprocal plot. The calculated K
mare 30 ]iM and 200 ]iM and the corresponding V
maxare 40 pmoles/20 sec - 3 x 10$ cells and 72 pmoles/20 sec - 3 x 10$ cells, respectively.
analysis using mutant cells. Figure 5 represents the data in Fig. 4 presented as a Lineweaver-Burke Plot.
In order to determine whether the permeant has been concen-
trated against a gradient, it is necessary to determine the
intracellular aqueous volume in order to determine the intra-
cellular concentration, and to establish whether the substrate
has been metabolized. Since it has proven extremely difficult
to measure intracellular volumes for monolayers (6, 20), the
determination is usually performed on cells in pellet. There-
fore, methods of determining intracellular volume are described
in Section III.C.
B. Transport by Cells in Suspension as Determined by the Oil Microfuge Method
The sequence of experiments to be performed is the same as that described above. The major difference is that medium that is not cell-associated remains above the oil, while cells pass through the oil into the tip of the Microfuge tube. Some medium comigrates through the oil, possibly as an aqueous shell around the cells. Thus, the nonspecific, nonsaturable component will reflect trapped medium as well as passive diffusion and nonspecific adsorption. It will represent a larger percentage of the total cell-associated radioactivity in the oil Microfuge method than in the coverslip technique.
Microfuge tubes are prepared in advance of the experiment.
After the cap has been removed, 40 μΐ 10% PCA is placed in each 40 yl Microfuge tube by means of a 1-ml syringe with 22-gauge needle. Well-mixed silicone oil (150 yl) is layered over the PCA by means of a 1-ml syringe with 18-gauge needle. The tubes are spun for 5 - 20 sec so that the oil and acid layers separate and sediment to the bottom.
Cells (1 x 10^ cells in 0.1 ml) are dispensed into small vessels suspended in a water bath at 37°C and allowed to incu- bate for 1 0 - 1 5 min. We have found that Eppendorf holders for large (1.5 ml) Microfuge tubes can be mounted easily on top of test tube racks in the water bath and secured with string. The 1.5-ml Microfuge tubes then make excellent incubation vessels.
At 0 time, 0.2 ml of prewarmed test solution containing 4 - 6 yCi/ml radiolabeled permeant at 3/2 the desired concentration is added to the cells by means of the Fisher fibrin tip hand gun. To ensure adequate mixing, the suspension is drawn rapidly into the pipette 2 - 3 times. Several seconds before the end of the desired time interval, 0.2 ml of the reaction mixture is re- moved and layered on top of the silicone oil in the Microfuge tube already seated in the Microfuge. At the appropriate time, the Microfuge is started and the tubes are spun for 20 sec.
Cells migrate through the oil into the tip, leaving noncell-
associated radiolabel above the oil. Controls (8) have shown
that virtually all the cells can be recovered intact in the tip
when 10% sucrose is used instead of 10% PCA; no radiolabel
passes into the tip unless cells are present; the viability of
the cells that migrate through the oil into 10% sucrose is the
same as that before their exposure to oil as determined by try-
pan blue exclusion; and, finally, during the transport test the
amount of radiolabel recovered in the tip is a direct function
of the number of cells applied. The tip of the 400 yl tube is
cut off with a razor blade just above the oil - acid interface
and allowed to drop into a scintillation vial. After the vial
is shaken vigorously to dislodge the contents in the tip,
1.0 ml 0.5 N KOH containing phenol red is added. Subsequent manipulations are the same as those described above.
C. Intracellular volumes
Intracellular volume measurements on cells in suspension are readily performed by means of the oil Microfuge method
(6, 8, 9 ) . H2O is used to measure total pellet volume (intra- cellular plus extracellular) and [l^c]sucrose is used to measure extracellular volume (6, 8, 9 ) . [l^cjinulin may also be used instead of sucrose but must be repurified before each use be- cause it degrades to fructose at an appreciable rate; fructose may be taken up rapidly into the cell by carrier-mediated trans- port systems. The use of sucrose as an extracellular marker presupposes that sucrose is not pinocytosed to a significant extent within 30 - 60 sec.
Cells are prepared at five different concentrations, 3 x 1 07 ml, 2.25 x 10⁷/ml, 1.5 x 10⁷/ml, 0.75 x 10⁷/ml, and 0.375 x 10⁷/ml, and stored at 4°C. Each determination is made in quadruplicate. Samples of 100 yl at each concentration are prewarmed in incubation vessels. Two hundred yl doubly labeled isotope solution is added and mixed by means of a Fisher fibrin tip gun. The cells remain exposed to the mixture for 30 or 60 sec and then are separated by means of the oil Microfuge method. Pellets are treated as described above. In this case the windows on the scintillation counter must be set for
double label counting. It is essential to count small aliquots (10 yl) of the initial ^f^O/[14Q]sucrose solution in order to determine experimentally the amount of radioisotope per unit volume. It is also important to count small samples of 3H2°
alone and of [^4c]sucrose alone to determine the spillover from one counting channel to another.
Calculations for each group are performed in the following fashion. The radioactivity in the 1 4C channel (minus back- ground) of the four samples in the group are averaged. This number represents the average sucrose space. For each sample in the group cpm (minus background) in the 1 4C channel is multi- plied by the percentage which has been shown to spill into the tritium channel to obtain the spillover counts. The latter are subtracted from the cpm (minus background) observed in the tritium channel. The difference represents % 2 0 associated with the sample. The radioactivity in the tritium channel due to 3H20 of the four samples within the group is averaged.
This number represents the average 3H2° space. The small ali- quot of the initial 3H2°/[14c]sucrose solution is used to de- termine cpm % 2 ° /1 0 l-11 a n d cPm [ c ] sucrose/10 yl. The average sucrose space for each group is calculated by dividing the ob- served average cpm in the 1 4C channel by cpm [14c]sucrose/10 yl
test solution. The average water space for each group is cal- culated by dividing the observed average cpm in the tritium channel by the cpm ^H20/10 yl test solution. The average in- tracellular space is obtained by subtracting the average sucrose space from the average water space. The values for the differ- ent groups are plotted as a function of cell number and a linear regression analysis performed to determine final intra- and extracellular volumes over the concentration range studied.
D. Calculation of Data
See Sections III.A - C.E. Critical Comments
One technical difficulty in the oil Microfuge method in- volves the silicone oils. Miscibility of No. 510 silicone oil with No. 550 is highly variable, depending on the batch lot of the No. 510. In recent experiments we have shown that a mix- ture of equal parts of Nos. 556 and 510 is equally as effective as the previously published formulation (8, 9) and there are no problems with miscibility. Intra- and extracellular spaces remain unchanged.
Reproducibility of quadruplicate transport measurements made by the coverslip technique is excellent, the range usually being within 10%. Reproducibility of quadruplicate measure- ments by the oil Microfuge technique is somewhat more variable, the standard error being less than 10%. Reproducibility among experiments varies, depending on the type of permeant. For example, the rate of adenosine transport by rabbit lung macro- phages is constant from day to day, while the rate of amino acid transport varies, possibly because of exchange diffusion or transinhibition (see below). Determinations of Km and Vm a x
require multiple experiments, especially where the presence of more than one transport system is suspected.
On a more theoretical level, since molecular mechanisms of most transport systems in animal cells still remain to be elu-
cidated, it is important to note that the use of kinetic tech- niques assumes that the steady-state approximation is justified.
However, the data really reflect the apparent affinity of the rate-limiting step in uptake. Whether the rate-limiting step is the passage of the solute across the membrane or some other parameter is not entirely clear at this time. Moreover, per- turbations in the membrane may affect the Km and Vm a x generated.
Another difficulty is that measurements may be complicated by internal pool sizes. For example, amino acid transport is sub- ject to exchange diffusion or transinhibition. In the former
the internal concentration of the amino acid or closely related analog alters the observed flux rate in a positive fashion (1, 3, 4, 6, 10, 12). In the latter the internal concentration of certain amino acids alters the observed flux rate in a negative fashion (1, 21). Internal events such as phosphorylation in the case of nucleosides and sugars may alter apparent results, since the activity of the kinase may overshadow the transport activity. Therefore, it is particularly important that measure- ments be made so rapidly that efflux and metabolism do not be-
come significant factors. While some investigators feel that nonmetabolizable substrates may offer a better approach (12) , these substrates are not those the cell is ever likely to see naturally.
Another approach involves use of mutant cells that lack specific steps in the metabolic pathway of the permeant in question. Examples might be adenosine-kinase-deficient or thymidine-kinase-deficient mutants when the solute is adenosine or thymidine. Moreover, it should not be assumed that the same transport systems occur and are regulated in the same fashion in all cells. There is even a marked difference between normal rabbit lung macrophages and rabbit peritoneal macrophages ob- tained after an intraperitoneal infusion of casein. The former have a single adenosine and a single lysine transport system, while the latter have two systems for each permeant
(P. Strauss, unpublished data).
Finally, it is highly desirable to perform the transport test in a simple medium devoid of potentially competing sub- strates. Even prior exposure of macrophages to serum has been shown to result in altered amino acid (4, 21) and nucleoside
(4, 5) transport. PBS, with or without 5 mAT glucose, has proved satisfactory for macrophages. PBS with 5 mM glucose and 0.1%
recrystallized bovine serum albumin (Sigma Chemicals, St. Louis, Missouri) has proved satisfactory for murine lymphocytes.
Acknowledgment
This work has been supported by Northeastern University, the American Cancer Society BC-171, and the National Science Foundation PCM 75-20323 and PCM 77-25434. PRS is the recipient of Research Career Development Award CA00460 from the National Cancer Institute, DHEW.
REFERENCES
1. E. Heinz. "Mechanics and Energetics of Biological Trans- port." Springer-Verlag, Berlin, Heidelberg, New York, 1978.
2. R. Hawkins and R. D. Berlin. Purine transport in poly- morphonuclear leukocytes. Biochim. Biophys. Acta 173:
324-331, 1969.
3. M.-F. Tsan and R. D. Berlin. Membrane transport in the rabbit alveolar macrophage. The specificity and charac- teristics of amino acid transport systems. Biochim. Bio- phys. Acta 241: 155-169, 1971.
4. P. R. Strauss and R. D. Berlin. Effects of serum on mem- brane transport. I. Separation and preliminary characteri- zation of factors which depress lysine or stimulate adeno- sine transport in rabbit alveolar macrophages. J. Exp.
Med. 137: 359-368, 1973.
5. P. R. Strauss. Effects of serum on membrane transport.
II. Serum and the stimulation of adenosine transport, a possible mechanism. J. Cell Biol. 60: 571-585, 1974.
6. J. F. Pofit and P. R. Strauss. Membrane transport by
macrophages in suspension and adherent to glass. J. Cell.
Physiol. 92: 249-256, 1977.
7. S. H. Zigmond and J. G. Hirsch. Cytochalasin B: Inhibi- tion of D-2-deoxyglucose transport into leukocytes and fibroblasts. Science 176: 1432-1434, 1972.
8. P. R. Strauss, J. M. Sheehan, and E. R. Kashket. Membrane transport by murine lymphocytes. I. A rapid sampling tech- nique as applied to the adenosine and thymidine systems.
J. Exp. Med. 144: 1009-1021, 1976.
9. P. R. Strauss, J. M. Sheehan, and E. R. Kashket. Membrane transport by murine lymphocytes. II. The appearance of thymidine transport in cells from concanavalin A-stimulated mice. J. Immunol. 118: 1328-1334, 1977.
10. A. Kotyk and K. Janacek. "Cell Membrane Transport: Prin- ciples and Techniques," 2nd ed. Plenum, New York, 1975.
11. G. G. Guidotti, A. F. Borghetti, and G. C. Gazzola. The regulation of amino acid transport in animal cells. Bio- chim. Biophys. Acta 515: 329-366, 1978.
12. H. N. Christensen. Exploiting amino acid structure to learn about membrane transport. Adv. Enzymol. Relat.
Areas Molec. Biol. 49: 41-101, 1979.
13. A. R. P. Paterson. Adenosine transport. In "Physiological and Regulatory Functions of Adenosine and Adenine Nucleo- tides" (H. P. Baer and G. I. Drummond, eds.), pp. 305-313.
Raven Press, New York, 1979.
14. R. D. Berlin and J. M. Oliver. Membrane transport of purine and pyrimidine bases and nucleosides in animal
cells. Int. Rev. Cytol. 42: 287-336, 1975.
15. R. Wohlhueter and P. G. W. Plagemann. The roles of trans- port and phosphorylation in nutrient uptake in cultured animal cells. Int. Rev. Cytol. 64: 171-240, 1980.
16. M. Hatanaka. Transport of sugars in tumor cell membranes.
Biochim. Biophys. Acta 355: 77-104, 1974.
17. K. Fink, R. E. Cline, and R. M. Fink. Paper chromato- graphy of several classes of compounds: correlated Rf values in a variety of solvent systems. Anal. Chem. 35:
389-398, 1963.
18. I. H. Segel. Biochemical Calculations, 2nd ed. John Wiley & Sons, New York. 1976.
19. I. H. Segal. "Enzyme Kinetics." John Wiley & Sons, New York. 1975.
20. R. F. Kletzien, M. W. Pariza, J. Becker, and V. R. Potter.
A method using 3-0-methyl-D-glucose and phloretin for the determination of intracellular water spaces of cells in monolayer culture. Analyt. Biochem. 68: 537-544, 1975.
21. P. R. Strauss. Effects of serum on membrane transport.
III. Serum and inhibition of lysine transport. Am. J.
Physiol. 236: C111-C116, 1979.