Received: December 12, 2016 Accepted: March 28, 2017 Correspondence to:
Andrea Surányi Semmelweis str. 1.
Szeged, Csongrád H-6725, Hungary
gaspar-suranyi.andrea@med.u-szeged.hu
Ábel T Altorjay1, Andrea Surányi1, Tibor Nyári2, Gábor Németh1
1Department of Obstetrics and Gynecology, University of Szeged, Faculty of Medicine, Szeged, Hungary
2Department of Medical Physics and Informatics, University of Szeged, Faculty of Medicine, Szeged, Hungary
Aim We aimed to investigate correlations between uterine artery peak systolic velocity (AUtPSV), and placental vascu- larization in groups of normal blood pressure (NBP) and hy- pertensive disorders of pregnancy (chronic hypertension (CHT), gestational hypertension (GHT) and preeclampsia (PE)) alone or in combination with gestational diabetes mel- litus (GDM), and hypothesized that AUtPSV rises when GDM complicates pregnancy hypertension.
Methods Placental 3-dimensional power Doppler indices, such as vascularization index (VI), flow index (FI), and vas- cularization-flow index (VFI), and uterine artery peak systolic velocity (AUtPSV) were measured in CHT (N = 43), CHT+GDM (N = 15), GHT (N = 57), GHT+GDM (N = 23) and PE (N = 17) pregnancies, and compared to NBP (N = 109). Correlations were analyzed between vascularization indices, AUtPSV, pregestational BMI and adverse pregnancy outcome rates.
Results In our results VI was higher in CHT (P = 0.010), while FI was lower in CHT (P = 0.009), GHT and PE (P = 0.001) compared to NBP. In case of VFI, significant difference was found between CHT and GHT (P = 0.002), and NBP and PE (P = 0.001). FI was found prognostic for umbilical pH and neonatal birth weight. Pre-gestational BMI was significantly higher in GHT+GDM compared to GHT, and in CHT+GDM compared to the CHT group. As for AUtPSV, significant dif- ference was found between NBP and CHT (P = 0.012), NBP and CHT+GDM (P = 0.045), NBP and GHT+GDM (P = 0.007), NBP and PE (P = 0.032), and GHT and GHT+GDM (P = 0.048) groups.
Conclusion Our study revealed that vascularization indices and AUtPSV show significant differences due to gestational pathology, and can be useful in detection of pregnancies at risk.
Use of placental vascularization indices and uterine artery
peak systolic velocity in early detection of pregnancies complicated by gestational diabetes, chronic or
gestational hypertension, and
preeclampsia at risk
Hypertension during pregnancy occurs in 5 - 7% of all pregnancies, and about 70% of them occur in first-time pregnancies (1). Chronic hypertension (CHT) is a complica- tion in 1%-2% of all pregnancies, while gestational hyper- tension (GHT) is a complication in 3%-6% of all pregnan- cies (1-3). It can progress to preeclampsia (PE) in about 25%
of cases, especially when hypertension presents before 32 weeks of gestation (4). In Hungary, the prevalence of chron- ic hypertension among pregnant women is 1%-2%, that of gestational hypertension is 3%-6% (3), and the prevalence of gestational diabetes mellitus (GDM) is 6%-9.5% (5).
Pregnancy hypertension is a leading cause of maternal and fetal morbidity and mortality; furthermore its pathophysi- ological background is poorly understood (6).
Proper uterine and placental vascularization is important for the normal development of pregnancies (7,8). Patho- logical fetomaternal circulation accompanying pregnan- cy hypertension can lead to elevated resistance in uterine circulation, which can cause placental insufficiency and decreased fetal oxygenation (9), as a result of the patho- logical changes in placenta. In diabetic pregnancies, the placenta also has morphological changes that may result in reduced uteroplacental perfusion (10,11). Placental hys- tological maldevelopment can result in premature birth, intrauterine hypoxia, or even intrauterine death (12). These morphological changes can be detected indirectly by ul- trasound in the form of vascularization indices (13).
Improvements in three-dimensional (3D) ultrasound have allowed us to obtain and study volumes from different or- gans more precisely (14), and color map provided by power Doppler has made the study of vessels with low resistance much easier (15). Combining these techniques has enabled us to study the morphology of the vascular tree and to quantify the direct blood flow of the placenta (13,16).
Differences between placental vascularization indices in case of pregnancy hypertension complicated with GDM were unknown. It was also uclear whether there is dif-
ference in AUtPSV values depending on the presence of GDM, or not in case of pregnancy hypertension.
We hypothesized that placental vascularization and AUtPSV will differ depending on pregnancy pathology (CHT; GHT;
GDM combined with CHT or GHT; and PE).
The purpose of the present study was to clarify the effect of using uterine artery peak systolic velocity (AUtPSV) mea- surements, 3D ultrasound, and placental vascularization in- dices on hypertensive disorders of pregnancy and hyper- tensive disorders of pregnancy complicated with GDM in second and third trimesters.
PATIENTS AND METHODS
We performed a prospective Doppler study: placental vascularization indices and uterine artery peak systolic velocity. We included women with singleton pregnancies seen once in the second or third trimester at our outpa- tient clinic at University of Szeged, Faculty of Medicine, Department of Obstetrics and Gynecology, in Szeged.
Our study was carried out between 1 March 2014 and 31 March 2015 in accordance with the Code of Ethics of the Declaration of Helsinki for scientific research involving humans, and our study was approved by the institutional research ethics committee (No.: 32/2014). Informed con- sent was signed by the observed person after a detailed and clear explanation about the conditions and aims of the survey.
Patients Inclusion criteria
In our study we analyzed singleton pregnancies between 20-38 weeks of gestation, which were divided into six groups as you can see in Table 1. Gestational age was de- termined on the basis of the first day of the last menstrual period and on the basis of the first trimester ultrasound biometry (biparietal diameter (BPD) and crown-lump length (CRL)).
TAblE 1. Groups of pregnant women and the number of cases examined
Groups of pregnant women No.of cases
NBP group of pregnant women with normal blood pressure 109
CHT group of pregnant women with chronic hypertension 43
CHT+GDM group of pregnant women with chronic hypertension complicated with gestational diabetes mellitus 15
GHT group of pregnant women with gestational hypertension 57
GHT+GDM group of pregnant women with gestational hypertension complicated with gestational diabetes mellitus 23
PE group of pregnant women with pre-eclampsia 17
Diagnostic criteria for hypertension
High blood pressure (>140 mm Hg systolic or >90 mm Hg diastolic) was defined on the basis of the International Soci- ety for the Study of Hypertension in Pregnancy (ISSHP) (4).
Blood pressure was measured (BP A100 PLUS, Microlife AG, Windau, St. Gallen, Switzerland) three times on each oc- casion, and patients were scheduled for a check-up every two weeks.
Patients in the case groups had ongoing antihypertensive therapy with oral alpha-methyldopa 250 mg (Dopegyt, EGIS Pharmaceuticals 105 PLC., Budapest, Hungary) and they had dietary salt restrictions according to the Hungar- ian guidelines (17).
Inclusion criteria for CHT was high blood pressure pre-dat- ing pregnancy. As many women did not have their blood pressure measured before the pregnancy, we relied on the first trimester blood pressure according to ISSHP when de- fining high blood pressure in these women. Inclusion crite- ria for GHT was new onset of hypertension after 20 weeks of gestation, for which it was important to have normal blood pressure documented either before the pregnancy or at least in early pregnancy before pregnancy-related de- crease in blood pressure occurred (4).
Diagnostic criteria for preeclampsia
In the diagnosis of PE we applied the definition of ISSHP (4), which defines PE as a combination of new onset of hypertension, that occurs after 20 weeks of gestation and the coexistence of one or more of the following new-on- set conditions such as proteinuria, other maternal organ dysfunctions (renal insufficiency, liver involvement, neu- rological or hematological complications) and uteropla- cental dysfunction in the form of fetal growth restriction (IUGR).
Diagnostic criteria for GDM
GDM was defined on the basis of the recommendation of the World Health Organization (WHO) 2013 (18). In Hunga- ry patients are screened with an oral glucose tolerance test (OGTT) containing 75 mg oral carbohydrate on the basis of WHO guidelines. Groups CHT+GDM and GHT+GDM con- sisted of patients who had dietary sugar and salt restriction in addition to the antihypertensive therapy. Their blood glucose and HgA1c levels were in normal range. Those pa- tients, in which introduction of insulin therapy was need-
ed, were excluded from the study. All pregnant women with GDM had normal glycemic response. We used HgA1c for GDM follow up. Body mass index (BMI) was defined as follows: underweight: <19 kg/m2; obese: >30 kg/m2. Methods
Ultrasound diagnosis
Pregnant women who visited our outpatient clinic had been prospectively enrolled into 6 groups as follows: a control group (N = 109) and 5 case groups (N = 155). Those who did not meet the criteria of the study design during the study period were excluded (N = 612).
An initial 2D conventional ultrasound study provided data about fetal position and presentation, body movements and fetal heart rate, placental localization, umbilical cord insertion, and volume of amniotic fluid. All patients were scanned in a semi-recumbent position.
Examination started with fetal biometry in 2D mode ultra- sound to assess biparietal diameter (BPD), head circumfer- ence (HC), abdominal circumference (AC), femur length (FL) and to calculate estimated fetal weight (EFW) with the help of formula B of Hadlock (19), followed by color Dop- pler study of the uterine arteries (20).
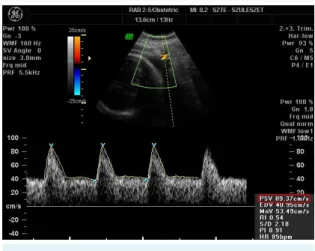
To identify the uterine arteries, we obtained a sagittal sec- tion of the uterus, and used color flow mapping for AUtPSV (cm/s) (Figure 1). Then we applied pulsed wave Doppler with the sampling gate set at 2 mm. The angle of in-
FIGurE 1. Measurement of uterine artery peak systolic velocity (AutPSV) taken from the sagittal section of the uterus with color flow mapping and applied pulsed wave Doppler. PSV value is highlighted in red.
sonation was <30º and we recorded at least three consec- utive uniform waveforms (21). The impact of placentation on AUtPSV was ruled out by calculating the average value of the left and right uterine artery.
The next step was the 3D scan of the placenta at the in- sertion point of the umbilical cord. We used 3D rendering mode, in which the color and gray value information was processed and combined to give a 3D image (mode cent:
smooth, 4/5; FRQ, low; quality, 16; density, 6; enhance, 16;
balance, 150; filter, 2; actual power, 2 dB; pulse repetition frequency, 0.9) (22). Power Doppler window (pulse repeti- tion frequency at 900 Hz and wall filter of 50 Hz) was placed over the placenta, mapping the vascular tree from basal to chorionic plates, as this technique shows higher sensitivity because it is based on amplitude instead of mean frequen- cies to depict the vascular tree (15). Moreover, color map- ping is independent of the angle of insonation and does not show ‘aliasing’. However, it is more sensitive to patient movements, so the volumes should be acquired while avoiding any probe or patient movements; otherwise ar- tifacts could be present.
The 3D static volume box was placed over the highest vil- lous vascular density zone at umbilical cord insertion (23).
The sweep angle was set at maximum 70°. The three planes of the acquired placental volume were explored to localize the zone where the highest vascular density was found by power Doppler mode. Volume acquisition was made dur- ing a time interval varying from 5 to 10 s in the absence of fetal movements and with the mother staying as still as possible. We used fast low resolution acquisition to avoid any kind of artifacts. The variation in acquisition time was also dependent on the size of the volume box, and it cor- related with the age of gestation.
All 2D and 3D ultrasound scans were performed using Volu- son 730 system (RAB 2-5 MHz transducer, GE Healthcare, Kretztechnik, Zipf, Austria). The same pre-established instru- ment power settings were used in all cases (‘Obstetrics/2–3 trimester’ in 2D mode).
Calculation of 3-dimensional power Doppler indices Volume files were analyzed using the virtual organ com- puter-aided analysis (VOCAL) program pertaining to the computer software 4D VIEW (GE Medical Systems, Austria,
version 10.4) by an expert in 3D analysis.
We used Mercé-type sono-biopsy (23), a reproducible, valid alternative for evaluation of the vascular tree of
the entire placenta (24,25). The spherical sample volume was 28 mL constantly, and the VOCAL software automati- cally calculated the color scale values in a histogram, and the vascularization indices (vascularization index (VI), flow index (FI) and vascularization flow index (VFI)) from the ac- quired spherical sample volume in all cases (23).
The 2D and 3D ultrasound acquisitions were performed at the same time, and 3D volume files were analyzed by VO- CAL at a later time. The ultrasound images of 2D and 3D scans were stored on a hard disk (HD).
Data collection after delivery
Data about neonatal outcome and mode of delivery (nor- mal delivery, planned cesarean section or acute cesarean section) were collected and classified after delivery. We collected data on 1-, 5-, and 10-minute Apgar scores, um- bilical pH, neonatal birth weight, rate of neonatal com- plications such as apnea, polycythemia, hypoglycemia, respiratory distress syndrome, dysmaturity and feeding dif- ficulties, and the rate of macrosomia and premature birth.
Statistical analysis
Statistical analyses were performed with IBM SPSS Statis- tics 21.0 for Windows program (IBM, New York, USA). Kol- mogorov-Smirnov test results were significant for our da- tabase demonstrating that our study samples were not normally distributed. Continuous variables were expressed as median ± standard deviation. The Kruskal-Wallis test was used for the comparison of continuous variables in the six groups examined, whereas comparison between the pathological groups was performed with Mann-Whitney U test in case of vascularization indices, and with Bartlett’s test with Bonferroni’s modification in case of AUtPSV, (level of significance was set at P < .05). Univariate comparisons for categorical variables were assessed with χ2 tests. Lin- ear regression coefficient values and equations depend- ing on gestational age were also calculated for VI, FI, VFI and AUtPSV for all pathological and control groups. The association between placental 3D power Doppler indices, AUtPSV, pre-gestational BMI, neonatal birth weight and pregnancy outcome, 2-D color Doppler indices (PIs of um- bilical and uterine arteries) was determined by Spearman’s rank correlations.
rESulTS
The analysis of 3D volume acquisition demonstrated that VI indices are significantly lower in CHT (P = 0.010), CHT+GDM
(P = 0.054), and GHT+GDM (P = 0.973) groups compared to NBP (Table 2). In case of GHT, VI was lower (P = 0.152) compared to NBP, though the difference was not signifi-
cant. There was significant difference between the CHT and GHT groups (P = 0.010). All PE cases evolved from GHT cases, therefore we analyzed the changes in 3-DPD indices, TAblE 2. Three-dimensional Power Doppler indices: vascularization index (VI), flow index (FI), and vascularization flow (VFI) index, and uterine artery peak systolic velocity (AutPSV) in pregnancies with normal blood pressure (NbP), chronic hypertension (CHT), chronic hypertension and gestational diabetes mellitus (CHT+GDM), gestational hypertension (GHT), gestational hypertension and gestational diabetes mellitus (GHT+GDM), and preeclampsia (PE)
Groups of pregnant women
Parameter CHT+GDM (n = 15) CHT (n = 43) NbP (n = 109) GHT (n = 57) GHT+GDM (n = 23) PE (n = 17) VI (%, mean±SD) 5.3 ± 3.5 14.4 ± 10.1 10.4 ± 6.2 7.7 ± 7.1 5.4 ± 2.4 4.9 ± 3. 2
FI (mean±SD) 42.8 ± 9.6 41.5 ± 8.2 46.1 ± 7.6 38.5 ± 9.6 36.4 ± 8.3 36.5 ± 5.7
VFI (mean±SD) 2.3 ± 1.5 3.6 ± 2.8 4.1 ± 2.5 3.0 ± 2.5 2.0 ± 1.1 2.0 ± 1.6 AUtPSV (cm/s, mean±SD) 45.3 ± 14.1 50.0 ± 16.6 59.5 ± 23.1 56.8 ± 18.4 68.6 ± 30.9 52.4 ± 13.0 TAblE 3. Maternal and fetal characteristics in pregnancies with normal blood pressure (NbP), chronic hypertension (CHT), chronic hy- pertension and gestational diabetes mellitus (CHT+GDM), gestational hypertension (GHT), gestational hypertension and gestational diabetes mellitus (GHT+GDM) and preeclampsia (PE)
Groups of pregnant women Parameter
CHT+GDM (n = 15)
CHT (n = 43)
NbP (n = 109)
GHT (n = 57)
GHT+GDM (n = 23)
PE*
(n = 17) Mean maternal age (years; mean±SD) 34.4 ± 1.4 32.8 ± 4.2 30.7 ± 4.7 31.1 ± 5.4 32.5 ± 6.3 29.5 ± 5.2
P 0.023* 0.037*
Weeks of gestation at the time of 3D scan (mean±SD) 28+1±7+2 28+5±6+6 24+6±7+2 31+6±6+4 29+6±7+5 31+2±7+1 Weeks of gestation at the time of delivery (mean±SD) 37+4±1+5 38+5±1+1 38+3±1+6 38+0±2+2 37+1±2+3 36+6±3+5 Pregestational BMI (kg/m2; mean±SD) 32.8 ± 3.6 30.8 ± 4.6 30.7 ± 5.2 31.0 ± 5. 0 33.4 ± 7.1 27.2 ± 6.10
P 0.041* 0.047*
Number of women with pregestational maternal obesity (BMI over 30)
9/15 25/43 18/109 14/57 10/23 7/17
Weight gain during pregnancy until delivery (kg; mean±SD) 7.75 ± 7.02 8.45 ± 4.52 7.86 ± 4.95 13.44 ± 5.77 14.50 ± 4.53 11.41 ± 3.49
P <0.001* <0.001* 0.011*
Number of premature births 1/15 3/43 8/109 7/57 5/23 8/17
Apgar score 1-minute 8.30 ± 0.75 8.93 ± 1.09 8.86 ± 0.57 8.69 ± 1.52 8.21 ± 1.75 8.14 ± 1.43 (mean±SD) 5-minute 9.53 ± 0.66 9.68 ± 0.84 9.50 ± 0.67 9.65 ± 0.68 9.39 ± 1.15 9.29 ± 1.13 10-minute 9.93 ± 0.27 9.91 ± 0.35 9.91 ± 0.21 9.82 ± 0.60 9.65 ± 1.07 9.55 ± 0.84 Umbilical pH (mean±SD) 7.29 ± 0.05 7.23 ± 0.07 7.27 ± 0.08 7.26 ± 0.07 7.25 ± 0.07 7.25 ± 0.07 Number of
perinatal complications
Apnea 7/15 3/43 9/109 6/57 5/23 7/17
P <0.001* 0.001* <0.001*
Polycythemia 0/15 2/43 7/109 7/57 0/23 2/17
Hypoglycemia 6/15 1/43 2/109 2/57 4/23 3/16
P 0.012‡ 0.022§
Respiratory distress syndrome 0/15 0/43 0/109 0/57 2/23 3/16
DysmaturityII 0/15 0/43 3/109 4/57 1/23 12/17
Feeding difficulties 6/15 1/43 7/109 4/57 5/23 0/17
P <0.001* 0.002*
Neonatal birth weight (grams; mean±SD) 3130 ± 296 3377 ± 374 3346 ± 555 3236 ± 751 3601 ± 811 2422 ± 817 Rate of macrosomia (neonatal birth weight over 4000g) 2/15 2/43 12/109 3/57 1/23 0/17
*All cases were intrauterine growth restriction.
†vs normal blood pressure (NbP) group.
‡CHT+GDM vs CHT.
§GHT vs GHT+GDM.
IISyndrome of an infant born with relative absence of subcutaneous fat, wrinkling of the skin, prominent finger and toe nails, and meconium stain- ing of skin and placental membranes; often associated with postmaturity or placental insufficiency.
but the difference between GHT and PE groups in case of VI was not statistically significant (P = 0.175).
In comparison with NBP group, FI was significantly lower in CHT (P = 0.009), CHT+GDM (P = 0.010), GHT (P < 0.001), GHT+GDM (P < 0.001), and PE (P < 0.001) groups; how- ever, there was no statistically significant difference be- tween CHT and CHT+GDM (P = 0.354); GHT and GHT+GDM (P = 0.443); and GHT and PE (P = 0.183) groups.
For VFI, no significant difference was found between CHT and CHT+GDM (P = 0.073) or NBP (P = 0.973), GHT and GHT+GDM (P = 0.428), GHT and PE (P = 0.128) or GHT and NBP (P = 0.075). Statistically significant difference can only be described when PE was compared to NBP (P = 0.010).
AUtPSV showed significant difference between NBP and CHT (P = 0.012) and GHT and GHT+GDM (P = 0.048) groups, but not between CHT and CHT+GDM (P = 0.062), GHT and NBP (P = 0.087), and GHT and GHT+GDM (P = 0.320).
Pre-gestational BMI was significantly higher (P = 0.009) in GHT+GDM (33.46 ± 7.11) compared to GHT (30.37 ± 5.80), as well as in CHT+GDM (32.84 ± 3.64) compared to the CHT (30.55 ± 5.68) group. Strong positive linear correlation was found between VI (P = 0.009), FI (P = 0.007) and neona- tal birth weight (BW). Mean FI was 45.7 in case of normal pregestational BMI and 41.2 in case of elevated BMI, thus elevated pregestational BMI had substantial influence on
FI depression (P = 0.048) and fetal growth development, consequently on BW.
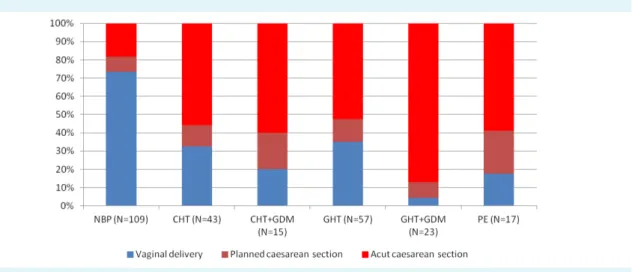
Maternal and perinatal characteristics and pregnancy out- comes included the maternal age, physique, lenght of gestation, the neonatal biophysical parameters, adapta- tion parameters and complication of intrauterine chronic hypoxia (Table 3). We also analyzed mode of labor (Figure 2) and gestational ages at 3-DPD ultrasound investigations (Figure 3) with respect to blood pressure and other inves- tigated patology.
Interestingly the highest cesarean section rate was ob- served in the GHT+GDM group, even in the PE group the rate of normal delivery was three times higher than in GHT+GDM, although premature birth rate was the high- est in PE. All PE cases were consisted of patients with GHT and IUGR. As for adverse pregnancy outcome rates, FI was found prognostic for umbilical pH and neonatal birth weight.
In the assessment of neonatal outcomes rate of apnea it was significantly elevated in GHT patients (P = 0.042) com- pared to CHT patients and it was more significatly elevat- ed in GHT+GDM (P < 0.001), CHT+GDM (P < 0.001) and PE (P = 0.001) cases. One other characteristic perinatal com- plication specific to newborns of diabetic mothers, hy- poglycemia was also significantly higher in CHT+GDM (P = 0.012) compared to CHT, and GHT+GDM (P = 0.022) compared to GHT.
FIGurE 2. Mode of delivery in pregnancies with normal blood pressure (NbP), chronic hypertension (CHT), chronic hypertension and gestational diabetes mellitus (CHT+GDM), gestational hypertension (GHT), gestational hypertension and gestational diabetes mellitus (GHT+GDM) and preeclampsia (PE).
DISCuSSION
In our in-vivo study of vascularization analysis we described the effect of GDM on placental vascularization and AUtPSV in pregnancies complicated with pregnancy hypertension.
We found no correlation between placental vasculariza- tion indices (VI, FI and VFI) or AUtPSV findings and mater- nal age or weeks of gestation.
Because of the chronic intrauterine hypoxia the placen- tal alterations are presented from first trimester Similarly to previous first trimester findings (26). In case of hyper- tensive disorders of pregnancy (CHT, GHT or PE) placental vascularization, which is characterized by FI, is significantly lower compared to NBP cases in the second and third tri- mesters, and it becomes even more affected when hyper- tension is associated with gestational diabetes (CHT+GDM, GHT+GDM) and correlated with the lenght of pathologi- cal lenght of gestation. On the other hand, according to AUtPSV findings, GDM aggravates CHT and GHT hypoxic damage of placentas and fetuses. AUtPSV is an absolute speed value indicates vascular missing adaptation more sensitively than traditional flow indices, such as Systolic- Diastolic ratio (S/D) or Pulsatility Index (PI).
The increased AUtPSV of diabetic women demonstrated in our study reflects changes in systemic arteriolar placental afterload, myocardial contractility, heart rate and preload.
The placenta in diabetic pregnancy has morphological changes that may result in reduced uteroplacental perfu- sion. The absence of a difference in uterine artery PI values between fetuses of diabetic women and normal controls argues against a modification increased arterial compliance may increase AUtPSV without altering afterload (27).
Most studies represent normal Doppler flow in the utero- placental circulation in pregnancies complicated by ma- ternal DM, except in those cases complicated by PE (28).
Where women had pre-existing hypertension (CHT cases) and normally functioning placenta, we detected no sig- nificant difference in adverse pregnancy outcome rates between CHT and NBP groups despite the lower FI rate, though VI was found to be significantly higher in CHT. In GHT and PE group, both VI and FI were significantly lower (26), as a proof of placental maldevelopment.
Only FI was found to be significantly lower in CHT+GDM compared to CHT, though we expected significantly lower results in case of VI, VFI as well based on an earlier study (22).
AUtPSV in CHT was significantly lower compared to NBP, which may be the result of the higher VI rate, and it may also confirm the existence of a placental response on elevated maternal blood pressure predating preg- FIGurE 3. Weeks of gestation at the time of 3D scan in pregnancies with normal blood pressure (NbP), chronic hypertension (CHT), chronic hypertension and gestational diabetes mellitus (CHT+GDM), gestational hypertension (GHT), gestational hypertension and gestational diabetes mellitus (GHT+GDM) and preeclampsia (PE). (N = N2+N3; N2: second trimester, N3: third trimester).
nancy. Interestingly, the GDM did not trigger the chronic hypoxic alteration in CHT group.
There was no significant difference in AUtPSV between GHT, PE and NBP, but AUtPSV was significantly higher in CHT+GDM compared to both CHT and GHT, which cor- relates with the higher adverse pregnancy outcome rates specific to gestational diabetes mellitus.
The highest mean maternal age was found in case of preg- nancy hypertension complicated with GDM, highlighting the fact that higher maternal age is an important risk fac- tor in GDM. Above it the GDM has effect on neonatal out- come, as well. GDM gives a higher rate for hypoglycemic episodes and feeding difficulties.
In case of PE there was no further increase in the rate of hypoglycemic episodes.
Macrosomia is most likely to occur in case of gestational diabetes. In case of NBP, it is possible that there were un- diagnosed gestational diabetic patients in our NBP group.
The lower macrosomia rate on the other hand in case of GHT+GDM compared to NBP or CHT+GDM might be the result of impaired placentation in case of GHT that prevent- ed GHT+GDM cases end up with macrosomia in neonates.
There are several limitations of our study. The method is very sensitive and, therefore, we had to reduce the inter- observer bias. We should apply standardized settings of the ultrasound equipment. Fetal movements and mater- nal respiratory movements result in artifacts in the 3-DPD records. Data recording and analyzing are time consuming, thus these kind of investigations are difficult to introduce into routine maternal care. The GDM screening is performed in first and second trimester based on WHO guideline, it is possible that there were undiagnosed gestational diabetic patients, which developed in third trimester.
Our study revealed that certain placental vascularization indices and AUtPSV may indicate on significant differenc- es due to gestational pathology, thus placental vascular- ization indices and AUtPSV can be useful in the early de- tection of pregnancies at risk in order to possibly prevent complications, but extensive researches are requires to de- termine the clinical significance.
Funding None declared.
Ethical approval received from the Human Investigation Review Board, University of Szeged, Hungary (No. 32/2014).
Declaration of authorship ATA did the majority of the literature research, prepare the manuscript, and performed obstetrical ultrasound and data records. AS did some literature research, prepare the study design, wrote the manuscript and analyzed the 3-dimensional images. TN was the stat- istician, edited the text of the manuscript, and also supervised the manu- script. GN was responsible for the obstetric treatment and supervised the manuscript.
Competing interests All authors have completed the Unified Competing Interest form at www.icmje.org/coi_disclosure.pdf (available on request from the corresponding author) and declare: no support from any organi- zation for the submitted work; no financial relationships with any organiza- tions that might have an interest in the submitted work in the previous 3 years; no other relationships or activities that could appear to have influ- enced the submitted work.
references
1 August P, Jeyabalan A, roberts JM. Chronic hypertension and pregnancies. In: Taylor rN, roberts JM, Cunningham FG, lindheimer MD ed. Chesley’s Hypertensive disorders in pregnancy.
4th ed. london: Elsevier Inc, 2015. p. 397-419.
2 lindheimer MD, Taylor rN, roberts JM, Cunningham FG, Chesley l.
Introduction, history, controversies and definitions. In: Taylor rN, roberts JM, Cunningham FG, lindheimer MD, editors. Chesley’s Hypertensive disorders in pregnancy. 4th ed. london: Elsevier Inc, 2015. p. 1-25.
3 Paulin F, Alföldi S, Páll D, Kiss I. Treatment of hypertension during pregnancy. In: Kiss I, editor. Professional Guideline, Statement of the Hungarian Society of Hypertension. Hungarian Society of Hypertension; 2009. p. 131-6.
4 Tranquilli Al, Dekker G, Magee l, roberts J, Sibai bM, Steyn W, et al.
The classification, diagnosis and management of the hypertensive disorders of pregnancy: a revised statement from the ISSHP.
Pregnancy Hypertens. 2014;4:97-104. Medline:26104417 5 Kun A, Tornoczky J, Tabak AG. Prevalence and predictors of GDM
in Hungary. Horm Metab res. 2011;43:788-93. Medline:22009374 doi:10.1055/s-0031-1287795
6 lindheimer MD, Taler SJ, Cunningham FG. Hypertension in pregnancy. J Am Soc Hypertens. 2008;2:484-94. Medline:20409930 doi:10.1016/j.jash.2008.10.001
7 Pairleitner H, Steiner H, Hasenoehrl G, Staudach A. Three- dimensional power Doppler sonography: imaging and quantifying blood flow and vascularization. ultrasound Obstet Gynecol. 1999;14:139-43. Medline:10492874 doi:10.1046/j.1469- 0705.1999.14020139.x
8 brosens JJ, Pijnenborg r, brosens IA. The myometrial junctional zone spiral arteries in 318 normal and abnormal pregnancies: a review of the literature. Am J Obstet Gynecol. 2002;187:1416-23.
Medline:12439541 doi:10.1067/mob.2002.127305
9 Coleman MA, McCowan lM, North rA. Mid-trimester uterine artery Doppler screening as a predictor of adverse pregnancy outcome in high-risk women. ultrasound Obstet Gynecol. 2000;15:7-12.
Medline:10776006 doi:10.1046/j.1469-0705.2000.00014.x 10 leach l. Placental vascular dysfunction in diabetic pregnancies.
Microcirculation. 2011;18:263-9. Medline:21418381 doi:10.1111/
j.1549-8719.2011.00091.x
11 Higgins MF, russell NM, Mooney EE, McAuliffe FM. Clinical and ultrasound features of placental maturation in pre- gestational diabetic pregnancy. Early Hum Dev. 2012;88:817-21.
Medline:22749772 doi:10.1016/j.earlhumdev.2012.06.001 12 Surányi A, Altorjay Á, Kaiser l, Nyári T, Németh G. Evaluation
of placental vascularization by three-dimensional ultrasound examination in second and third trimester of pregnancies complicated by chronic hypertension, gestational hypertension or pre-eclampsia. Pregnancy Hypertension 2017. doi:10.1016/j.
preghy.2017.03.004.
13 Matijevic r, Kurjak A. The assessment of placental blood vessels by three-dimensional power Doppler ultrasound. J Perinat Med.
2002;30:26-32. Medline:11933652 doi:10.1515/JPM.2002.004 14 riccabona M, Nelson Tr, Pretorius DH. Three-dimensional
ultrasound: accuracy of distance and volume measurements.
ultrasound Obstet Gynecol. 1996;7:429-34. Medline:8807760 doi:10.1046/j.1469-0705.1996.07060429.x
15 rubin JM, bude rO, Carson Pl, bree rl, Adler rS. Power Doppler uS: a potentially useful alternative to mean frequency-based color Doppler uS. radiology. 1994;190:853-6. Medline:8115639 doi:10.1148/radiology.190.3.8115639
16 Hafner T, Kurjak A, Funduk-Kurjak b, bekavac I. Assessment of early chorionic circulation by three-dimensional power Doppler.
J Perinat Med. 2002;30:33-9. Medline:11933653 doi:10.1515/
JPM.2002.005
17 rigó J, Asztalos M. A terhesség alatti hypertonia ellátásának diagnosztikus és terápiás irányelvei [Pregnancy hypertension:
diagnostic and therapeutic guidelines]. In: Papp Z. Szülészeti- nőgyógyászati protokoll [Obstetrical and gynecological guideline];
2002.
18 World Health Organization. diagnostic criteria and classification of hyperglycaemia first detected in pregnancy. Geneva, Switzerland:
WHO Press. WHO reference number: WHO/NMH/MND/13.2, 2013.
19 Hadlock FP, Harrist rb, Sharman rS, Deter rl, Park SK.
Estimation of fetal weight with the use of head, body, and femur measurements-a prospective study. Am J Obstet Gynecol. 1985;151:333-7. Medline:3881966 doi:10.1016/0002- 9378(85)90298-4
20 Nicolaides K, rizzo G, Hecker K, Ximenes r. Methodology of Doppler assessment of the placental and fetal circulations:
uteroplacental circulation. In: ISuOG. Doppler in obstetrics.
london: Fetal Medicine Foundation. 2002. p.32–61.
21 Khalil A, Nicolaides KH. How to record uterine artery Doppler in the first trimester. ultrasound Obstet Gynecol. 2013;42:478-9.
Medline:23658028
22 Surányi A, Kozinszky Z, Molnár A, Nyári T, bitó T, Pál A. Placental three-dimensional power Doppler indices in mid-pregnancy and late pregnancy complicated by gestational diabetes mellitus.
Prenat Diagn. 2013;33:952-8. Medline:23740806
23 Merce lT, barco MJ, bau S, Kupesic S, Kurjak A. Assessment of placental 362 vascularization by three-dimensional power Doppler “vascular biopsy” in normal 363 pregnancies. Croat Med J.
2005;46:765-71. Medline:16158469
24 rizzo G, Capponi A, Pietrolucci ME, Aiello E, Arduini D. First trimester placental volume and three dimensional power doppler ultrasonography in type I diabetic pregnancies. Prenat Diagn.
2012;32:480-4. Medline:22504827 doi:10.1002/pd.3848 25 Tuuli MG, Houser M, Odibo l, Huster K, Macones GA, Odibo
AO. Validation of placental vascular sonobiopsy for obtaining representative placental vascular indices by three-dimensional power Doppler ultrasonography. Placenta. 2010;31:192-6.
Medline:20060583 doi:10.1016/j.placenta.2009.12.018 26 de Almeida Pimenta EJ, Silva de Paula CF, Duarte bCJA, Fox KA,
Francisco r, ruano r, et al. Three-dimensional sonographic assessment of placental volume and vascularization in pregnancies complicated by hypertensive disorders. J ultrasound Med.
2014;33:483-91. Medline:24567460 doi:10.7863/ultra.33.3.483 27 McCance Dr. Diabetes in pregnancy. best Pract res Clin Obstet
Gynaecol. 2015;29:685-99. Medline:26004196 doi:10.1016/j.
bpobgyn.2015.04.009
27 ursem NT, Clark Eb, Keller bb, Wladimiroff JW. Fetal heart rate and umbilical artery velocity variability in pregnancies complicated by insulin-dependent diabetes mellitus. ultrasound Obstet Gynecol. 1999;13:312-6. Medline:10380294 doi:10.1046/j.1469- 0705.1999.13050312.x
28 Oliveira AP, Calderon IM, Costa rA, roscani MG, Magalhăes CG, borges VT. Assessment of structural cardiac abnormalities and diastolic function in women with gestational diabetes mellitus. Diab Vasc Dis res. 2015;12:175-80. Medline:25767180 doi:10.1177/1479164114563302