Slovak University of Technology in Bratislava Faculty of Mechanical Engineering 18th Conference on Applied Mathematics APLIMAT 2019
Proceedings
ON THE IMPACT OF VACCINATION ON THE EPIDEM IOLOGY OF VARICELLA IN HUNGARY
KARSAI János (HU), CSUMA-KOVÁCS Rita (HU), DUDÁS János (HU), DÁNIELISZ Ágnes (HU), MOLNÁR Zsuzsanna (HU), RÖST Gergely (HU)
Abstract. Varicella is one of the most common infectious diseases of children, which can be prevented by vaccine. Varicella causes not only the chickenpox of children, but also the herpes zoster at an older age. In Hungary, the vaccine is available for many years, and immunization is planned to make it obligatory. In our paper, we consider simple models of varicella infections including vaccination strategies taking into account the Hungarian specialties. We study the available demographic and epidemiological data, perform parameter estimations and present Wolfram Mathematica experiments for the possible consequences of the vaccination strategies.
Keywords: Dynamic compartmental model, varicella zoster virus, vaccination, epidemi
ology, Wolfram Mathematica, dynamic experiments Mathematics subject classification: Primary 92D30
1 Introduction
Varicella (chickenpox) is an acute, highly infectious disease caused by the varicella zoster (VZ) virus. The infection is most common in children, in whom it usually causes mild disease. The varicella-zoster virus is a highly contagious disease that affects almost the whole population.
Most people contract the disease in their childhood, when the symptoms are generally mild.
However, complication may occur, and the risk of it is significantly higher at an older age.
After a person recovers from chickenpox, the virus stays dormant (inactive) in the body. The epidemilogy of the varicella-zoster virus (VZV) is quite complicated. VZV causes varicella also known as chickenpox of children. Upon recovery from the varicella infection, VZV can remains in the body in latent form. In general, the individual has lifelong immunity to VZV, but immunity can be waning, and the virus may reactivate causing herpes-zoster (shingles).
Shingles cannot be passed from one person to another. However, VZV can spread from a person with active shingles to cause chickenpox in someone who had never had chickenpox or received chickenpox vaccine. Hence the modeling must take into account both the short period of infections (weeks) and long-time consequences (years), as well as the age-structure of the
d
A ,< ,K A
^3\
---------------( ______
(
1^ S E V ^ { I R
d
Fig. 1. The basic scheme of the model.
population. The incidence of varicella is seasonal and classically reaches a peak from March to May. Seasonality due to the school year is also a significant factor of the spreading of VZV.
In addition, based on a widely accepted hypothesis of exogenous boosting, contacting with an infected person will boost the waning immunity. Now, vaccination against VZV reduces the varicella infections and hence this boosting effect, and then infection of herpes- zoster will increase in 20-30 years due to the lack of immunity boosting.
In many developed countries, varicella vaccination programs are already implemented. Origi
nally one-dose programs were introduced, which have been replaced by two-dose vaccinations (see [1] and references therein) in some countries by now.
In Hungary, the vaccine is available for many years and varicella vaccination is planned to make it obligatory.
There are many country-specific studies regarding the effects and cost-effectiveness of the in
troduction of varicella vaccination, e.g. [1, 9, 3]. However, there are hardly any studies about Hungary [8], where the introduction of varicella vaccination into the routine childhood vacci
nation program is being considered.
Since the actuality and importance of this issue, in this paper we summarize the main points of such a modeling work, we consider experimentally simple compartmental models of vari
cella infections including vaccination strategies taking into account the Hungarian specialties.
We study the available demographic and epidemiological data, perform parameter estimations and present Wolfram Mathematica experiments for the possible consequences of the different vaccination strategies.
2 On the modeling process
The compartmental models we consider here do not include the age-structure of the population.
Although such a model cannot give precise forecast for the epidemiology of the varicella at particular ages, it can show the main issues and points out the critical strategic issues. Based on the models considered in the literature (see for example [1, 9]), we use the scheme on Fig. 1 with compartments representing the varicella disease states: Susceptible, Exposed, Infectious, Recovered, Susceptible to Zoster, Zoster, Zoster Immune. In developing the model and deter
mining the model parameters, we made the following assumptions.
Birth and death rates. Based on the demographic data in Hungary (since 2010) the birth rate is about 0.009 and the death rate is 0.013. The total population is decreasing, but to simplify our work, according to the literature, we assume a stable population and that the birth and death rates are equal. In our paper, we assume d = 0.01.
Infections, latency, and reactivation. Maternal immunity is not taken into account in our model.
Newborns directly become susceptible, then, one can become infected by being in contact with a varicella or zoster infectious person. Having been infected, individuals go through a non
infectious latent period, and then they will be infectious. Following the recovery, individuals acquire immunity to VZV, but the virus remains in the body in inactive form. Immunity may wane, and then the virus may reactivate causing shingles. Zoster infected people are also infec
tious (see details in the Inroduction), possibly at a lower rate than varicella infected people.
Newborns directly become susceptible, then, one can become infected by being in contact with a varicella or zoster infectious person. Having been infected, individuals go through a non
infectious latent period, and then they will be infectious. Following the recovery, individuals acquire immunity to VZV, but the virus remains in the body in inactive form. Immunity may wane, and then the virus may reactivate causing shingles zoster. Zoster infected people are also infectious, possibly at a lower rate than varicella infected people. Persons recovered from zoster are assumed to have lifelong immunity to VZV.
Exogenous boosting. As it was mentioned above, the waning immunity against VZV can be boosted if the individual has a contact with a VZV infected person. Although there is no clear picture concerning the boosting effect, the existence of the exogenous boosting seems to be valid. [6]. Assuming exogenous boosting, it is reasonable that after introducing vaccination, the number of varicella cases decreases and consequently the herpes zoster incidence temporarily increases [1,9]. Our experiments below will confirm this hypothesis.
Seasonality. Available data also shows a strong seasonality in varicella incidence. Since most infections appear among children, the academic year and summer break play an important role in the spread of VZV. To describe this phenomenon, time-dependent contact rates are needed in the model.
Based on the above statements the model is as follows:
s' = d — As — ds, Sz = —aAsz + Zr — qsz — dsz , e' = As — ee — de, i'z = qsz — niz — diz ,
i' = ee — y i — di, r'z = niz — drz , r ' = y i + aAsz — Zr — dr,
where the force of infection is A = ¡3 (i + v iz) and (.)' represents time derivative. The total population is constant and a proportional model can be used where 1 = s + e + i + r + sz + i z + r z.
One can either be boosted through exposure to VZV and regain immunity with efficiency a or become zoster infectious through reactivation of VZV with the rate q. The average length of the exposed, infectious, temporary immunity, and zoster states are e - 1, y-1, Z-1 and k- 1, respectively.
Taking into account the seasonality, the model remains of the same form, the only change is that the constant 3 is replaced by a periodic function 3(t) = 3(1 + b cos(2n t — c)) with b = 0.25 and c = 0.5. The constants b, c were given by fitting to the seasonal data (see below).
2.1 Data analysis and parameter identification
Annual varicella incidence data for 20 years and monthly data since 2010 in Hungary are avail
able to us, as monthly reporting of varicella cases to the public health authorities is mandatory.
On the other hand, herpes zoster is not reportable disease in Hungary. Therefore, there is no available data related to shingles. Hence, we need to make assumptions, based on studies from other countries.
Another problem is the underreporting. Unfortunately, the varicella incidence appears can be much higher than reported, since the annual mean birth number is about 2.5-times higher than the reported varicella cases; and according to most studies, these two values should be nearly equal [9]. There can be several reasons of underreporting: not every child is taken to the pediatrician, symptoms are individually different, in some cases clinical diagnosis is not clear and no laboratory tests are performed as there is no effective medical treatment.
Many parameters in system (1) were fixed knowing the epidemiology of VZV. As we mentioned above, d = 0.01. The length of e, i, z states are 14, 7, 9 days, hence e = 26, 7 = 52, k = 40, respectively. Immunity wanes in 20 years on average, i.e., Z = 0.05.
To find the other parameters and validate our models, we used heuristic experiments and fitting methods using Wolfram Mathematica. As zoster incidence is not available, the related parame
ters were mainly taken from the literature or experimentally fixed. The relative boosting force a = 0.7 is taken; the infectiousness of iz individuals is v = 0.07 times less than that of i.
Finally, sz may become iz at rate n = 0.003.
Values of compartments (s, e, i, r, sz, z, r z) at any time are not known, hence initial values of the solutions of system (1) were taken close to the endemic equilibrium according to the values of the parameters. Note, that solutions were started at year 2000 with these initial values.
Only the parameter ft has to be specified by fitting. Finally, based on our former arguments, the underreporting ratio q is also included into the fitting process.
The fitting model is simple: the cumulative growth of i(t) is measured by i (t) with i'(t) = ee(t), and hence the monthly and annual incidences are modeled by M M (t) = q( i (t + 1/12) — i (t)) and A M (t) = q( i (t + 1) — i (t)), respectively. Fitting was performed by the NonlinearModelfit command in Wolfram Mathematica, which can be applied to implicitly defined models such as numerical solutions of differential equations.
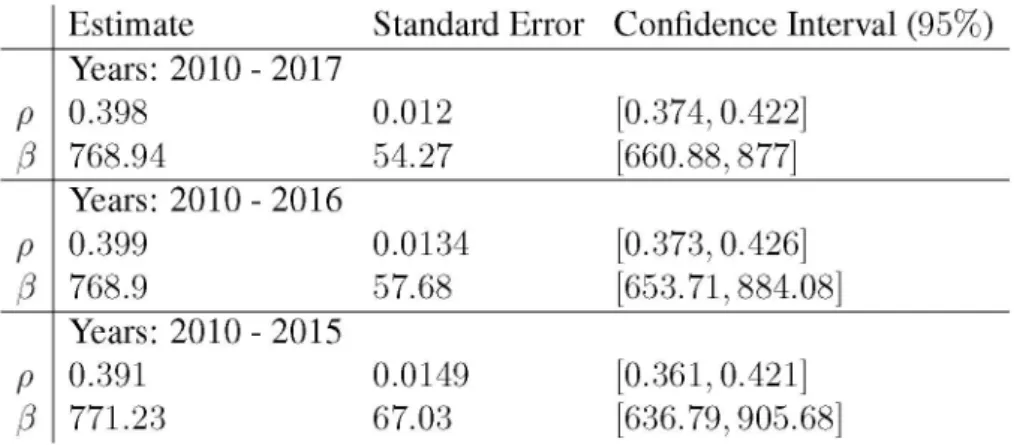
Fitting the autonomous system to neither annual nor monthly data gave proper result, due to the strong seasonality. Hence, the seasonal version of system (1) with parameters ft (transmission rate) and q (underreporting ratio) was fitted to the monthly data in the period 2011- 2017.
In order to validate the model, we have done the fitting to data on shorter intervals, i.e., 2010
2016 and 2010-2015. The final result can be seen in Tab. 1. The fitted values are practically the same. It gives a simple validation of the fitting on the interval 2010-2017. Obviously, the standard errors and confidence intervals (given at 95% level) are slightly higher at shorter time intervals. Consequently, for the sake of simplicity, we accepted the fitted values rounded ft = 770 and q = 0.4. Note that this value of underreporting ratio fits the preliminary conjectures.
The result can be seen on Fig. 2. The monthly incidence data and fitted model M M (t) can be found on the left side, while the right one contains the annual data and the fitted model A M (t) as well as the corresponding autonomous model with the same parameters. Finally, we emphasize that although the seasonality is very strong; both the monthly and annual incidence models
Estimate Standard Error Confidence Interval (95%) p
Years: 2010 - 2017
0.398 0.012 [0.374, 0.422]
p 768.94 54.27 [660.88, 877]
p
Years: 2010 - 2016
0.399 0.0134 [0.373, 0.426]
p 768.9 57.68 [653.71, 884.08]
p
Years: 2010 - 2015
0.391 0.0149 [0.361, 0.421]
p 771.23 67.03 [636.79, 905.68]
Tab. 1. The results of fitting with the seasonal model Monthly incidence
0.20
0.15
0.10
0.05
0.002010 2015 2020 2025
year
Annual incidence
year Fig. 2. Varicella incidences: data (red) and fitted model (blue).
show the same kind of oscillation. The incidence is waving and has maxima approximately at every four years. This cyclicality phenomenon is well known for infectious diseases, and the value agrees the practice. The same value can be obtained using the autonomous, nonseasonal model. It is obvious, since the non-seasonal model can be considered as an annual average of the seasonal one. Hence the period of this "waving" can be given from the largest imaginary part of the eigenvalues of the corresponding linearized system at the endemic equilibrium. Currently this value is T = 4.0438. Later on, we will use this method in case of vaccinations. Similar estimates could be found by Fourier transformation.
3 Vacciation models
Based on the original system (1) we can build a general model including vaccination. With
out age structure, basically the newborn (or infant, just entered into the system; younger than 2 years in the real life) and susceptible population are considered to be vaccinated. But the vaccine-induced immunity may wane, and hence at an older age, populations should be re
vaccinated. Later on, we will present examples for different cases, and confirm the necessity of adult vaccination. See Fig. 5.
Concerning this problem, note that in case of MMRV vaccine, 65% of vaccinated population acquires full protection after one dose and 95% after the second dose. The vaccine-induced
protection wanes in 15-20 years after one dose; while the two-dose vaccination provides lifelong immunity [9]. Hence our model is as follows:
s' = (1 — p b) d — p ss — ds — As, e' = As — e(d + e),
i' = ee — i(y + d),
r ' = —r(d + Z ) + yi + Aasz, sZ = —(d + n)sz — Aasz + Zr,
i'z = nsz — iz (d + k), rZ = kz — d rz,
v' = pbd + pss + pv,ssv — A^3v — wv
sV = —p v,ssv — dsv — Asv + wv, eV = Asv — (d + £2) ev,
iV = e2ev — iv (Y2 + d ),
rV = A^2sz,v — (d + Z2) rv + A^3v + 72 %, sz,v (d + n2) sz,v Aa2sz,v + Z2r v,
zV = n2sz,v — (d + K2) Zv, rz ,v = K2Zv — drz,v
where v is the vaccinated (immune by vaccination) compartment, and the others are the vacci
nated correspondents of the originals: sv, ev, iv, r v, sz,v, zv, r z,v. Here the force of infection A takes the form A = ft (i + vftv + vzv + viz), where ft = 770 obtained by fitting above.
The indexed parameters mean the same as nonindexed in (1) concerning the vaccinated com
partments. Since there were some uncertainties regarding to their values, we fixed them based on the literature [1,9] and consultations with epidemiological experts. In the experiments below we use the following parameter values: d = 0.01, ft = 770, e = e2 = 26, 7 = y2 = 52, v =
vi = 0.5, Z = Z2 = 0.05, n = n2 = 0.003, a = 0.7, a2 = a3 = 0.5, k = k2 = 40.
In our experiments below, the dependence on the newborn vaccination ratio pb, vaccination rate p s in s, re-vaccination rate p v,s in sv as well as the immunity waning parameter (w, reciprocal of the average length of immunity) will be investigated.
In mathematical epidemiology, the key to study the level of virulence of a disease is the basic reproduction number R 0. If R0 < 1 then the disease-free equilibrium is asymptotically stable, but if R0 > 1 the disease will persist. Based on the method in [10], R0 for system (1) was given in [2].
R 0 ftg + vft______________ ZftCft__________
(y + d)(e + d) (k + d) (e + d )(y + d)(Z + d)(n + d ) ,
With the fitted parameters, we obtain R0 = 15.0581. It is one of the highest among the infec
tious diseases. Note that in [2], the authors investigated the relation between the underreporting and estimated value of R 0.
In cases of vaccinations, the goal is to find the most effective and economically reasonable strategies, i.e., to find the optimal values of the vaccination parameters , p s, p v,s, such that the disease will eliminated. Theoretical study of R0 in vaccination models will be subject to another paper. Here, we present examples representing different cases, specific to the epidemiology of varicella. In all cases, we assume that vaccination will start in 2020.
Recall that vaccine-induced immunity may wane. After one dose, the efficacy is only about 65%, but after the second dose it is almost 100%. In the figures 3 - 8, we present either the monthly or annual incidences depending which one expresses the nature of that vaccination strategy better. If it is reasonable, we will present the corresponding vaccinated population, as well.
New Varicella/month New Zoster/month
2010 2020 2030 2040 2050 2060
year
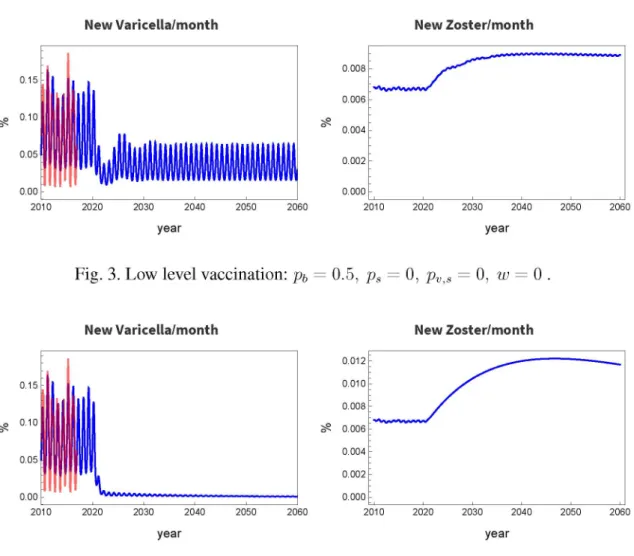
Fig. 3. Low level vaccination: pb
New Varicella/month
year
0.008
0.006
0.004
0.002
0.000
2010 2020 2030 2040 2050 2060
year
= 0.5, ps = 0, pv,s = 0, w = 0 .
New Zoster/month
year
Fig. 4. Complete newborn vaccination with no immunity waning:
Pb = 1, Ps = 0, pv,s = 0, w = 0 .
First, assume life-long immunity. In this case re-vaccination is unnecessary, thus p v,s = 0 can be taken. Countries have different policies, hence the parameters p b ,p s are country-specific [4].
Now consider only the newborn vaccination. In this case, its critical value is p b « 0.95 at the nonseasonal model [9].
Consider a case with very low value of p b = 0.5, i.e., 50% of newborns are vaccinated. Fig. 3 shows the result. Annually, 0.5% of the total population is vaccinated. The varicella incidence decreases by cca. 50%, but the incidence of zoster significantly increases and stays at this high level due to the reduced exogenous boosting.
Now, study the case of ideal vaccination pb = 1, and Fig. 4 shows the results. The varicella incidence is practically zero, but that of zoster significantly increases due to the same reason as above. Figure does not show, but it reaches the maximum in about 30 years and goes back to the value before the vaccination in 90 years. The annually vaccinated population is 1%.
Next, assume that the vaccination does not guarantee life-long immunity. Let the average wain- ing time be 20 years, i.e., w = 0.05. Even the vaccination is ideal p b = 1, the incidence of varicella slowly increases, and the seasonal oscillation is quite high (Fig. 5). On the other hand, zoster incidence first increases, but starts to decrease sooner as before (in 15 years) due to the higher level of exogenous boosting, but it stays at a higher level. This examples agrees the case
New Varicella/month New Zoster/month
0.15
0.00
2030 2040
year year
2020 2050 2060
Fig. 5. Complete newborn vaccination with immunity waning in 20 years:
Pb = 1, Ps = 0, pv,s = 0, w = 0.05.
New Varicella/month New Zoster/month
year
Vaccinated/year
2020
Newborn Susceptible Zoster susceptible
2030 2040 2050
year
2060 2070
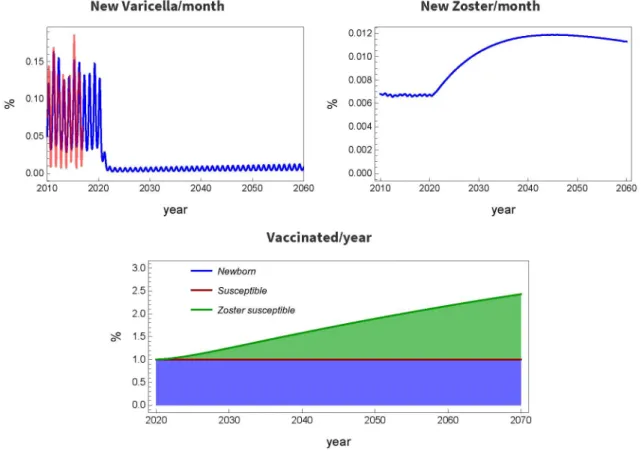
Fig. 6. Complete newborn, partial old-age vaccination with waning immunity: pb = 1, ps = 0, pv,s = 0.2, w = 0.05.
in USA, there the incidence of zoster is permanently high (see [1] and references therein).
The above example explains the necessity of vaccination of older populations. Such a case is shown in Fig. 6, where w = 0.05 (average waning time is 20 years), pb = 1 and the re-vaccination rate in compartment sv is p v,s = 0.2. The size of compartment sv cannot be measured in this model, but individuals will get into sv approximately 20 years after receiving the vaccine at their newborn age. One can see that this strategy significantly decreases the
New Varicella/month New Zoster/month
year year
Vaccinated/year
3.0 2.5 2.0 5? 1.5 1.0 0.5 0.0
2020 2030 2040 2050 2060 2070
year
--- Newborn
Fig. 7. Comprehensive vaccination, with immunity waning in 20 years:
Pb = 1, Ps = 0.2, Pv,s = 0.2, w = 0.05.
New Varicella/year NewZoster/year
Fig. 8. Temporary vaccination for 8 years:
Pb = 1, Ps = 0, Pv,s = 0, w = 0.
incidence but the zoster incidence is still high. A possible reason is that after introducing the vaccination, not only the newborns but susceptibles should be vaccinated, since they may be in this state and exposed to varicella for a long time. Such a case is shown in Fig. 7 with parameters w = 0.05, pb = 1, ps = 0.2, pv,s = 0.2.
Finally, let us consider a case, when the vaccination is temporary. It can happen if there is no financial support, or medical staff any more. Assume that the length of vaccination period is eight years, Fig. 8. One can see the negative consequences. Having canceled the vaccination,
incidence highly oscillates and the magnitudes are much higher than they used to be. It takes about 10-15 years to be back at the original level of incidence. The increased number of infec
tions means a significant overload of the medical staff, and its cost may be higher than the cost of vaccination was.
4 Conclusion
We gave an overview of some of the main questions in the modeling of the varicella epidemiol
ogy in Hungary. We fitted a very simple model to the available data of varicella infections. We developed simple models for vaccination, and experimentally forecast its impact in Hungary.
Based on our simple models the global effects and strategic goals can be already visible. The next step of our research will be to apply realistic age-structured models in order to evaluate the impact of real-life vaccination policies.
Acknowledgement. Research was supported by EFOP-3.6.2-16-2017-00015, N K FIK H 125628, 20391-3/2018/FEKUSTRAT, and MSCA-IF 748193 (G. Röst).
References
[1] BRISSON M. et al: Modeling the impact o f one- and two-dose varicella vacci
nation on the epidemiology o f varicella and zoster, Vaccine, 2010, 28(19):3385- 3397.
[2] CSUMA-KOVÁCS R., DUDÁS J., KARSAI J., DÁNIELISZ Á., MOLNÁR Zs., RÖST G.: Challenges in the modelling and control o f varicella in Hungary, to appear.
[3] DAMM O. et al: Systematic review o f models assessing the economic value o f routine varicella and herpes zoster vaccination in high-income countries. BMC public health, 2015, 15(1):533
[4] ECDC Preliminary guidance: Varicella vaccine in the European Union, https://ecdc.europa.eu/sites/portal/files/media/en/publications/Publications/Varicella- guidance-2014-consultation.pdf, page 18.
[5] KNIPL D., RÖST G.: Modelling the strategies fo r age specific vaccination scheduling during influenza pandemic outbreaks. Mathematical Biosciences and Engineering, 2011, 8(1):123-139
[6] MARANGI Z. et al: The natural history o f varicella zoster virus infection in Norway: Further insights on exogenous boosting and progressive immunity to herpes zoster, PLOS ONE, 2017, 12(5):e0176845.
[7] MEDIC S. et al: Varicella zoster virus transmission dynamics in Vojvodina, Ser
bia. PLOS ONE, 2018, 13(3):e0193838.
[8] MESZNER L. et al: Economic burden o f varicella in children 1-12 Years o f age in Hungary 2011-2015. BMC Infectious Diseases, 2017, 17(1):495-595.
[9] OUWENS M.J.N.M. et al: The Impact o f 2-Dose Routine Measles, Mumps, Rubella, and Varicella Vaccination in France on the Epidemiology o f Varicella and Zoster Using a Dynamic Model With an Empirical Contact Matrix. Clinical Therapeutics, 2015, 37(4):816-829.
[10] SCHUETTE M.C.: A qualitative analysis o f a model fo r the transmission o f varicella-zoster virus. Mathematical Biosciences, 2003, 182(2):113-126.
Current address
Karsai János, doc., CSc.
Bolyai Institute
Faculty of Science and Informatics University of Szeged
Aradi vértanúk tere 1, Szeged, Hungary E-mail: karsai.janos@math.u-szeged.hu Csuma-Kovács Rita, MSC. stud.
Bolyai Institute
Faculty of Science and Informatics University of Szeged
Aradi vértanúk tere 1, Szeged, Hungary E-mail:csuma.rita@math.u-szeged.hu Dudás János, Res. assoc., MSc.
Bolyai Institute
Faculty of Science and Informatics University of Szeged
Aradi vértanúk tere 1, Szeged, Hungary E-mail:dudasj@math.u-szeged.hu Dánielisz Ágnes, MD.
National Public Health Center, Budapest, Hungary E-mail: danielisz.agnes@nnk.gov.hu
Molnár Zsuzsanna, MD.
National Public Health Center, Budapest, Hungary E-mail: molnar.zsuzsanna@nnk.gov.hu
Gergely Röst, doc., PhD.
Bolyai Institute
Faculty of Science and Informatics University of Szeged
Aradi vértanúk tere 1, Szeged, Hungary E-mail: rost@math.u-szeged.hu