Analysis of the Heart Sounds and Murmurs of Fetuses and Preterm Infants
Ad´ ´ am Tam´ as Balogh
A thesis submitted for the degree of Doctor of Philosophy
Supervisors:
Ferenc Kov´acs, DSc
Doctor of the Hungarian Academy of Sciences and
Tam´as Roska, DSc
Ordinary member of the Hungarian Academy of Sciences
P´azm´any P´eter Catholic University Faculty of Information Technology
Multidisciplinary Technical Sciences Doctoral School Budapest, 2012
To my lovely wife Ram´o
Acknowledgements
Despite having a strong fascination for becoming an engineer from childhood on, after the first semester of my undergraduate studies I became really un- sure about continuing my education in electrical and computer engineering and I was thinking of changing to medical studies. However, I remained at information technology, and a few weeks later I became aware of the fetal phonocardiographic research at our faculty, something what I was really look- ing for – working a little bit as a physician, but being an engineer. This is why I am so deeply grateful to my supervisor Ferenc Kov´acs who invited me to his research group and shared with me his knowledge and his approach to scientific research, as well as for the long conversations and the support in many ways.
I am also very grateful to my other supervisor Tam´as Roska who, though not as directly involved with my research, has encouraged me in a great manner with his enthusiasm and fatherly guidance.
I am also very thankful to the physicians of the 1st Department of Paediatrics, Semmelweis University of Medicine, Budapest, especially to Mikl´os Szab´o, head of department, to K´alm´an Tory, who mentioned to me the idea of in- vestigating preterm infants using phonocardiography, and Zolt´an Moln´ar, who introduced me to the world of preterm infants and without whom the measure- ments could not have been performed. Special thanks go to the nurses of the neonatal intensive care unit who helped me a lot in recording the heart sounds of preterms. I also thank to Krisztina K´ad´ar from the Gottsegen Gy¨orgy Na- tional Institute of Cardiology, Budapest, and Zsolt Varga from the Markhot Ferenc Hospital, Eger, who gave indispensable aid to me regarding the exami- nation of the fetuses.
A lot of the research has been performed as teamwork, and I am extremely grateful to all, former and present colleagues of the PCG research group, in par- ticular to Katalin Barkai, G´abor Fodor, ´Agnes G´al, ´Ad´am Gazda, Barnab´as Gera, Csaba Horv´ath, M´onika Hujter, J´ozsef Jo´osz, No´emi Kersner, Endre K´osa, L´aszl´o Koz´ak, Andrea Nagy, P´eter Talab´ar, B´alint ¨Uveges, Krisztina Zsedrovitsn´e G˝ocze and Tam´as Zsedrovits. Many thanks to Bal´azs J´akli, Nor-
bert S´ark´any, ´Akos Tar and J´ozsef Veres from the Robotics Lab and to Attila Tihanyi for helping in the development of the measuring equipment.
Thanks to older and younger, former and present fellow PhD students and colleagues, especially to ´Eva Bank´o, B´ela Weiss, B´alint Sass, D´aniel Szolgay, Norbert B´erci, Bal´azs Karl´ocai, Gergely Trepl´an, D´avid Tisza, R´obert Tibold, Tam´as Pilissy, Andr´as Kiss, Bal´azs Varga, K´alm´an Tornai, Vilmos Szab´o, An- drea Kov´acs, Andr´as Gelencs´er, Zolt´an K´ar´asz, L´aszl´o F¨uredi, ´Ad´am Fekete G´abor Tornai, Csaba Nemes, Zolt´an Tuza, J´anos Rud´an, Istv´an Reguly, Endre L´aszl´o, Csaba J´ozsa, Gy¨orgy Cserey, Andr´as Ol´ah, Krist´of Karacs and Mikl´os Gy¨ongy.
I would like to thank P´eter Szolgay, head of Doctoral School, Barna Garay and ´Arp´ad Csurgay for professional and personal help. I acknowledge also the kind help of the personnel of Students’ Office, in particular Katinka Tivadarn´e Vida, the Dean’s Office, the Financial Department and the IT Department. I am also very thankful to Vikt´oria Sifter from the Library.
I would like also to express my deepest gratitude to my family and to all my friends, who helped and supported me in many-many ways, often not even knowing of it. I thank to my sister, Zsuzsi, in helping correcting many mistakes of my dissertation.
And, although it cannot be formulated in words, thank you, my lovely Ram´o.
I am so very grateful to all the Blessings I have received.
Abstract
Cardiac auscultation is one of the oldest examination methods. Despite the development of modern imaging techniques the stethoscope is still considered a symbol of the doctor’s profession. At the beginning of the 21th century auscultation has found its main role in primary and in home health care when decisions have to be made about any further, more extensive examinations or special care. However, it seems that the real potential of heart sound analysis is still not exploited, especially in the field of fetal-neonatal examinations.
The aim of this thesis work has been twofold. First, recent studies showed that the fetal heart sound signal contains much more information than currently utilized in routine cardiotocographic examinations. Although a multitude of tools have been developed in the recent decades for the analysis of phonocar- diographic (PCG) signals, their adaptation to fetal PCG is not straightforward because of differences in the cardiac anatomy, physiology and in the proper- ties of the recorded signal (for instance bandwidth). Another major issue is the high level of noise. In this dissertation I present results on improved fetal heart rate calculation based on a method in the time-frequency domain. Fur- thermore, I describe a heart sound model which can be applied for parameter estimation of the first heart sound. The most important result outlined is the investigation of fetal heart murmurs, which could be a tool contributing to the widespread screening for congenital heart diseases prenatally.
A second aim of this work has been the application of phonocardiography to preterm infants with patent ductus arteriosus (PDA). I investigated the possibility of monitoring the state of the PDA through parameters of the heart sound signal. For this reason I introduced a method for sensitive detection of the murmur produced by turbulent blood flow through the ductus arteriosus and extracted parameters of the murmur which showed a relationship with important medical parameters. Another approach was the examination of the separation of the aortic and pulmonary components of the second heart sound (splitting). I applied a heuristic decomposition method and verified this procedure on an adapted heart sound model for preterm neonates. Based on this analysis I found that there is an increased splitting around the time of the closure of the PDA in the case of preterm infants receiving medication for closure.
Contents
Contents vii
List of Figures xi
List of Tables xv
List of Abbreviations xvii
1 Introduction 1
1.1 Preface . . . 1
1.1.1 Motivations and aims . . . 3
1.1.2 Phonocardiography in the case of fetuses . . . 3
1.1.3 Phonocardiography in the case of preterm infants . . . 8
1.2 Methods . . . 10
1.3 Framework of the dissertation . . . 12
1.3.1 General notes . . . 12
2 Origin of Heart Sounds & Murmurs 13 2.1 The anatomy of the human heart . . . 13
2.1.1 Heart valves . . . 14
2.1.2 The fetal and neonatal circulation . . . 15
2.2 The dynamics of the heart . . . 17
2.3 Heart sounds & murmurs – terminology and definitions . . . 18
2.3.1 Heart sounds . . . 18
2.3.2 Heart murmur . . . 20
2.4 Heart diseases . . . 22
2.4.1 Heart valve diseases . . . 23
2.4.2 Congenital heart diseases . . . 24
3 Methods for Phonocardiographic Signal Analysis 29 3.1 Cyclostationary processes . . . 29
3.2 Spectral analysis of nonstationary signals . . . 31
3.2.1 The short time Fourier transform . . . 32
vii
3.2.2 The wavelet transform . . . 33
3.2.3 Overcomplete representations . . . 34
3.2.4 Quadratic time-frequency distributions . . . 35
4 Phonocardiography for Fetuses 39 4.1 Recording of the fetal heart sound signal . . . 39
4.2 Fetal heart rate . . . 42
4.2.1 Importance of the fetal heart rate . . . 42
4.2.2 Calculation of the fetal heart rate in the time domain . . . 42
4.2.3 Application of the wavelet transform to fetal heart rate calculation . 48 4.2.4 Results . . . 50
4.3 Components of the heart sounds . . . 55
4.3.1 Fetal heart sound model and parameter estimation . . . 57
4.4 Fetal heart murmur and congenital heart diseases . . . 62
4.4.1 Principles of fetal murmur detection . . . 62
4.4.2 Characteristic heart sounds by improved ensemble averaging . . . . 63
4.4.3 Characteristic heart sound calculation for murmur detection . . . 65
4.4.4 Significance of fetal murmur detection . . . 68
5 Phonocardiography for Preterm Infants with Patent Ductus Arteriosus 75 5.1 Biophysical background . . . 76
5.1.1 Short theoretical summary on the generation of murmurs . . . 76
5.1.2 Splitting of the S2 heart sound in the case of PDA . . . 80
5.2 Measurements . . . 80
5.2.1 Recording equipment . . . 83
5.3 Methods . . . 84
5.3.1 Heartbeat detection . . . 85
5.3.2 Improved ensemble averaging revisited . . . 86
5.3.3 Detection of murmur related to PDA . . . 87
5.3.4 Parameter extraction of the murmur . . . 89
5.3.5 Heuristic method for estimating the S2 splitting . . . 91
5.4 Results . . . 94
5.4.1 Heart sound detection . . . 94
5.4.2 Detected murmur related to PDA . . . 95
5.4.3 Relation of murmur parameters and parameters of the PDA . . . 95
5.4.4 Analysis of the S2 split of preterms with PDA . . . 97
5.5 Conclusions of the phonocardiographic investigations of preterms with PDA 99 6 Conclusions 101 6.1 New scientific results . . . 102
6.2 Possible Applications . . . 108
CONTENTS ix
Appendix A – Significance of Fetal Heart Murmur Detection 109 A.1 Case reports . . . 109
Bibliography 111
List of Figures
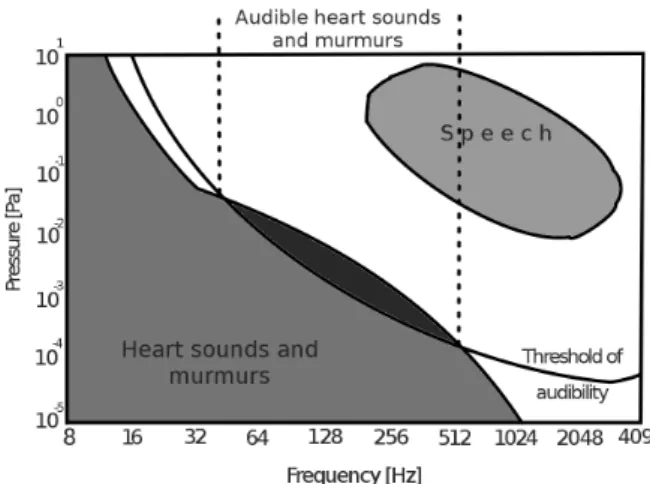
1.1 Intensity of heart sounds and murmurs in correspondence with the threshold
of audibility and speech. . . 3
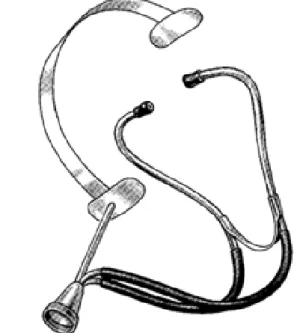
1.2 The DeLee-Hillis stethoscope (fetoscope) for fetal auscultation. . . 4
1.3 Fetal heart rate (FHR) diagram. . . 5
1.4 The difference between normal circulation and abnormal circulation due to patent ductus arteriosus. . . 9
2.1 The schematic representation of the human heart. . . 14
2.2 The cross-section of the heart showing the four heart valves. . . 15
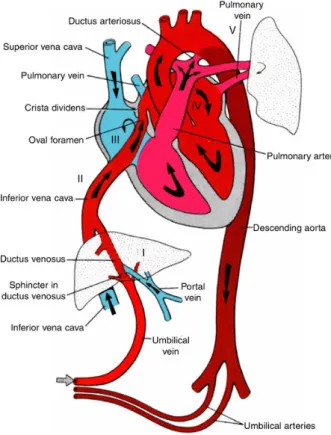
2.3 Fetal circulation. . . 16
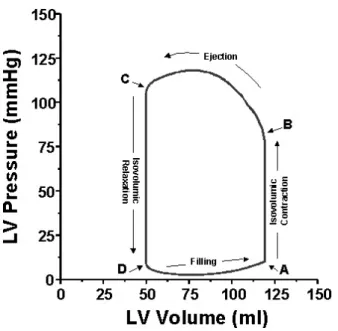
2.4 The pressure-volume curve of the left ventricle. . . 17
2.5 The Wiggers diagram. . . 19
2.6 Three heart cycles of typical fetal and preterm neonatal heart sound record- ings. . . 19
2.7 Fetal heart sound record with 60 ms S1 split. . . 21
2.8 Fetal heart sound record with a significant systolic murmur. . . 21
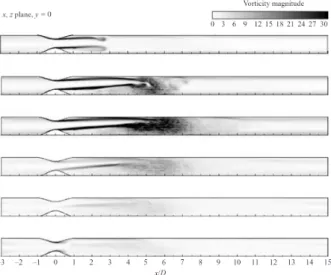
2.9 Sequence of normalized averaged vorticity magnitude contours. . . 21
4.1 Fetal monitoring telemedicine system. . . 40
4.2 Phonocardiographic CTG device type Fetaphon-2000TM . . . 40
4.3 Noiseless and noisy fetal phonocardiographic signals. . . 40
4.4 Sources of noise corrupting the low intensity fetal heart sound signal. . . 41
4.5 Heart sound detection based on the Shannon energy and Teager energy. . . 43
4.6 Consecutive 9 fetal S1 sounds time aligned by maximizing the cross- correlation between them. . . 44
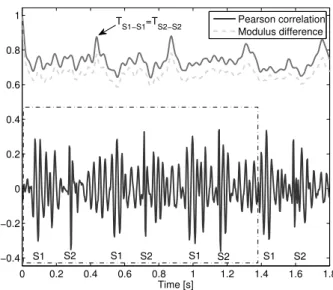
4.7 A noiseless fetal PCG segment and the corresponding Pearson correlation and modulus difference values. . . 45
4.8 A noisy fetal PCG segment and the corresponding Pearson correlation and modulus difference values. . . 45
4.9 The correlation data of the noiseless segment shown in Fig. 4.7 and of the noisy segment shown in Fig. 4.8. . . 46
xi
4.10 Possible range of HiR values for different level of noise in the case of the
time domain based correlation. . . 48
4.11 Motivation for applying the wavelet transform for FHR calculation . . . 49
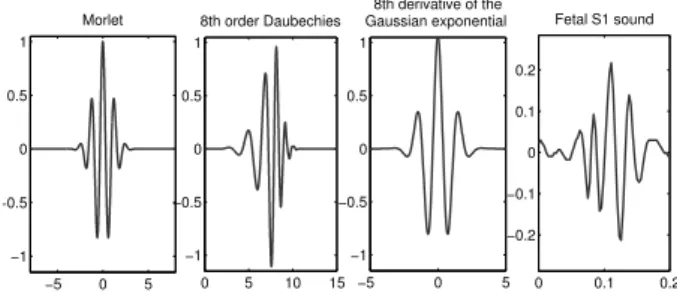
4.12 Three possible mother wavelets for fetal PCG analysis. . . 49
4.13 A fPCG segment and the corresponding time-scale representation. . . 51
4.14 An approximately 1-minute long fPCG segment of a fetus with grade III-IV tricuspid insufficiency producing fetal heart murmur. . . 51
4.15 FHR calculated using the wavelet transform based approach and the time domain correlation. . . 52
4.16 The difference between the HiR of the wavelet transform based method and the time domain based method with respect to the noise level of the given fetal PCG recording. . . 53
4.17 Possible range of HiR values for different level of noise in the case of the time domain based correlation and the wavelet transform based method. . . 54
4.18 The difference between the HiR of the wavelet transform based method using 2D modulus difference and the time domain based correlation method with respect to the noise level of the given fetal PCG recording. . . 54
4.19 Block diagram of a possible realization of a FHR calculation algorithm including the wavelet transform based approach. . . 55
4.20 A fetal S1 sound and the result of the Monte Carlo based model fitting. . . 61
4.21 The time-frequency distribution of the fetal S1 sound from Fig. 4.20 and the corresponding synthesized heart sound. . . 61
4.22 The histogram of the achieved normalized root mean square errors of the modelling of more than one hundred fetal S1 heart sounds . . . 62
4.23 Heart murmur of an infant with pulmonary atresia before birth and after birth. . . 63
4.24 Block diagram of the characteristic heart sound calculation algorithm. . . . 65
4.25 The characteristic murmur of a record from a fetus with Tetralogy of Fallot. 66 4.26 The characteristic heart cycle of a fetus with a ventricular septal defect. . . 67
4.27 The characteristic heart cycle of a healthy fetus. . . 67
4.28 The characteristic heart cycle and the corresponding heart cycles of the fetus with Tetralogy of Fallot. . . 70
4.29 Segments of fetal and postnatal phonocardiographic recordings of a fetus with pulmonary atresia combined with a ventricular septal defect and major aorto-pulmonary collateral arteries. . . 71
4.30 A segment of the phonocardiographic recording of the fetus with tricuspid insufficiency related to Ebstein syndrome. . . 72
4.31 The distribution of three murmur parameters (length, intensity, dominant frequency). . . 73
5.1 Schematic illustration of the flow through a stenosed segment. . . 77
LIST OF FIGURES xiii
5.2 Theoretical wideband spectrum of the wall pressure fluctuations generated by stenosis in a tube. . . 79 5.3 Average spectrum of the systolic and diastolic segments of a preterm infant
with PDA. . . 79 5.4 A split S2 sound of preterm treated pharmacologically in the time and in
the time-frequency domain. . . 80 5.5 The direct connection between the main arteries via the ductus arteriosus. . 81 5.6 The self assembled electronic stethoscope. . . 83 5.7 The design of the stethoscope head with space for the microphone to fit
inside the head and the manufactured stethoscope. . . 83 5.8 Comparison of data recorded with the commercial stethoscope head and
the self-designed stethoscope head. . . 84 5.9 The effect of condense water in the breathing tube on the PCG recordings. 85 5.10 General scheme of the analysing method. . . 85 5.11 Time windows used for extracting heart sounds for cross-correlation. . . 87 5.12 Characteristic S1 sound and characteristic S2 sound of a preterm after the
closure of PDA. . . 88 5.13 Characteristic S2 sound of a preterm with PDA. . . 88 5.14 Steps of murmur detection using adaptive thresholding of the envelope of
the systolic segment. . . 90 5.15 Original S2 sound of a preterm and the synthesized S2 sound based on a
model described in this work. . . 92 5.16 A synthesized S2 sound and its high-passed filtered versions. . . 93 5.17 A synthesized S2 sound with an SI of 7 ms, the aortic and pulmonary
components and the heuristic decomposition. . . 94 5.18 Results of the heuristic heartbeat detection method with different resolutions. 94 5.19 Detected heart murmur related to PDA of a preterm infant. . . 96 5.20 Extracted murmur parameters vs. medical parameters of the PDA. . . 96 5.21 The S2 sound of a preterm infant recorded after the closure of the PDA and
the result of the heuristic method. . . 97 5.22 Two cardiac cycles of a preterm with PDA before the surgical intervention
and after the surgical intervention. . . 98 5.23 Box plot of the estimated SI over several days of four preterm infant with
PDA treated pharmacologically. . . 99
List of Tables
4.1 Parameter intervals for heart sound modelling . . . 60 4.2 Fetuses with verified clinical diagnosis and the parameters of detected fetal
heart murmur . . . 69 5.1 Parameters of the examined preterm neonates . . . 82
xv
List of Abbreviations
A2 Aortic component of the second heart sound
ASD Atrial septal defect
BPM Beats per minute (heart rate)
CF Confidence factor for heart rate calculations
CFD Computational fluid dy- namics
CHD Congenital heart disease CTG Cardiotocography DPDA Diameter of the PDA ECG Electrocardiography
FFT Fast Fourier transformation FHR Fetal heart rate
fPCG Fetal phonocardiography HiR Hit rate
HRV Heart rate variability IUGR Intrauterine growth restric-
tion
LA/Ao Left atrial to aortic root ra- tio
LSEVmax Average maximal late sys- tolic envelope value
MCG Magnetocardiography
NL Noise level of a PCG
recording
NRMSE Normalized root mean square error
NST Nonstress test
P2 Pulmonary component of the second heart sound PCG Phonocardiography PDA Patent ductus arteriosus S1 First heart sound S2 Second heart sound SI Splitting interval SNR Signal-to-noise ratio
STFT Short time Fourier trans- form
STV Short-term variability Tbb Beat-to-beat time TOCO Uterine contraction TOF Tetralogy of Fallot
vmax maximal blood velocity through the PDA
VSD Ventricual septal defect WVD Wigner-Ville Distribution
xvii
Chapter 1
Introduction
“Itt nem vagyok idegen Fekszem a sz´ıveden
´es hallom, hogy dobog.”
Akos – Adj hitet!´
“And the sound of your heart,” he continued.
“It’s the most significant sound in my world.”
Stephenie Meyer – Eclipse
1.1 Preface
Phonocardiography (PCG) deals with processing of the acoustic signals produced by the mechanical actions of the heart resulting in the vibration of the valves, heart muscle tissues and great vessels [13]. One of the central issues is to extract the different heart sounds from a noisy recording and relate them to the corresponding cardiac event. Moreover, heart sounds can be further analysed and certain features can be extracted for estimating the underlying cardiac parameters.
The importance of the heart was already realized in the fourth century B.C., although with some misconceptions: Aristotle argued that it was the seat of intelligence, motion and sensation [14]. From the medical perspective, Hippocrates noted already an early form of auscultation by holding an ear against the chest, but in his works he described only breathing sounds. Blood circulation was first described by William Harvey, an English Physician in 1628. In the same century, the polymath Robert Hooke (1635-1703) described
1
the diagnostic potential of heart sounds [15]:
“I have been able to hear very plainly the beating of a Man’s Heart . . . Who knows, I say, but that it may be possible to discover the Motions of the hemal Parts of Bodies . . . by the sound they make, that one may discover the Works performed in the several Offices and Shops of a Man’s Body, and thereby dis- cover what Instrument or Engine is out of order.”
These investigations lead to the invention of the stethoscope in 1816 by R. T. H.
Laennec, and a century later the fetoscope for fetal heart sound examination. Nowadays, because of new advances in cardiac imaging, cardiac auscultation has become a preliminary test in the primary health care. On the other hand, due to the limited financial and human expert resources and the development of modern low cost computational devices in information technology, phonocardiography emerges also as a topic of current research and a possible tool aiding clinical decision making.
When describing the state of the art of PCG it is often compared to electrocardiogra- phy (ECG), a similar noninvasive examination method, so to say the electronic counterpart of PCG. A main difference is that greater success was achieved in standardizing ECG in contrast to classical PCG [13]. However, due to improvements in sensor technology and the availability of inexpensive computing devices, the concept of intelligent stethoscope gains importance, especially in telemedical applications [10, 16–18], screening of children [19–23]
or even in anesthesiology [24]. The engineering part of these tasks motivates also the development of methods for phonocardiographic signal processing using approaches in the time domain [25–27], in the frequency and in the time-frequency domains [28–32], or in the field of nonlinear dynamics [33–35]. PCG is regarded also as a promising tool for early identification of coronary artery disease [36, 37]. Another current research topic, where PCG comes into view, is the assessment of malfunctioning prosthetic heart valves [38, 39].
All these current examples show the potential of PCG in present healthcare.
That phonocardiography offers unexplored possibilities is especially valid for the ex- amination of fetuses because of their hidden position enabling the usage of only a limited number of monitoring techniques. Furthermore, due to its passive nature causing no ir- radiation at all, fetal phonocardiography can be applied for long-term monitoring. The development of adequate methods, which are certainly needed because of the great amount of data, could enable nearly continuous monitoring of the wellbeing of the fetus. Further- more, the detection of abnormal heart sounds could contribute to the early diagnosis of cardiac anomalies.
Computerized phonocardiography is also a tool for quantitative and objective anal- ysis which is missing in classical auscultation. This can be exploited, for instance for the monitoring of certain cardiac diseases by assessing the underlying cardiac dynamics.
1.1 Preface 3
Nonetheless, for achievements in PCG the knowledge of the cardiologists, electric, com- puter and mechanical engineer has to be combined, making it an exciting and difficult multidisciplinary field of science.
1.1.1 Motivations and aims
Phonocardiography is not only the computerized form of auscultation. It opens new possibilities for the noninvasive examination of the functioning of the heart because, for instance, an important part of the intensity and frequency distribution of the heart sounds and murmurs is out of the human hearing range (Fig. 1.1), especially in the case of noise- contaminated fetal or preterm heart sound recordings.
Figure 1.1: Intensity of heart sounds and murmurs in correspondence with the threshold of audibility and speech. Figure redrawn from Leatham [40].
Some other advantages of PCG have been already mentioned earlier and will also be highlighted in the following sections. There is a great variety of questions in this field which can be addressed from both a medical and an engineering point of view. The focus of my research can be summarized as follows: Investigation of methods for the comput- erized analysis of phonocardiographic recordings from fetuses and preterms for aiding the diagnosis and monitoring of cardiac anomalies and diseases, with special attention to the extraction of parameters from the heart sounds and murmurs.
In the following sections an introduction is given to the application of phonocardiog- raphy in the case of fetuses and preterm neonates.
1.1.2 Phonocardiography in the case of fetuses
Fetal examinations are an important field of healthcare, but due to the hidden position of the fetus, special measuring problems appear. It is a somewhat surprising that the
observation of fetal heart sounds – despite its quite obvious medical significance – has not been described before the 17th century. The first note on fetal heart tones is a poetry from a french man, Phillipe LeGaust, who was a colleague of a physician, Marsac, credited with first having heard the fetal heart. Nonetheless, this observation remained unnoticed until around 1820 when a Swiss and a French obstetrician, independent from each other, de- scribed the potential diagnostic significance of fetal heart sounds, but listening to the fetal heart tone became clinical practice only after 1833 when Evory Kennedy of Dublin pub- lished an extensive book in order to convince clinicians of the value of the aforementioned findings [41].
The first fetal heart sound examinations were performed by placing the ear on the maternal abdomen. Later, much attention was paid to whether auscultation with Laen- nec’s instrument, the stethoscope, is more appropriate than auscultation with direct ear contact. In 1917, David Hillis, an American obstetrician described an instrument called head stethoscope or fetoscope, which is a stethoscope attached to the head of the obste- trician keeping his hand free during the auscultation. Because DeLee, chief of staff at the same institute, claimed the innovation to be his idea, this instrument subsequently came to be known as the DeLee-Hillis stethoscope, and has changed little since its early development [42].
Figure 1.2: The DeLee-Hillis stethoscope (fetoscope) for fetal auscultation, keeping the hands of the obstetrician free during the examination.
The first commercially available electronic fetal heart rate monitor was developed by Konrad Hammacher and Hewlett-Packard in 1968, using external tocography and phono-
1.1 Preface 5
cardiography. Subsequent improvements allowed the addition of external ultrasound and intravaginal fetal electrocardiographic monitoring. After several decades of improvement, the most widely used noninvasive method for cardiotocography (CTG), which focuses on measuring the fetal heart rate and on simultaneous indication of the womb contrac- tions (TOCO), is the ultrasound Doppler CTG. The measurement is based on the Doppler principle detecting the movement of the heart wall by the frequency change of the reflected ultrasound beam [43].
From the 1970s on ultrasound-based equipment became one of the most important tools for obstetrician examinations. At present, ultrasound echocardiography is the most informative noninvasive method providing reliable data about the morphology of the heart with possible malformations, furthermore about blood flow velocities. The disadvantage of this examination is that the equipment is expensive and well-skilled expertise is needed for obtaining and evaluating the data, which limits its usability for widespread screening.
The more simple measurement of cardiotocography is the traditional nonstress test (NST) in the third trimester by which some basic fetal parameters may be obtained reflecting the actual status of the fetus. These parameters are derived from a 20-minute long record producing the fetal heart rate (FHR)-diagram (Fig. 1.3.). Among the main features are the visually well observable accelerations of the heart rate. A further characteristic feature of the diagram is the fluctuation from which the heart rate variability (HRV) is calculated, which is related to the neuronal control of the heart rate. The third parameter is the mean value (baseline) of the heart rate calculated as the average value but ignoring the outstanding sections (such as the accelerations) of the diagram. The abrupt decrease of the FHR (deceleration) might indicates an abnormal situation of the pregnancy, especially when it follows a womb contraction in a given delay [42]. All these parameters have official definitions [44], but there is still much research and controversy on the significance of FHR.
Figure 1.3: Fetal heart rate (FHR) diagram from a 10-min long recording. Three acceler- ations are observable.
Although the ultrasound Doppler CTG is a robust method, it has some limitations. It
is still a topic of scientific debate whether ultrasound exposure has an adverse effect on the developing fetus [45–48], which should also be taken into account in the case of echocar- diographic examinations. Furthermore, when compared with direct fetal ECG – the most accurate method for FHR determination – the beat-to-beat time (Tbb) values show an average absolute error of ∆TRR=2.98 ms with a standard deviation of σTRR =4.18 ms, and a significant decrease in the short term HRV parameters of even 40 % [49]. It should be also mentioned that this method does not provide any information about the inner part of the heart, for instance about the operation of the valves or about the presence of a septum defect or other abnormality.
There are three other methods to carry out CTG measurements, namely electrocardio- graphy (ECG), magnetocardiography (MCG) and phonocardiography, which are described in turn below.
Fetal electrocardiography (fECG) is one of the gold standards for determining the fetal heart rate and thus obtaining fetal HRV parameters. A disadvantage is that in the noninvasive scenario the electrodes are attached to the maternal abdomen which introduces heavy signal processing requirements for extracting the weak fetal ECG signal from the noisy recordings containing also the strong maternal ECG signal and electromyographic signals [50, 51]. Furthermore, in the last month and in the 28th to 34th weeks of the pregnancy the reliability of this fECG decreases to 60 % due to the presence of the vernix caseosa1 [52–56]. However, its passive nature enables very long measurements, which can be utilized for studying the FHR variability [57], and the analysis of ST segments enables the more reliable diagnosis of perinatal fetal hypoxia [58].
Magnetocardiography can also be used for noninvasive CTG measurements. The prob- lems with this method are the expensive equipment and the skilled personnel required, but the obtained R-R time intervals and the corresponding FHR values are very accurate and suitable for deriving further parameters. As an example, maternal-fetal heart rate syn- chronization has been investigated with fMCG [59]. In another study the changes in the low frequency bands of the spectral density of the R-R interval function with gestational age were examined in order to find relations to the development of the fetus [60].
The three formerly mentioned methods for CTG measurements, perhaps except fECG, have some limitations regarding the following aspects:
• long-term measurements,
• widespread screening of pregnant women,
• evaluation of further features, for example heart murmur.
Regarding long-term measurements it should be noted that a 20-minute measurement is
1The vernix caseosa is a waxy or cheese-like white substance found coating the skin of newborn human babies
1.1 Preface 7
rather short to get a true information about the fetal status. This is partly because the fetal status is dependent on the current environment, such as time of day, state of the mother, and so on. Because of ultrasound irradiation on the intrauterine environment long-term ultrasound-based CTG measurement, including its home monitoring application, is not preferred. The long-term application of MCG is safe and suitable, the only obstacle is the very complex measuring scenario. Fetal ECG fulfils most of the requirements, although the low SNR, especially in the presence of the vernix caseosa, limits the capability of identifying the effect of cardiac abnormalities on the electric waveform.
A re-emerging method for CTG measurements is fetal phonocardiography (fPCG).
This is a simple technique for recording transabdominally the acoustic signal of the fetal cardiac system. The signal is usually corrupted by noise originating from fetal motions and from the maternal heart and digestive system, however, new advance in signal processing show a promise for identifying significant features of the fPCG signal related to the fetal wellbeing.
There are relatively few scientific contributions to fPCG. In one of the earliest con- tributions to fetal PCG, patterns of the fetal phonocardiogram were correlated with fetal breathing movements and other fetal movements [61]. For denoising the fPCG signal several methods were investigated, for example the wavelet transform [62] or adaptive filtering [63].
The beat-to-beat time (Tbb) measured simultaneously with fPCG and fetal ECG was compared by Ortiz et al.[64]. They found that the average Tbb time correlated well, and heart rate variability measures in the very low and low frequency range agreed between the two methods. On the other hand, the power spectral density of the HRV differed in the high frequency range (above 0.3 Hz), which was attributed to physiological differences between the two measured phenomena and to possible errors resulting from the signal processing. The first one is not completely justified, in the case of the latter there is a possibility for improvement, attempted also in the present work.
Screening for congenital heart diseases
A further important topic in obstetrics is the detection of diseases, in particular cardiac diseases because any abnormality in the fetal circulation might have serious consequences, for instance the injury of the brain [65]. Comprehensive echocardiographic examination is the most accurate method for detecting cardiac malformations during pregnancy, but it is expensive and needs skilled expertise. Since the prevalence of congenital heart dis- eases (CHD) is estimated to be around 8/1000 live births [66, 67], there is a necessity for examination methods which can be used for widespread screening. A detailed echocar- diography examination is usually suggested based on risk factors or on an abnormal four-
chamber view, and some reports suggest that the inclusion of the three-vessel view in the screening would also increase the detection rate [68]. Risk factors, such as advanced ma- ternal age, family history of genetic disorders, gestational diabetes or multiple pregnancy define the high-risk population, whose screening is worldwide more or less solved [69].
On the other hand, detection of CHDs in the low-risk population, where most fetal cardiac malformation cases occur and only routine screening is performed with greatly varying training of the operator, remains still a challenge [69,70]. It is problematic because moderate symptoms of anomalies remain usually unnoticed. Based on present screening methods the rate of prenatally identified cardiac abnormalities is still only around 50 % or even less [71], whereas recent studies indicate that prenatal diagnosis of congenital cardiac defects is important during delivery [72], and improves outcome, for instance in the case of duct-dependent heart defects [73, 74]. These studies underline the importance of widening the possible techniques for fetal heart examinations in order to minimize the number of unforeseen cases requiring urgent treatment after delivery.
Echocardiography, being expensive, is not a suitable tool for prenatal screening of the low-risk population, but is unconditionally necessary for the detailed examination of the patients found positive by some screening. The capability of Doppler CTG for discovering additional features is limited to the investigations based on the time- and frequency-analysis of the FHR data, which is useful for assessing intrauterine growth re- striction (IUGR) and the neural development of the fetus. However, cardiac anomalies usually do not manifest themselves in the FHR and a further problem is that FHR variabil- ity measures calculated from Tbbs of the Doppler CTG proved of decreased accuracy [49].
As already mentioned, fetal ECG and MCG methods are much more reliable concerning the timings and the signal shapes, they are also a topic of current research, but some major limitations are present, for instance due to the measuring scenario and the vernix caseosa.
It appeared based on the analysis of the recordings of the high-volume CTG mea- surements from the last ten years that the PCG method is capable of detecting some additional features of the fetal heart as well, such as the splitting of heart sounds – related to abnormal pressure ratios – and murmur – originating form a turbulent blood flow –, which may be used for indications of some CHDs.
1.1.3 Phonocardiography in the case of preterm infants
Phonocardiography can be applied also in other fields of healthcare. One of them, in- vestigated in this work, is the examination of preterm neonates, in particular preterms with a certain congenital heart disease called patent ductus arteriosus (PDA). This dis- ease affects a certain essential fetal vessel, the ductus arteriosus, which should close after
1.1 Preface 9
birth (Fig. 1.4). The vital decision a physician faces is whether and how to treat this disease. Unfortunately there are only a limited number of possibilities for clinical assess- ment for aiding this decision. However, the application of phonocardiography is still not exploited in this field.
Figure 1.4: The difference between normal circulation and abnormal circulation due to patent ductus arteriosus. This essential fetal vascular structure has to close after birth otherwise allowing harmful systematic-to-pulmonary communication. Reprinted from [75].
In general the prevalence of PDA is around 2 per 1000 births, but in the case of preterms there is an increased risk for PDA which is due to physiological factors related to prematurity [76]. Some studies show that 65 % of preterm neonates with birth weight ≤ 1000 g will have PDA and a gestation of≤30 weeks is also a recognized risk factor [77,78].
PDA is about twice as common in girls than in boys.
The main diagnosis is done with echocardiography, which needs expertise, and so- phisticated and expensive equipment. Furthermore, the assessment of hemodynamical significance is still not obvious [77, 79], which means that the type and the timing of the treatment is also ambiguous [78, 80, 81]. These aspects underline the need for simple tools helping the diagnosis and the monitoring of the PDA in preterms.
Recent advances in neonatal monitoring provide new tools and equipment for the surveillance of preterm newborns [82, 83], however, these studies usually deal with body temperature, electro-cardiogram, respiration and the degree of blood oxygen saturation monitoring. Although PDA may influence these values, its effect is rather indirect. Skin reflectance has also been suggested as a more direct examination for diagnosing hemody- namical significance [84], and pulse wave analysis possesses also diagnostic value not yet exploited [85, 86]. Phonocardiography comes into view based on the observation that one of the fundamental symptoms is murmur. It could help in the quantitative assessment of murmur parameters since the murmur is often difficult to hear in the noisy environment of the neonatal intensive care unit. Although earlier studies investigated the murmurs
related to PDA in preterm infants [87], none of them tried to find a relationship between various parameters of the heart sound and of the patent ductus arteriosus in the case of preterm neonates.
Some recent works investigated also the application of biomarkers for diagnosing hemo- dynamically significant PDA [88]. Although echocardiography probably will remain the gold standard for the assessment of PDA, an appropriate combination of ultrasound, biomarkers, and clinical signs might improve the outcome [89], since the underlying main problem is that there is still a lack of understanding of neonatal circulation, and there is a “need to move the research beyond simply showing change in a physiological variable in response to a treatment” [90].
The main idea behind investigating murmurs is to access the blood flow dynamics through analysis of the generated sound, which is also referred as phonoangiography [91].
However, it is a very difficult problem to relate acoustic parameters with parameters of a turbulent fluid flow, not to mention the noise which affects the measurements.
Another feature is the investigation of the heart sounds. Normally, these are made up of the closure sounds of the valves on the left and right side of the heart. In the case of the second heart sound these are the aortic and the pulmonary valves. The pressure ratios between the arteries and the ventricles determine the exact closure time of these valves.
Because the patent ductus arteriosus connects the two main arteries, its will have an influ- ence on the pressure ratios between the arteries and the ventricles, thus also on the second heart sound. During the closure of the PDA the pressure rates will apparently change, which could be reflected in the time interval between aortic and pulmonary components of the second heart sound.
1.2 Methods
All fetal phonocardiographic (fPCG) data was recorded with a phonocardiographic car- diotocographic (CTG) device (Fetaphon-2000TM, Pentavox Ltd.) domiciliary or in clinical environment, in the case of the latter one mostly at the Hungarian Institute of Cardiology, Budapest. The length of these recordings was usually 20 minutes corresponding to the length of conventional CTG examinations. The fPCG device uses a sampling frequency of 333 Hz and a resolution of 8 bits. The recorded data was transferred via a mobile network and stored on an evaluation centre.
Phonocardiographic data of preterm infants was recorded using a self-made electronic stethoscope at the 1st Department of Paediatrics, Semmelweis University of Medicine, Budapest. After preprocessing, the data was archived for further analysis with a sampling frequency of 3000 Hz and a resolution of 16 bits. The length of the measurements was usually 30 seconds long. Informed consent was obtained in all cases.
1.2 Methods 11
The difficulty in phonocardiographic signal processing arises from the nonstationarity of the signals, often resulting in very short transients, and a low signal-to-noise ratio.
Some of the noise can be filtered out using traditional linear filters, but noise components often overlap with heart sound components not only in the time, but also in the frequency domain. I applied a wide variety of tools for biomedical signal processing, not all of them producing acceptable outcomes. In this work I present the results of the following approaches:
• Time domain methods: linear filtering, improved ensemble averaging [92], heuris- tic methods
• Time-frequency domain methods: short time Fourier transform [93], wavelet transform [94], Wigner-Ville distribution [95]
• Signal modelling and model fitting: linear and nonlinear chirp models [28, 96], time-frequency domain based parameter estimations [97], Monte Carlo method [98]
A more detailed description of the aforementioned methods can be found in Chapter 3.
There are several important phonocardiographic features which have to be assessed.
In the case of fetal CTG measurements the fetal heart rate (FHR) is one of the most important ones, which can be calculated based on the cyclostationary period of the fPCG signal. Moreover, recent studies suggest that based on the variability of the beat-to-beat times the development of the fetal nervous system can be assessed [99] and further details of the fetal wellbeing (e.g. detection of IUGR) can be monitored [100], emphasizing the importance of exact FHR determination.
Splitting, that is the temporal separation of different heart sound components, is often one symptom of cardiac anomalies [101]. Quantitative analysis is very difficult because of the overlapping components. Approaches based on models of the heart sounds show a possibility of estimating not only the splitting but also other parameters of the heart sounds.
The detection of murmurs is crucial for early diagnosis of cardiac diseases, but it is also a difficult task due to the presence of noise, especially in the case of the PCG signals of fetuses and preterm infants. Nevertheless the detection is only the first step in clini- cal applications because based on extracted parameters of the underlying cardiovascular phenomena can be monitored or classification of the heart diseases is possible in some cases.
In this dissertation I present novel results for investigating these aspects based on the methodology mentioned above.
For processing and analysis of the data and visualisation of the results I implemented all algorithms in different versions of Matlab (The MathWorks Inc., Natick, MA, USA).
1.3 Framework of the dissertation
Except the chapters describing the biological and methodological background, this work is divided into two major parts. The first one explains the application of phonocardiography in the case of fetuses, the second one deals with PCG results in the case of preterm infants.
These two parts can be read separately; in the one or two cases it is needed, reference to corresponding sections is given.
The chapters are organized as follows: Chapter 2 gives a detailed description of the anatomy and physiology of the human cardiovascular system, of possible cardiac abnor- malities and diseases and of the generation of heart sounds and murmurs.
In Chapter 3 the theory and methods are introduced for the analysis of nonstationary signals, such as phonocardiographic signals.
Chapter 4 deals with phonocardiography of fetuses, starting with the determination of the heart rate, followed by the investigation of heart sound models, and ending with the detection of fetal heart murmur.
In Chapter 5 the heart sounds of preterm infants having a certain congenital heart disease, called patent ductus arteriosus, are analysed. The focus is on investigating heart murmur and heart sound splitting related to PDA.
Finally, in Chapter 6 conclusions are drawn and possible further work is addressed. A summary of the achieved results in form of theses is also given in this chapter, concluded with the delineation of possible applications.
1.3.1 General notes
Because most of the work was carried in out in collaboration, in the rest of the dis- sertation – except in the summary in Chapter 6 – I will use “we” instead of “I”. My contributions are enumerated in Chapter 6 in a rigorous manner. The results of the work of the other members of the research group can be found in [102–109].
Chapter 2
Origin of Heart Sounds &
Murmurs
In order to fully understand the genesis and significance of heart sounds some biological knowledge is required. The following sections try to give a short introduction on the anatomy and development of the human heart and on cardiovascular dynamics including the genesis of heart sounds. Furthermore, possible malformations and abnormalities will be discussed, with special attention on the resulting acoustic manifestations.
2.1 The anatomy of the human heart
The heart is one of the most important organs in the human body; it is the pump of life, providing nutrients and oxygen for the tissues and organs through continuous blood flow while removing carbon dioxide and other by-products. Cardiac arrest without emergency treatment will result in death after a couple of minutes. This is why early diagnosis of cardiovascular diseases is so important.
The human heart is essentially a muscle, in adults somewhat larger than a fist. It consists of four main parts, the so called chambers: two upper atria and two lower ventri- cles. The septum divides it into a larger and stronger left and a smaller and weaker right side. This partition is essential for the effective circulation of the blood. The pulmonary vein, returning oxygenated blood from the lungs, empties into the left atrium. The atria act as a collecting reservoir, making faster filling of the ventricles possible. The ventri- cles act as pumps pushing out the blood into the great arteries. In the case of the left ventricle, the receiving great artery is called the aorta, which forwards the oxygen-rich blood to the body. The pulmonary artery, emanating from the right ventricle, transports de-oxygenated blood to the lungs again. A schematic drawing of the human heart is shown in Fig. 2.1.
13
Figure 2.1: The schematic representation of the human heart. The white arrows show the flow direction of the blood. Figure reprinted from [110].
2.1.1 Heart valves
Heart valves are passive elements consisting of connective tissue, responsible for the uni- directional blood flow. The atrioventricular valves, that is the mitral and tricuspid valves separate the atria and ventricles, whereas the semilunar valves, called the aortic and pul- monary valves are located at the outflow of the ventricles. There is a single fibrous ring around each of the heart valves, and these rings are connected forming a fibrous skele- ton. This framework has several physiological functions: it is the base to which the heart valves and great arteries attach, and it protects the valves from overstretching as the blood passes through them; furthermore, it behaves as an isolating layer between the atria and ventricles preventing them from simultaneous contraction (the heart has its own electric circuit, responsible for the appropriate timing of the electric signals) [111].
All four valves consist of so called leaflets or cusps (Fig. 2.2). Except the mitral valve, all other valves have three cusps. The main difference between the atrioventricular and semilunar valves is that the atrioventricular valves are connected to the ventricular wall via the chordae tendineae. These tendons prevent the valves from turning over into the atria when the ventricles contract to push the blood out into the great arteries. There is less danger of prolapse in the case of the semilunar valves since they have to resist much smaller pressure gradients.
2.1 The anatomy of the human heart 15
Figure 2.2: The cross-section of the heart showing the four heart valves (left) and an atrioventricular valve with the attached chordae tendineae connecting the valve leaflets to the papillary muscles and the ventricle wall (right). Taken from [112].
2.1.2 The fetal and neonatal circulation
The development of the fetal heart begins during the third week of gestation. In the beginning, the cardiac precursor cells form a single tube. The beating of the fetal heart, which happens based on the intrinsic spontaneous contraction of the myocardium, i.e. the heart muscle, starts around day 21 of gestation, however, blood circulation starts only a week later [113]. During the 4th week of gestation constriction of the tube define the separate components of the hearts, which will develop later on as the atria and ventricles.
The looping of the heart tube initiates the final development of the normal heart structure.
The 4-chamber heart evolves by the end of week 7. This is also about the first time when a heartbeat can be detected and viability can be assessed. The development of the heart is extremely sensitive during weeks 4-7 of gestation. This is why certain maternal infections, medication or metabolic diseases in this period can contribute to the development of congenital heart diseases.
In contrast to the human adult circulation, where oxygenated and de-oxygenated blood is well separated, in the case of the developed fetal circulation this is not the situa- tion (Fig. 2.3). This is necessary because the fetal lungs are in a collapsed state and the reoxygenation of the blood occurs in the placenta. The umbilical arteries, emanating from the descending aorta just after the bifurcation, transport deoxygenated blood to the placenta. Most of the returning oxygen-rich blood is emptied into the inferior vena cava through the ductus venosus from the umbilical vein. As the inferior vena cava enters the right atrium, the blood is guided toward the oval foramen – an opening between the two atria, vital before birth – by the valve of the inferior vena cava, and most of the blood passes directly into the left atrium. This is needed because this way it is possible to supply the fetal brain with as much oxygenated blood as possible, since from the left atrium the blood travels directly to the head and arms via the left ventricle and arteries arising at
the top of the aortic arch [114].
The fetal pulmonary circulation has a high resistance to flow, therefore the blood pumped out of the right ventricle travels through an additional vessel, the ductus arterio- sus, which closes after birth, into the aorta. It is noteworthy that the ductus arteriosus connects to the aorta just after the aortic arch. This is important since – as already men- tioned – arteries arising from the top of the arch transport blood to the brain. The blood coming through the ductus arteriosus is less oxygenated than the blood coming from the left ventricle. In such a way the fetal brain receives as much oxygen as possible (note the color coding for blood oxygen level in the schematic Fig. 2.3), which is clearly an evolutionary advantage.
Figure 2.3: Fetal circulation. Arrows show the direction of blood flow. Note the locations where oxygenated blood mixes with deoxygenated blood: the liver (I), the inferior vena cava (II), the right atrium (III), the left atrium (IV), and at the entrance of the ductus arteriosus into the descending aorta (V). Taken from [114].
After birth, the transition to adult circulation is usually surprisingly rapid. The first intake of breath forces the lungs to expand, resulting in normal pulmonary circulation.
Due to the changed blood pressure ratios and some other physiological factors the oval foramen and the ductus arteriosus functionally closes during the first day of life.
2.2 The dynamics of the heart 17
2.2 The dynamics of the heart
In order to maintain continuous blood flow in the circulatory system, the heart contracts periodically, on average 72 times per minute in the case of adults. However, the heart muscles of the human heart do not contract simultaneously, the contractions occur in two main phases, which are called systole and diastole. At the beginning of the heart cycle, as the ventricles contract, the pressure inside these lower heart chambers increase exceeding the atrial pressure which produces the closing of the atrioventricular valves, marking the beginning of the systole. Slightly later the semilunar valves open, allowing the ventricular blood to enter the great arteries. As the ventricles relax at the end of the systole, the pressure gradient between the great arteries and the ventricles becomes negative, which would cause the arterial blood to flow back into the ventricles. This is prevented by the closing of the aortic and pulmonary valves, which is the beginning of the diastole. As the pressure inside the ventricles decreases further, the atrioventricular valves fall open, which makes the refilling of the ventricles possible (see Fig. 2.4). At the end of the diastole the atria contract pushing even more blood into the ventricles before the cycle starts all over again [115].
Figure 2.4: The pressure-volume curve of the left ventricle. Point A marks the beginning of the systole (the closing of the mitral valve), point B corresponds to the opening of the aortic valve. Point C denotes the end of the systole and beginning of the diastole (closure of the aortic valve) and point D indicates the opening of the mitral atrioventricular valve.
Figure reprinted from [116].
2.3 Heart sounds & murmurs – terminology and definitions
Mechanical actions of the heart produce audible noises. These noises are called heart sounds, and are produced by vibration of the valves, heart muscle tissues and great ves- sels [117]. The cardiovascular sounds are weak compared to other physiological sounds, such as speech, stomach rumbling and breathing noise. They produce frequencies in the range of 1-1000 Hz, however the main components lie in the lower part of this bandwidth, which is also around the lower limit of the human hearing (Fig. 1.1).
2.3.1 Heart sounds
There are two major heart sounds, which are always present, and two less dominant heart sounds, which can be observed only in a restricted group of people. As shown in Fig. 2.5, the first heart sound (S1) is produced at the beginning of the systole, and is caused by the closing of the atrioventricular valves and vibration of the ventricle walls. The second heart sound (S2) coincides with the end of the systole and beginning of the diastole, and it is generated by the closing of the aortic and pulmonary valves and by the fast deceleration of the arterial blood. The third (S3) and forth (S4) heart sounds occur during the diastole.
The S3 sound is believed to be initiated by the sudden deceleration of atrioventricular blood flow when the ventricle reaches its limit of distensibility, causing vibrations of the ventricular wall. Finally, the S4 sound is produced by the end-diastolic atrial contractions, resulting in vibrations of the ventricle wall like in the case of the S3 sound [13].
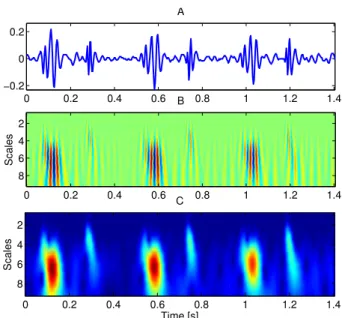
The S3 and S4 are rarely observed in the neonatal period. In the case of fetal and preterm heart sound recordings only the S1 and S2 sounds can be detected, due to the low signal-to-noise ratio. Segments of typical fetal and neonatal recordings are shown in Fig. 2.6.
The origin of heart sounds
In general there are two main theories regarding the generation of heart sounds, but it is still a topic of scientific debate [118]. The first one argues that the closing of heart valves generates vibrations similarly to the closing of a door, which can be perceived at the thorax. This is called the valvular theory, meaning that the vibrations of the valves are dominant, and it is supported by the echocardiographic findings demonstrating the coincidence between the timing of the valve vibrations and the heart sounds [119]. On the other hand, the cardiohemic theory states that no cardiac structure can vibrate on its own, because the blood is an incompressible fluid coupling the different cardiovascular structures. According to this theory not only the vibration of the valves is important, but the thoracic heart sound is a result of vibrations of the entire cardiohemic system: the heart cavities, the valves and the blood [118].
2.3 Heart sounds & murmurs – terminology and definitions 19
Figure 2.5: The Wiggers diagram: a comprehensive representation of the dynamics of a single heart cycle. Note the temporal synchronisation between the different signals. Taken from [35].
0 0.2 0.4 0.6 0.8 1 1.2
−0.4
−0.2 0 0.2 0.4
A
0 0.2 0.4 0.6 0.8 1
−1
−0.5 0 0.5 1
B
Time [s]
S2 S2
S2
S1 S1
S1 S2
S1 S1 S1
S2 S2
Figure 2.6: Three heart cycles of typical (A) fetal and (B) preterm neonatal heart sound recordings. See Sections 4.1 and 5.2.1 for for further details regarding the equipment and methods employed in acquisition.
Splitting of heart sounds
A feature which has clinical significance is the splitting of heart sounds. As described earlier, the S1 and S2 sounds are the result of valve closure and vibration occurring at both sides of the heart, which yield two components for both heart sounds. There is usually just a very short delay between the timing of these components producing in general a single heart sound. Nevertheless, if – due to some reason – the closing of the valves happens significantly earlier or later on one side, then this single heart sound will change into two sounds – a split heart sound.
The genesis of the S1 is surrounded by some controversy [120,121], however, the closing of the atrioventricular valves is beyond all doubt involved in the generation of the first heart sound. The mitral valve closes usually slightly earlier than the tricuspid valve on the right side, but in general they cannot be separated. Splitting of the S1 sound has also important clinical implications, such as left or right bundle brunch block. An example of fetal S1 split is shown in Fig. 2.7.
It is well supported that the S2 sound is composed of a component produced by the closure and vibration of the aortic valve and surrounding tissues (A2), followed by a sound resulting from the closure and vibration of the pulmonary valve and surrounding tissues (P2). TheA2 component usually precedes theP2 component; their temporal sepa- ration is denominated as the S2 split. In adults, the separation increases during inspiration up to 80 ms, known as physiological split, due to an increased amount of blood returning to the right ventricle and a decreased amount of blood returning to the left ventricle, which results in a delayed P2 component and an earlierA2 component, respectively. Dur- ing expiration the splitting decreases again, resulting in the sensation of a single sound.
Reversed splitting, that is splitting only during expiration might indicate aortic stenosis or left bundle branch block. On the other hand, splitting during inspiration and expira- tion is often a symptom of pulmonary stenosis, atrial septal defect or ventricular septal defect (cardiovascular diseases are described in more detail in section 2.4).
2.3.2 Heart murmur
Murmur arises from the acoustic radiation of turbulent blood flow caused, for instance, by a constriction in the artery or an insufficiently functioning heart valve (Fig. 2.8). Sec- tion 5.1.1 describes the generation of heart murmur in more detail. Since turbulence is a chaotic dynamic state, the resulting heart murmur differs greatly from the heart sounds which have “only” an oscillating background. Although simulation of flows in cylindrical tubes with certain constrictions give new insight into the dynamics behind heart murmur (see Fig. 2.9), there is still a great lack of understanding, which hinders the exploitation of the diagnostic value of heart murmur.
2.3 Heart sounds & murmurs – terminology and definitions 21
0 0.5 1 1.5
−0.2
−0.1 0 0.1 0.2
Time [s]
M T S2
M T S2
M T
S2 S2
M T
Figure 2.7: Fetal heart sound record with 60 ms S1 split, separating the mitral (M) and tricuspid (T) component of the first heart sound.
0 0.2 0.4 0.6 0.8 1
−1
−0.5 0 0.5 1
Time [s]
S1 murmur
S2
S1 murmur
S2
S1 murmur
S2
Figure 2.8: Fetal heart sound record with a significant systolic murmur due to turbulent blood flow through collateral arteries.
Figure 2.9: Sequence of normalized averaged vorticity magnitude contours for pulsatile flow through the 75 % eccentric stenosis. Taken from [122].
Although the presence of murmur is always related to some deviation resulting in turbu- lent blood flow, if the real cause is hemodynamically insignificant, it is regarded asinnocent murmur. In contrast, murmur related to some cardiovascular disease is called pathological murmur [117].
Usually five properties of heart murmur are assessed during auscultation in clinical practice [123]:
• Timing and duration: murmurs should be identified as being systolic or dias- tolic (or rarely, continuous). The duration can then be subdivided into further subcategories, such as early, mid, late systolic or even holosystolic.
• Intensity: the intensity of a murmur is graded on a scale of 1-6, where grade 1 is a quiet murmur that can be heard only after careful auscultation over a localised area and grade 6 is a murmur sufficiently loud to be heard with the stethoscope raised just off the chest surface.
• Point of maximal intensity and radiation: point of maximum refers to where the murmur can be heard best. Several locations on the chest are defined which correspond to specific parts of the heart. Regarding the radiation, a general rule of thumb is that the sound radiates in the direction of the blood flow.
• Shape: the shape describes the intensity change of the murmur during the cardiac cycle and it is related to the corresponding flow velocities. It is described by musical notions, for example crescendo or decrescendo, but the intensity can also remain fairly constant.
• Character: it is described by the pitch of the murmur and based on the spectral configuration. For example, in the case of a musical murmur typically a dominant tone is present, but usually many frequencies build up the murmur, making it blow- ing, harsh, or rumbling.
2.4 Heart diseases
The anatomy and functioning of normal fetal, neonatal and adult circulation have been described in the previous sections, but a great part of this work deals with heart sounds re- lated to different pathological cases. This necessitates an introductory section on different cardiovascular diseases.
2.4 Heart diseases 23
2.4.1 Heart valve diseases
Heart valves have the two major functionalities of blocking the back flow and enabling the forward flow of the blood in the different phases of the heart cycle. Consequently it is not surprising that there are two major abnormalities which affect heart valves:
stenosis, which is abnormal narrowing, hindering normal forward flow, and insufficiency, which corresponds to the insufficient closing of the heart valve enabling back flow [124].
Although abnormalities of all for heart valves are possible, the valves on the left side of the heart are more frequently affected by valvular diseases, since the left side has to support the continuous blood flow in the greater systematic circulation.
Stenosis
Heart valve stenosis is an abnormal narrowing of the valvular orifice due the thickening or calcification. Formerly it was often caused by rheumatic fever, but it has become a rare disease nowadays in the western world, except in early life. The stenosis of the aortic valve increases the workload of the left ventricle since the muscles have to push with a greater force to maintain cardiac output. This will result in the thickening of the left ventricle wall, called hypertrophy. In serious cases, with no surgical replacement of the valve it may lead sudden cardiac arrest. Since the blood flow velocities are high during the systole when the blood flows through the aortic valve, the flow becomes turbulent, and a strong systolic crescendo-decrescendo murmur develops, which is a usual symptom of aortic stenosis.
Mitral stenosis hinders the normal filling of the left ventricle during the diastole. It is caused by scarring of rheumatic fever, causing the valve flaps getting stuck together by adhesions. This causes the blood being backed up in the lungs, resulting in congestive heart failure, which is a condition in which the heart cannot supply the body’s need. The only treatment of mitral stenosis is surgical opening of the valve. Similar to aortic stenosis, murmur may arise as a physical symptom, but in this case at the end of the diastole when the atrium contracts. Another sign is an unusually loud S1 sound because of increased force in closing the mitral valve.
Pulmonary and tricuspid stenosis is a rare, congenital phenomenon that often requires surgery.
Heart valve insufficiency
During aortic insufficiency, or regurgitation, when the aortic valve leaks blood back into the left ventricle, the chamber has to work harder than normal. It has to pump the blood that leaked back out again together with the usual volume of blood it would have