FRAMEWORK
PhD Dissertation
M´ at´e J´ ozsef B´ ar´ any Supervisor: Botond Bert´ ok
University of Pannonia
Faculty of Information Technology
Doctoral School of Information Science and Technology 2015
DOI: 10.18136/PE.2015.595
FRAMEWORK
Ertekez´es doktori (PhD) fokozat elnyer´ese ´erdek´eben´
´Irta: M´at´e J´ozsef B´ar´any
K´esz¨ult a University of Pannonia Doktori Iskol´aja keret´eben T´emavezet˝o: Botond Bert´ok
Elfogad´asra javaslom (igen / nem)
(al´a´ır´as) A jel¨olt a doktori szigorlaton ...%-ot ´ert el
Veszpr´em ...
a Szigorlati Bizotts´ag eln¨oke Az ´ertekez´est b´ır´al´ok´ent elfogad´asra javaslom:
B´ır´al´o neve: ... (igen / nem)
(al´a´ır´as) B´ır´al´o neve: ... (igen / nem)
(al´a´ır´as) A jel¨olt az ´ertekez´es nyilv´anos vit´aj´an ...%-ot ´ert el
Veszpr´em ...
a B´ır´al´o Bizotts´ag eln¨oke A doktori (PhD) oklev´el min˝os´ıt´ese ...
...
Az EDT eln¨oke ii
Table of Contents iii
List of Tables vii
List of Figures viii
Kivonat x
Abstract xi
Abstrakt xii
Acknowledgement xiii
1 Introduction 1
1.1 Aim . . . 3
1.2 Emphasizing my own results . . . 4
1.3 Notations . . . 4
2 Problem definitions 6 2.1 Process-network synthesis . . . 6
2.1.1 General introduction to process-network synthesis . . . 6
2.1.2 Complexity of process-network synthesis . . . 7
2.1.3 Popular methods for process-network synthesis . . . 8
2.2 Vehicle scheduling . . . 9
2.2.1 General introduction to vehicle scheduling . . . 9
2.2.2 Variants, modifications, extensions . . . 10
2.2.3 Complexity of vehicle scheduling . . . 11
2.2.4 Popular models for vehicle scheduling . . . 11
2.3 Vehicle routing . . . 13
2.3.1 General introduction to vehicle routing . . . 13
2.3.2 Variants, modifications, extensions . . . 14
2.3.3 Complexity of vehicle routing . . . 15
iii
2.4.1 General introduction to reaction-pathway identification . . . . 16
2.4.2 Existing methods . . . 18
3 The P-graph framework 20 3.1 Motivation . . . 20
3.2 Combinatorial foundations . . . 21
3.3 The P-graph representation . . . 22
3.3.1 Formal definition . . . 23
3.3.2 Illustrative example . . . 23
3.4 Structural mappings . . . 24
3.5 Axioms of combinatorially feasible process structures . . . 27
3.5.1 Formal definition . . . 27
3.5.2 Utilization . . . 28
3.5.3 Maximal structure . . . 29
3.6 Combinatorial algorithms . . . 30
3.6.1 Algorithm MSG . . . 30
3.6.2 Algorithm SSG . . . 31
3.7 Parametric model of process-network synthesis . . . 31
3.7.1 Mass balance constraints . . . 32
3.7.2 Objective function . . . 32
3.7.3 Further notations . . . 33
3.7.4 The complete parametric model . . . 34
3.8 The MILP model of process-network synthesis . . . 34
3.8.1 Binary variables . . . 34
3.8.2 The complete MILP model . . . 35
3.8.3 Solving the MILP model . . . 35
3.9 Relationship between the MILP model and the combinatorial axioms 36 3.10 Extensions and adaptations . . . 37
3.11 Related publication . . . 38
4 Modeling vehicle scheduling problems as process-network synthesis problems 39 4.1 Problem definition . . . 40
4.1.1 Notations . . . 40
4.1.2 Formal definition . . . 41
4.2 Modeling vehicle scheduling as a synthesis problem . . . 42
4.2.1 Analogy between the concepts of vehicle scheduling and process- network synthesis . . . 42
4.2.2 The P-graph model of vehicle scheduling . . . 42
4.2.3 Illustrative example . . . 45
iv
4.5 Relationship with other models . . . 56
4.5.1 Commodity flow models . . . 56
4.5.2 Set partitioning models . . . 56
4.5.3 The P-graph model . . . 57
4.6 Application . . . 57
4.7 Summary . . . 59
4.8 Related publications . . . 59
5 Modeling vehicle routing problems as process-network synthesis prob- lems 60 5.1 Problem definition . . . 61
5.1.1 Basic concepts . . . 62
5.1.2 Formal definition . . . 64
5.2 Modeling capacitated vehicle routing as a synthesis problem . . . 66
5.2.1 Analogy between the concepts of capacitated vehicle routing and process-network synthesis . . . 66
5.2.2 The P-graph model of capacitated vehicle routing . . . 67
5.3 Algorithmic model generation . . . 76
5.3.1 Model generation . . . 76
5.3.2 Model simplification . . . 79
5.4 The validity of the model . . . 83
5.5 Relationship with other models . . . 86
5.5.1 Vehicle flow models . . . 86
5.5.2 Commodity flow models . . . 87
5.5.3 The P-graph model . . . 87
5.6 Summary . . . 88
5.7 Related publications . . . 88
6 New results in reaction-pathway identification 89 6.1 Direct mechanisms . . . 89
6.1.1 Theoretical background . . . 90
6.1.2 Illustrative example . . . 94
6.2 Structurally minimal pathways . . . 96
6.2.1 Theoretical background . . . 96
6.2.2 Illustrative example . . . 101
6.3 Extreme pathways . . . 103
6.3.1 Theoretical background . . . 104
6.3.2 Illustrative example . . . 108 6.4 Equivalence of direct mechanisms and structurally minimal pathways 109 6.5 Equivalence of extreme pathways and structurally minimal pathways 113
v
7 Summary 117
8 New scientific results 119
9 Publications 121
Bibliography 123
vi
1.1 Success stories of Operations Research . . . 2
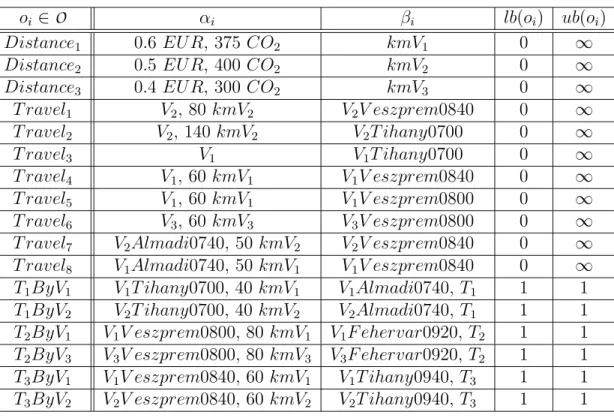
4.1 Mapping the concepts of VSP to PNS . . . 43
4.2 Trips to be completed . . . 45
4.3 The fleet of vehicles . . . 45
4.4 Products of the synthesis problem . . . 46
4.5 Raw materials of the synthesis problem . . . 47
4.6 Operating units of the synthesis problem . . . 48
4.7 Trips to be completed . . . 57
4.8 The fleet of vehicles . . . 58
4.9 Alternate solutions . . . 58
5.1 Mapping the concepts of CVRP to PNS . . . 66
5.2 Test instances . . . 81
5.3 Decrease in the number of operating units . . . 81
5.4 Improvement in performance - PNS Solver . . . 82
5.5 Improvement in performance - CBC . . . 82
5.6 Improvement in performance - CPLEX . . . 82
6.1 List of candidate elementary reactions . . . 94
6.2 List of the identifiers of the species . . . 94
6.3 Table of stoichiometric coefficients γij’s defining the steps . . . 95
6.4 List of direct mechanisms for the ammonia synthesis . . . 96
vii
3.1 P-graph symbols . . . 24
3.2 A sample P-graph . . . 25
3.3 Reduction of the search space . . . 29
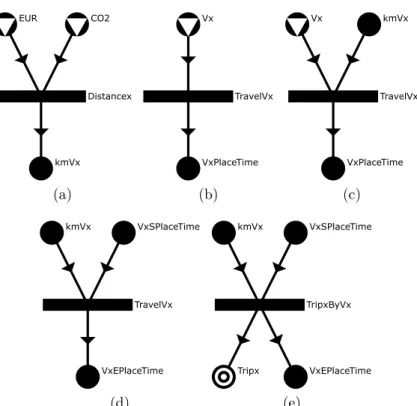
4.1 Operating units used in vehicle scheduling . . . 44
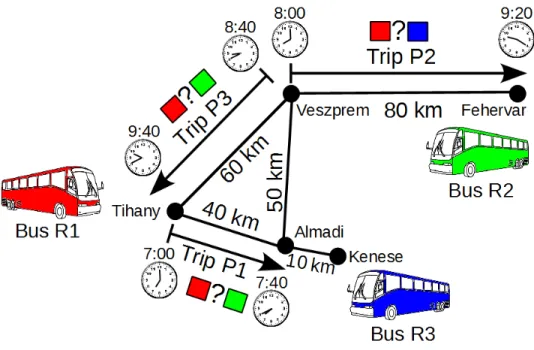
4.2 The illustrative example . . . 46
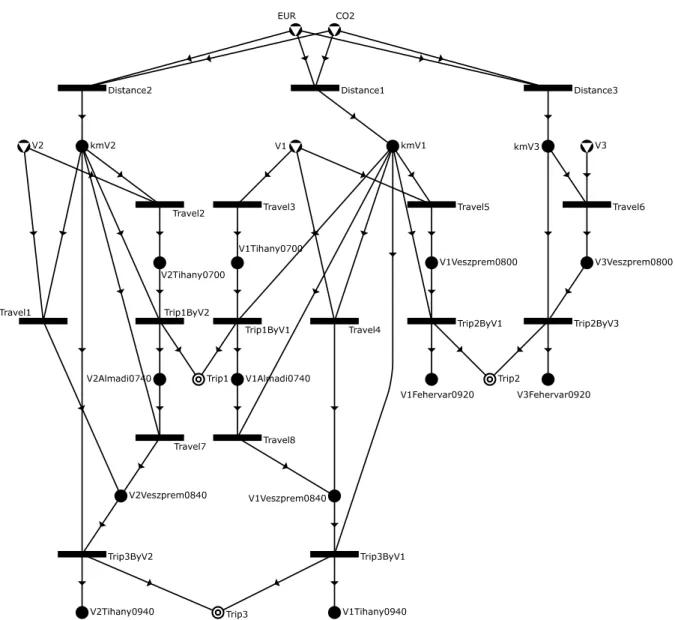
4.3 The maximal structure of the illustrative example . . . 49
4.4 Algorithm to generate the P-graph model of a VSP . . . 52
4.5 The SetDistanceProperties subroutine . . . 53
4.6 The SetTravelProperties subroutine . . . 53
5.1 Different type of vehicle routing problems . . . 61
5.2 Movements of vehicles and goods . . . 68
5.3 V1 transportsG1 from A to B and then transports it further to C . . 69
5.4 Transportation of two goods by a single vehicle . . . 70
5.5 Transportation of a single good by two vehicles . . . 71
5.6 G1 is loaded onto V1 and V2 . . . 71
5.7 V1 and V2 unloads G1 . . . 72
5.8 An unloading operation . . . 73
5.9 An unloading operation with mutual exclusion . . . 74
5.10 Modeling time constraints . . . 75
5.11 Algorithm to generate the P-graph model of a VRP . . . 77
5.12 A small example with a depot and three customers . . . 79
5.13 The only way to Lov´aszpatona goes through Vanyola . . . 80
viii
ix
A P-gr´ af m´ odszertan ipari alkalmaz´ asai
D¨ont´eshoz´oi szinten a matematikai programoz´asi modellek alkalmaz´asa mindennapos a k¨ul¨onb¨oz˝o ipari alkalmaz´asokban. Sz´amos olyan algoritmus ´es megold´asi m´odszer
´all a d¨ont´eshoz´ok rendelkez´es´ere, amelyek seg´ıts´eg´evel egy adott probl´ema egzaktan, heurisztik´ak alkalmaz´asa n´elk¨ul megoldhat´o. Ennek ellen´ere m´eg az egzakt m´odszerek
´altal adott eredm´eny sem felt´etlen¨ul optim´alis, hiszen lehet, hogy a kiindul´asi modell hib´asan van megkonstru´alva.
A P-gr´af m´odszertant Friedler ´es szerz˝ot´arsai dolgozt´ak ki a 90-es ´evek elej´en komplex vegyipari termel˝orendszerek optimaliz´al´as´ara. Form´alisan bizony´ıtott, hogy a m´odszertan ´altal gener´alt matematikai programoz´asi modell garant´altan tartal- mazza a feladat optim´alis megold´as´at.
A dolgozatban bemutat´asra ker¨ul, hogy a P-gr´af m´odszertannal nemcsak komp- lex vegyipari termel˝orendszerek, hanem egy´eb ipari, pl. logisztikai alkalmaz´asok is modellezhet˝oek, mint a j´arm˝u-hozz´arendel´es, vagy a fuvarszervez´es. Dolgozatomban bizony´ıtom, hogy az ´ıgy gener´alt matematikai modellek garant´altan tartalmazz´ak a feladat optim´alis megold´as´at.
A P-gr´af m´odszertan seg´ıts´eg´evel egy´eb ipari alkalmaz´asok, mint pl. a reakci´o´ut- azonos´ıt´as is modellezhet˝o. A dolgozat megmutatja, hogy a reakci´o´ut-azonos´ıt´asban haszn´alt fogalmak, mint a direkt ´ut, az extr´em ´ut, vagy a struktur´alisan minim´alis ´ut ekvivalensek. A feladat alternat´ıv megfogalmaz´asai m´as-m´as megold´o m´odszerekhez vezettek. A jelen dolgozatban bemutatott bizony´ıt´as a feladatok ekvivalenci´aj´ar´ol ´uj utat nyit a megold´o m´odszerek szinergikus tov´abbfejleszt´es´ere is.
x
Industrial applications of the P-graph Framework
It is common practice by decision makers to use mathematical programming models in various industrial applications. Several algorithms and solution methods exist which render it possible to solve a given problem without any heuristics. However, even a solution yielded by these exact methods may not be optimal since the initial mathematical model may be poorly constructed.
The P-graph framework was developed by Friedler and his associates in the early nineties for the optimization of complex chemical systems. It is formally proven that the algorithm generated by the framework contains the global optimum of the problem.
In this work it will be shown that besides the chemical systems the P-graph framework can be used to model other industrial applications like vehicle scheduling or vehicle routing. In this work I will prove that the generated mathematical models contain the global optimum of the problem.
With the aid of the P-graph framework it is possible to model the reaction-pathway identification problem as well. This work will show, that the concepts used in reaction- pathway identification, like direct pathway, extreme pathway and structurally mini- mal pathway are equivalent. The different concepts lead to different solution methods.
However, this new result lays the foundations for new solution methods which combine the different concepts.
xi
Den industriella applikationen av P-graf modellen
G¨allande beslutstagande i anv¨andningen av den industriella applikationen s˚a ¨ar mate- matiska programmeringsmodeller vanligt f¨orekommande. Det finns ett flertal algorit- mer och l¨osningsmetoder, med vilka problemet i sig exakt kan l¨osas, utan n˚agot behov av heuristiker. Trots detta ¨ar resultaten av de exakta metoderna inte n¨odv¨andigtvis optimala, f¨or det ¨ar m¨ojligt att utg˚angsmodellen ¨ar konstruerad p˚a ett fel s¨att.
F¨or att optimalisera komplexa kemiska applikationer, konstruerade Friedler och hans f¨orfattarkollegor P-graf metoden i b¨orjan av 90-talet. Det ¨ar formellt bevisat att den matematiska programmeringsmodell som genereras av denna metod, garanterat inneh˚aller uppgiftens optimala l¨osning.
I redovisningen kartl¨agger jag att P-graf modellen inte enbart beh¨over anv¨andas till att modellera komplexa kemiska system, utan ocks˚a till att modellera andra ap- plikationer inom logistik, liksom fordonsschemal¨aggning eller fordonsdirigering. I re- dovisningen visar jag ¨aven att de matematiska modeller som ¨ar genererade p˚a detta s¨att kommer s¨akerligen att inneh˚alla uppgiftens optimala l¨osning.
Med hj¨alp av P-graf metoden blir det ocks˚a m¨ojligt att modellera reaktionsv¨agens problematik. Redovisningen p˚apekar att de begrepp som anv¨ands till att identifiera v¨agen, liksom “direkt v¨ag”, “extrem v¨ag” och “den strukturellt minimala v¨agen” ¨ar motsvarande. De olika id´eerna leder till olika l¨osningsmetoder. Detta nya resultat l¨agger grunden f¨or nya l¨osningsmetoder, som f¨orenar de olika id´eerna.
xii
This is the third time that I have been granted the opportunity to write an acknowl- edgement but I still find it a fascinating process. I would like to use this opportunity to express my gratitude to everyone who supported me throughout my PhD studies.
First of all, I would like to thank my supervisor, Botond Bert´ok for his supervision.
His previous research results laid the foundations for this work. Without his ideas and guidance this work would have been never accomplished. I would like to express my gratitude to Professor Ferenc Friedler for similar reasons.
I have to admit that I have experienced many ups and downs in the recent years and I was more than once ready to quit. However many of my friends supported me during these periods and they have always motivated me to go on. Here, I would like to thank J´ozsef Smidla for all the little things he has done during all these years.
My colleagues at Ericsson provided a very supportive environment which was crucial during the preparation of this thesis. They were also very patient with me for which I cannot be thankful enough. P´eter Ocsovai is the best team leader I have ever worked with but if I want to be honest I highly doubt that he will read this unless I show him explicitly.
Most importantly, none of this could have happened without my family. Words cannot express how grateful I am to my mother for all of the sacrifices that she made on my behalf.
xiii
Introduction
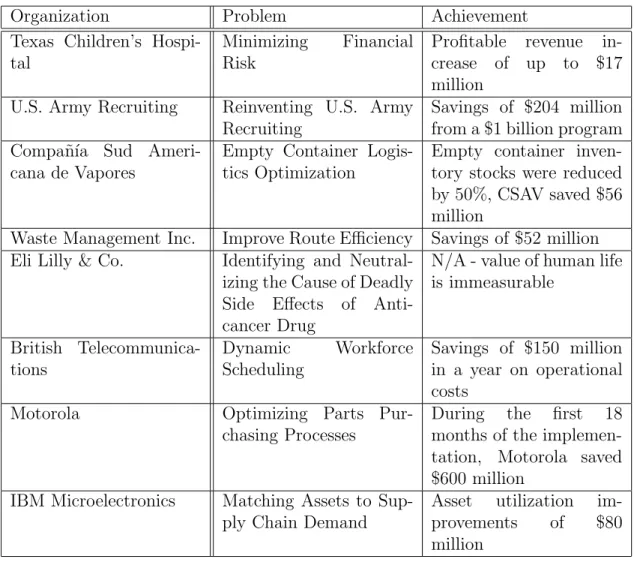
Mathematical programming models are often used in complex optimization problems to support decision making. The range of applications is very wide, it includes health- care, logistics, waste management, supply chain design and many more. The website of informs [1] has a nice collection of success stories and Table 1.1 highlights some of them. It is clear that often enormous savings were achieved through optimization.
However, these models are often constructed based on intuition and earlier expe- rience. If the initial model is not constructed properly, even a complete enumeration may miss the optimal solution since it may not be embedded in the model.
The P-graph framework was introduced more than two decades ago to solve com- plex optimization problems arising in chemical and allied industries. The framework is able to generate the mathematical model directly and systematically from the input parameters. Moreover, it is formally proven, that the generated model contains the global optimum of the problem.
The framework has been extended and adapted to solve various other practical problems. In many cases this has been carried out by simply transforming the prob- lems into a process-network synthesis problem and then they were solved by the effective algorithms of the framework.
In this work it will be shown that the P-graph framework can be used to model two common problems arising in the transportation industry, vehicle scheduling and vehicle routing.
1
Table 1.1: Success stories of Operations Research
Organization Problem Achievement
Texas Children’s Hospi- tal
Minimizing Financial Risk
Profitable revenue in- crease of up to $17 million
U.S. Army Recruiting Reinventing U.S. Army Recruiting
Savings of $204 million from a $1 billion program Compa˜n´ıa Sud Ameri-
cana de Vapores
Empty Container Logis- tics Optimization
Empty container inven- tory stocks were reduced by 50%, CSAV saved $56 million
Waste Management Inc. Improve Route Efficiency Savings of $52 million Eli Lilly & Co. Identifying and Neutral-
izing the Cause of Deadly Side Effects of Anti- cancer Drug
N/A - value of human life is immeasurable
British Telecommunica- tions
Dynamic Workforce Scheduling
Savings of $150 million in a year on operational costs
Motorola Optimizing Parts Pur-
chasing Processes
During the first 18 months of the implemen- tation, Motorola saved
$600 million IBM Microelectronics Matching Assets to Sup-
ply Chain Demand
Asset utilization im- provements of $80 million
The P-graph framework was used earlier to solve the reaction-pathway identifi- cation problem. This work expands these earlier results and it will show that the different concepts used in reaction-pathway identification, like direct path, extreme path and structurally minimal path are equivalent.
1.1 Aim
The main aim of this thesis is to utilize the P-graph framework to find the optimal solution of industrial applications. Vehicle scheduling and vehicle routing are two common problems often arising in the transportation industry. These problems are often solved by mathematical programming but the quality of the solution yielded by these models depends heavily on the quality of the model. If the initial model is not constructed properly then even an exact solution method may miss the optimum.
Since it is formally proven that mathematical programming model generated by the P-graph framework contains the global optimum of the problem it is subservient to use the framework to find the optimum of these logistic problems.
• The P-graph framework should be adapted to vehicle scheduling problems. The easiest way is perhaps the transformation of the vehicle scheduling problem into a process-network synthesis problem. Thus, a P-graph model should be designed which properly expresses the unique characteristics of the vehicle scheduling problem. Furthermore, an algorithm should be designed, which systematically generates this model from the vehicle scheduling problem. The optimal solution of the problem is embedded in this model and it could be solved by the effective algorithms of the P-graph framework or by any general mathematical solver.
• The P-graph framework should be adapted to vehicle routing problems, specifi- cally for the capacitated vehicle routing problem. Essentially, a P-graph model should be designed which properly expresses the unique characteristics of the ve- hicle scheduling problem. Furthermore, an algorithm should be designed which systematically generates this model from the vehicle scheduling problem. The optimal solution of the problem is embedded in this model and it could be solved
by the effective algorithms of the P-graph framework or by any general math- ematical solver. The procedure involves the conversion of the vehicle routing problem into a process-network synthesis problem.
Another practical problem often arising in applications related to chemical sys- tems is the so-called reaction-pathway identification. The P-graph framework has been adapted earlier to solve this problem, which slightly differs from the typical optimization problems. Here, those earlier results will be extended.
The structurally minimal pathway is a central concept in the P-graph model of the reaction-pathway identification problem. There are several similar concepts in the literature and the aim here is to investigate the exact nature of these relationships.
• The exact relationship between the concept of the structurally minimal pathway and the concept of the direct path should be determined.
• The exact relationship between the concept of the structurally minimal pathway and the concept of the extreme pathway should be determined.
1.2 Emphasizing my own results
The major part of this thesis is written in passive voice. My own results are em- phasized unambigously at the end of each chapter in the respective summary. These results are collected and conceived again at the end of the thesis. Whenever I used a previous result of someone else I made a citation and indicated the source in the bibliography.
1.3 Notations
This thesis covers many different topics with many different notations. However, the following guideline is generally true unless explicitly stated otherwise.
• A calligraphic letter or a sequence of calligraphic letters always denotes a set.
For example P, R O, m, o, solutions, subproblems all denotes sets.
• An italic lowercase letter denotes an integer or a real variable. For example x, y, i, j, k all denote variables. However, an italic lowercase latter followed by brackets denotes a function, for example fR(m),ls(Ti), te(Ti), etc.
• An italic uppercase letter denotes an identifier which is used to denote materials or operating units. For example A, B, C, EUR, CO2.
• Italic greek letters denote structural mappings in the P-graph framework, like ϕ, ψ, ν, ω, ϕ+, ψ− but there are also exceptions, like α, β which denote sets.
In latter chapters greek letters may denote stoichiometric coefficients, like λ, γ.
The meaning can be always determined from the context unambigously.
• A boldface lowercase letter denotes a vector, for example x,y,λ. A boldface uppercase letter denotes a matrix for example A,D.
Problem definitions
This chapter introduces the four main topics of the thesis, all of them related to combinatorial optimization. All of these problems are of utmost practical importance and extremely challenging. Process-network synthesis and reaction-pathway identi- fication are ubiquitous in chemical and allied industries while vehicle routing and vehicle scheduling are everyday problems in distribution and logistics.
2.1 Process-network synthesis
Essentially, every product of the chemical and allied industries are manufactured by process networks. Thus, such problems are ubiquitous in chemical and allied industries and they have enormous practical importance.
2.1.1 General introduction to process-network synthesis
In a process network, raw materials are consumed through various chemical, physical and biological transformations to yield desired products. The equipment or func- tional units accomplishing these transformations are termed operating units. Hence, a process network can be viewed as a system of operating units, each operating unit transforming a specified number of input materials with known quality into a spec- ified number of output materials by altering their physical, chemical, or biological properties.
6
Given a process system, the aim of process-network synthesis in short is to deter- mine the optimal structure of the system and to identify the optimal types, config- urations and capacites of the functional units performing various operations within the system [99, 132]. The role of process synthesis is to enhance profitability through the reduction of material and energy consumption. It is well documented [120], that effective process synthesis can reduce the energy consumption by 50% and net-present cost by 35%.
A process-network or process synthesis problem is defined by the available raw materials, candidate operating units and desired products. Various other parameters for the operating units and materials are also given. These parameters include the coefficients for the functions expressing the costs of operating units depending on their load, and upper bounds on their respective capacities. The relations between the materials and operating units, i.e., the consumption rates of input and production rates of output materials by the operating units are also defined in the problem specification. The aim is to determine the optimal network where the objective can be either cost minimization or profit maximization.
2.1.2 Complexity of process-network synthesis
To determine the optimal network, the structure of the entire process and the config- urations of the operating units constituting the process should be synthesized simul- taneously because their performances influence each other. However, this is almost impossible to do so, since the problem is extremely complex and computationally very demanding. This follows from the dual nature of the problem, which is both contin- uous and discrete at the same time and the latter leads to profound combinatorial complexity.
The present work focuses solely on the so-called macroscopic phase which is often termed in itself as process-network synthesis. This phase involves the determination whether a candidate operating unit is present in the optimal structure of the process or not and consequently the existence or absence of connections between the candidate operating units.
Note, that the complexity of the problem magnifies exponentially due to its com- binatorial nature, since the optimal network has to be found among 2n−1 possible alternative networks where n denotes the number of candidate operating units. For instance, when n is 35, 2n −1 yields 34.36 ×10⁹ which is a huge number, and it essentially doubles, when n is increased to 36.
It is easy to see intuitively that process-network synthesis problems are really challenging. It has been also proven formally, that the process-network synthesis problem is equivalent to the set covering problem [69]. Since the set covering problem is one of Karp’s original 21 NP-complete problems [73], it is a direct corollary of the theorem that the process-network synthesis problem is NP-complete.
2.1.3 Popular methods for process-network synthesis
Process-network synthesis has been studied extensively in the last few decades. As a result, numerous papers have been published and a huge number of methods have been devised to solve synthesis problems.
Exact methods
The use of mathematical programming is very popular, see e.g. [3, 28, 53, 54, 55, 56, 57, 72, 74, 78, 80, 109, 119]. The inclusion and the exclusion of the candidate operating units in the resultant models are usually expressed by integer variables.
Note, that the value of the objective function is often affected more drastically by the integer than the continuous variables, i.e., the combinatorial part of the problem.
The generated models can be solved even by general purpose mathematical pro- gramming solvers. This is one of the greatest advantage of these approaches, since they can benefit from the rich tools of mathematical programming. As a result of algorithmic developments and inclusion of achievements of computer science and soft- ware engineering, the general purpose mathematical programming solvers available today are very capable even on a desktop PC [91].
Methods based on heuristic
However, practical process-network synthesis problems are often such complex that the resulting mathematical models cannot be solved in reasonable time. Thus, heuris- tic methods are also used frequently to determine near optimal networks in process synthesis, like
• genetic algorithms [4, 39, 84, 131]
• simulated annealing [27]
• tabu search [87]
• memetic algorithms [126]
• many other heuristic methods [5, 29, 96].
Other methods
Some of the methods combine the two above approaches, resulting in so called hybrid methods. Note, that this is only a small fraction of the papers published in the topic.
Since process-network synthesis is essentially an optimization problem, any method designed to solve optimization problems is able to solve process-network synthesis problems as well (e.g. dynamic programming [40]).
2.2 Vehicle scheduling
Vehicle scheduling often arises in industrial applications, perhaps most frequently in public transportation. The scheduling of vehicles has become an extensively studied topic in the last four decades. Numerous exact and heuristical methods and algo- rithms have been published along with some well-known survey papers, see e.g. [19].
2.2.1 General introduction to vehicle scheduling
Vehicle scheduling begins at the strategic level with collecting or forecasting data of customer demand. In the following step, based on the demand, the infrastructure of
the transportation network is defined. Then routes and stop points for different lines are established on the defined infrastructure. After that, particular trips are defined for given lines. The timetable specifies for each trip a departure and an arrival time as well as start and end stations. The further planning focuses on the efficient use of the resources.
Given a set of timetabled trips with fixed travel (departure and arrival) times and start and end locations as well as traveling times between all pairs of end stations, the objective is to find an assignment of trips to vehicles such that each trip is covered exactly once, each vehicle performs a feasible sequence of trips and the overall costs are minimized [19].
2.2.2 Variants, modifications, extensions
The problem has many variants and extensions. For example, the operational costs can be divided into fix (like investment) and operational (e.g. fuel) costs. In prac- tice, operational costs are often expressed in various different ways and thus many applications leave the minimization of operational cost as a secondary objective. Of course, the problem can be extended with several additional requirements like
• The existence of multiple depots. The existence of an additional depot extends the problem to NP-hard complexity [77, 110].
• A heterogeneous fleet. A fleet consisting of multiple vehicle types. In this case special vehicle types have to be used for service and it is known to be NP- hard even without multiple depots. If the trips are restricted such that they could be serviced only by a subset of the vehicle types then a further extension, called vehicle type groups is inserted [65].
• Time windows. In this case variable trip departure and arrival times are considered. Even the simplest time windowed vehicle scheduling problem is NP-complete, since in case of time windows a vehicle scheduling problem with one vehicle and one depot is a traveling salesman problem with time windows.
Both discrete and continous time windows are possible [26, 76].
• Route constraints. It is possible to force a special property on the routes of a feasible schedule. Typical route constraints are time restrictions on the vehicle routes. These are considered, for example, for fuel restrictions or maintenance intervals [59].
• etc.
2.2.3 Complexity of vehicle scheduling
If the vehicle scheduling problem has a single depot then it is relatively easy to solve in the sense that it could be formulated as a problem for which polynomial time algorithms exist. Models for solving the single depot case include the minimal de- composition model, the assignment model, the transportation model and the network flow model.
However, different variants, like the existence of multiple depots extend the prob- lem to NP-hard complexity [15, 86]. In this case different locations for starting routes are possible. In addition, it is a frequent constraint that a vehicle has to return to its start depot at the end of its route. The multiple depot case is often modeled with single and multi-commodity models and set partitioning models. Note, that these models are also applicable to vehicle routing problems.
2.2.4 Popular models for vehicle scheduling
This section introduces the most popular methods, each of them with a short descrip- tion. They are grouped based on the number of depots defined in the problem.
Single depot case
The VSP for a single depot is relatively “easy” to solve in the sense that it could be formulated as a problem for which polynomial time algorithms are known [19, 41, 101].
Perhaps the most popular models are the following:
• Minimal decomposition models. These models typically do not respect operational costs. Another drawback of these kind of models that no upper
bound can be set on the fleet size.
• Assignment models. These models handle operational costs and formulates the problem as an assignment problem. Can be represented by bipartite graphs.
• Transportation models. In the literature some transportation models are of- ten called quasi-assignment models and specialized assignment algorithms have been adapted to this problem. Can be represented by bipartite graphs.
• Network flow models. In case of network flow models the solution can be obtained by solving a specific minimum cost flow problem.
Multiple depot case
In this case, different depots for starting bus routes are possible. As an additional restriction each vehicle has to return to its start depot at the end of its route. The multiple depot case is proven to be NP-hard [35, 58].
• Single-commodity models. The problem is modeled by a graph where the nodes represent the trips, depots and vehicles. The objective is to find a mini- mum cost set of elementary circuits, such that each node is covered by exactly one circuit, each circuit has exactly one depot/vehicle node and the number of circuits with a node belonging to a depot never exceeds the capacity of that depot [20].
• Multi-commodity models. In general, the multi-commodity models can be considered as the extensions of the network flow models of the single depot ve- hicle scheduling problems. There is an independent network for each depot and the multi-commodity models are based on the combination of these networks (which is a multigraph) [94].
• Set partitioning models. The main idea behind the set partitioning models is to enumerate all feasible routes for the vehicles and then choose a proper subset of these routes that satisfies all constraints. In contrast with other formulations
duty related constraints (like time or fuel restrictions) can be easily recognized [17].
The quality of the LP is an important factor for any solution method in obtaining the optimal integer solution. The single-commodity models provide weaker LP-bound than the connection-based multi-commodity flow formulation which has the same bound quality as the set partitioning model.
2.3 Vehicle routing
Since the transportation process involves all stages of the production and distribution systems and represents a relevant component (generally from 10% to 20%) of the final cost of the goods, the vehicle routing problem is an extremely important practical problem. The large number of real-world applications, both in North America and in Europe, have widely shown that the use of computerized procedures for the distri- bution process planning produces substantial savings (generally from 5% to 20%) in the global transportation costs. It is easy to see that the impact of these savings on the global economic system is significant [125].
2.3.1 General introduction to vehicle routing
The Vehicle Routing Problem calls for the determination of the optimal set of routes to be performed by a fleet of vehicles to serve a given set of customers, and it is one of the most important and studied combinatorial optimization problems. In most of the cases it is assumed that some goods must be distributed between depots and customers.
The distribution of goods is carried out by a set of vehicles, which are located in one or more depots and perform their movements by an appropriate road network.
To solve the vehicle routing problem it is necessary to determine a set of routes, each performed by a single vehicle that starts and ends at its own depot, such that all customer demand is satisfied with respect to the operational constraints and the global transportation cost is minimized.
The road network is usually represented by a directed graph. The arcs of the graph represent the road sections while the nodes of the graph may represent depots, customers or road junctions. If every arc of the graph can be traversed in both directions then it is possible to represent the road network with an undirected graph.
There is a cost associated with each arc which denotes the length or the travel time of the given road section. Note, that this parameter may depend on the vehicle type or on the period during the road section is traversed. Unlike the road network which is more or less the same in each application, the characteristics of the customers and the vehicle fleet are often determined by the given application.
2.3.2 Variants, modifications, extensions
There are many different variants of the vehicle routing problem and nearly all of them based on some real life application. In many cases it is assumed that some goods must be distributed between depots and customers. However, typical applications may also include waste collection, school bus routing, dial-a-ride systems and many more. Most of the applications can be modeled by the following variants of the vehicle routing problem:
• Capacitated vehicle routing. The capacity refers to the capacity of the cargo hold of vehicles. This is the simplest and most studied variant of vehicle routing.
• Distance constrained vehicle routing. A global constraint imposed on the fleet, usually on the distance or on the time.
• Vehicle routing with time windows. Each customer must be served in an associated time window.
• Vehicle routing with backhauls. The customer set is partitioned into two subsets. The elements of the first subset are the linehaul customers, each of them requiring a given quantity of product to be delivered. The second subset contains the backhaul customers, where a given quantity of inbound product
must be picked up. All linehaul customers must be served before any backhaul customer is served.
• Vehicle routing with pickup and delivery. A set of transportation requests have to be satisfied. Each request is defined by a pickup point, the corresponding delivery point and a demand to be transported between these locations.
2.3.3 Complexity of vehicle routing
It is easy to see that the vehicle routing problem is a generalization of the well-known travelling salesman problem which is known to be NP-hard (Note that the travelling salesman problem is also a generalization, namely of the Hamiltionian cycle problem which is one of Karp’s original 21 problems [73]). As the different variants of the problem become more and more convoluted, the complexity of the problem increases as well. However, this does not mean, that an algorithm, that can solve a complicated variant (like vehicle routing with time windows) performs well on other “simpler” (like capacitated vehicle routing) variants. On the contrary, practice shows that different variants need different solution methods and algorithms.
2.3.4 Popular methods for vehicle routing
Due to its practical importance, vehicle routing is an extensively studied branch of operations research. Exact and heuristic methods are also popular, for comprehensive surveys see e.g. [30, 52, 82, 105, 125].
Exact methods
A typical vehicle routing problem can be formulated as an integer programming prob- lem or a mixed-integer programming problem, see e.g. [7, 22, 25, 48, 83, 81]. The proposed models take into account more and more characteristics of the real-world ap- plications and the developed algorithms and implementations can find good solutions for even industrial size problems in reasonable time.
Methods based on heuristic
Real-life applications are often so convoluted that they cannot be solved by exact methods. Thus, heuristic methods are also very popular and frequently used to solve vehicle routing problems [51]. These methods include
• genetic algorithms [6, 108]
• tabu search [50, 124]
• ant-colony optimization [11, 134]
• simulated annealing [21, 100]
• many other heuristic methods [24, 106].
2.4 Reaction-pathway identification
Reaction-pathway identification plays a key role in the study of the kinetics of mech- anisms of chemical or biochemical reactions [16]. For example, it is essential for understanding the effects of external conditions on the rates of catalytic reactions.
Such understanding can be a basis for various applications, especially for designing novel industrial chemical processes.
2.4.1 General introduction to reaction-pathway identification
Any chemical reaction consists of elementary reactions. Given the reactants and the final products of the overall chemical reaction, the aim of reaction-pathway identi- fication is to determine the most likely pathway i.e., interconnection between the elementary reactions that yield the given final products from the precursors. Al- though the knowledge of the rate, reversibility, equilibrium and the extent of the reaction facilitates the ultimate identification of the definite mechanism, the reaction pathway in itself contains no information about these parameters. Thus, the deter- mination of a reaction pathway or mechanism consists of two phases for any given overall reaction.
In the first phase all of the feasible candidate mechanisms are identified and then in the second phase the ultimate pathway or mechanism is selected from the candidate mechanisms identified in the first phase. Those who are engaged in reaction-pathway identification often deal with both phases. Both of these phases have their own unique tasks and difficulties.
The first phase of reaction-pathway identification
Every reaction pathway leading from the precursors to the final products of the re- action is a network of the elementary reactions constituting the pathway. In such a network, each elementary reaction could contribute to the forward, reverse or no step to the network. These three possibilites result in 59048, i.e., (310−1) possible combinations even if the network consists of only ten elementary reactions. This may result in hundreds of plausible networks from which the feasible candidate pathways are to be identified.
Complexity
It is easy to see that this is indeed a mathematically and computationally challenging problem. Furthermore, due to the relationship (which will be detailed later) between the reaction-pathway identification problem and the process-network synthesis prob- lem, the complexity of the reaction-pathway identification problem is NP-hard [16].
Due to the above, it is not a big surprise that the first phase of reaction-pathway identification has drawn the attraction of relatively few researchers.
The second phase of reaction-pathway identification
The second phase is esentially based on the advancement of modern precision sen- sors, high-speed computing methods and devices which resulted in the more accurate measurements of the experimental parameters, efficient spectroscopic determination, speedy simulation of mechanistic reaction-rate equations, reliable molecular dynamic and quantum mechanical calculations, and robust multi-steady state or stability anal- ysis. The resultant information from these experiments and observations is collected
in huge knowledge and data bases.
In the second phase, the candidate pathways or mechanisms are virtually selected from these knowledge and data bases by the researchers. Note, that in the light of new experimental and computational results, such pathways and mechanisms could be modified.
Interaction between the two phases of reaction-pathway identification The latter approach has the definite possibility that a valid pathway or mechanism may be easily overlooked. It is hard to eliminate this possibility on the basis of exper- imental or computational results. To overcome this problem, all the valid candidate mechanisms should be rigorously identified in the first phase. Thus, the two phases of reaction-pathway identification should be executed successively and iteratively.
Moreover, the phases should not only undertaken sequentially, but interactively as well.
It is not uncommon that the input elementary reactions to the first phase are extracted from the data and knowledge bases generated by the expirements and ob- servations in the second phase. The second phase could detect a previously unknown active species contributing to the reaction under consideration which could result in the addition of one or more elementary reaction or reactions to the first phase. Thus, the synthesis of feasible candidate networks from all plausible elementary reactions is the most rational approach for accomplishing the first phase of reaction-pathway identification.
2.4.2 Existing methods
The first phase of reaction-pathway identification is solved by mathematical methods.
These methods have different theoretical backgrounds, like
• Linear algebra. The earliest methods were based on linear algebra [115, 116]
and this approach is still popular even today [123]. While these methods based on linear algebra, they do not use linear algebraic bases to characterize a system
of chemical reactions but some more refined concepts, like direct paths [64, 117]
or simplexes [122].
• Convex analysis. Convex analysis became very popular around 2000 when it was extensively used for the analysis of metabolic networks [102, 112]. Perhaps elementary flux modes [103, 114] and extreme pathways [104, 111, 113] are the best known approaches.
• Graph theory. While these methods are heavily based on graph theory [36, 37, 38], they also incorporate the elements of linear algebra and [31, 32]
mathematical programming [85, 89].
• Other methods. Methods based on other theoretical backgrounds have been also used to accomplish the first phase, see e.g., [66, 92, 93]
Scientists engaged in the second phase usually have a background related to catalysis, biochemistry or combustion science. Due to the industrial and practi- cal significance of the subject matter, their number is vast and increasing, see e.g.
[18, 33, 34, 61, 62, 127, 128].
The P-graph framework
This chapter overviews the main concepts and ideas behind the P-graph framework.
The framework was introduced in the early nineties to provide a mathematically rigorous approach for complex optimization problems arising in chemical and allied industries. Nowadays, as a result of nearly two decades of continous development it is extended to solve various other combinatorial optimization problems often arising in industrial applications.
3.1 Motivation
As it has been shown in section 2.1, mathematical programming methods are fre- quently used to solve process-network synthesis problems. Moreover, these methods are considered to be exact in contrast to heuristic methods. A typical method apply- ing mathematical programming usually has the following steps:
1. Generate the mathematical model from the problem definition and the initial data.
2. Solve the generated model by a solver.
3. Determine the optimal flowsheet from the solution of the mathematical pro- gramming model.
20
Note, that while the above procedure is considered to be exact, it does not ex- clude heuristics entirely. The first step, the generation of the mathematical model is often guided by intuition. While a heuristic method generates structures that can be deduced from its rules, a mathematical programming method determines structures embedded in the “superstructure”. Potentially optimal structures might be excluded from consideration, if the heuristic rules or the initial superstructure is not sufficiently complete.
This was demonstrated in [79]. For the extremely simple case, for the production of pure products from one feed stream by simple and sharp separators, it has been always assumed, but never rigorously proved, that the optimal structure of a separation network cannot contain loops. While the assumption has probably been satisfied for such a simple case, it may be invalid for some separation problems of practical importance, such as the case of multiple feeds or multicomponent products. [79]
described a numerical example where the optimal structure of a separation system contained a loop which demonstrated that recycling should be allowed in the minimum cost separation system.
The P-graph framework provides an in-depth study of the fundamental math- ematical properties of the superstructure and introduces the concept of “maximal structure” which is analogous to the conventionally used term superstructure. The framework directly and systematically, i.e., algorithmically constitutes the objective function and the set of constraints from the input parameters. Based on mathemati- cally rigorous definitions and theorems, it is formally proven that the global optimum is included in the generated mathematical model. Moreover, the framework judi- ciously exploits the structural features of the process to be synthesized which gives rise to efficient algorithms which are readily implementable on computers.
3.2 Combinatorial foundations
In process-network synthesis, a material is uniquely defined by its composition, i.e., by its components and their concentrations. The exact description may vary depending on the desired level of abstraction and precision.
Operating units are the functional units in a process network performing various operations. Any operating unit can be specified by the set of its input materials and the set of its output materials. If an operating unit is denoted by a pair (α,β), then α is the set of inputs to and β is the set of outputs from the operating unit. An operating unit is not defined unless its input and output materials are specified.
LetM be a given finite nonempty set of all materials to be taken into consideration in the process synthesis.
Definition 3.2.1 (Synthesis problem) A synthesis problem is defined by the triplet (P,R,O), where
P(⊂M) is a set of final products,
R(⊂M,P ∩R 6=∅) is a set of raw materials, and
O(⊆℘(M)×℘(M))
is a set of operating units (and ℘(M) denotes the power set of the materials).
The relationships among the sets P,R,O appears to be very trivial from the stand- point of chemical engineering. Still, it is essential to ensure mathematical rigor and to the flawless execution of the computer algorithms for process-network synthesis.
3.3 The P-graph representation
Conventional graphs are suitable for analyzing a process structure, however, such graphs are incapable of uniquely representing process structures in synthesis. The examples in [44] demonstrate that the two most commonly used graphs in chemi- cal engineering, digraphs and signal-flow graphs are semantically not rich enough to faithfully represent a process structure. The former is not sufficient to uniquely rep- resent individual materials and their relationship and the latter is not sufficient to uniquely represent individual operating units and their relationship.
3.3.1 Formal definition
To uniquely characterize a synthesis problem, a more sophisticated graph is required.
Thus, [44] proposed a special directed bipartite graph, the process graph (or P-graph in short) to capture not only the syntactic but also the semantic contents of the process structure. A graph is bipartite if its vertices can be partitioned into two disjoint sets and no two vertices in the same set are adjacent. Thus a P-graph is defined formally as follows.
Definition 3.3.1 (P-graph) Let m be a finite set and
o ⊆℘(m)×℘(m). (3.3.1)
A P-graph is defined by a pair (m, o) where the vertices of the graph are the elements of
m∪o (3.3.2)
and the arcs of the graph are the elements of
A =A1∪A2 (3.3.3)
with
A1 ={(x, y) :y= (α, β)∈o and x ∈α} (3.3.4) and
A2 ={(y, x) :y = (α, β)∈o and x∈β}. (3.3.5) Definition 3.3.2 (Structure of a system) Let m ⊆ M, o ⊆ O and o ⊆ ℘(m)×
℘(m). The structure of this system is defined by P-graph (m,o).
3.3.2 Illustrative example
A material in the process is symbolized by a circle, designating an M-type vertex while an operating unit is represented by a horizontal bar, designating an O-type vertex. For further classification see Fig. 3.1.
Operating unit Raw material Product material Intermediate material
Figure 3.1: P-graph symbols
For illustration, letP ={A},R ={E, G}andO ={({B},{A, D}),({C},{A, H}), ({D, E},{B}),({E, F},{C}),({G, H},{F})}. The corresponding P-graph is depicted on Fig. 3.2.
Since the elements of o are the pairs of some subsets ofm, o satisfies (3.3.1). The vertex set of this graph isV ={A, B, C, D, E, F, G, H,({B},{A, D}), ({C},{A, H}), ({D, E},{B}),({E, F},{C}),({G, H},{F})}. With these notations each arc inA1 is from an M-type vertex to an O-type vertex (e.g. (B,({B},{A, D}))) and in A2 from an O-type vertex to an M-type vertex (e.g. (({D, E},{B}), B)).
The fundamental properties of the P-graph are mathematically rigorous and for- mally proven. More of the basic definitions and many detailed proofs can be found in [44].
3.4 Structural mappings
Both the combinatorial axioms and the combinatorial algorithms manipulating the P-graphs can be formulated more concisely and perspicuously through structural mappings. Given a P-graph (m,o), the following structural mappings are defined.
Mapping ψ−(o) yields the set of materials of a process structure, each of which is an inlet to at least one operating unit in set o:
ψ−(o) = [
(α,β)∈o
α (3.4.1)
Mappingψ+(o) is the pair of mappingψ−(o) and thus yields the set of materials each
D
B C
F
H
E G
A
Figure 3.2: A sample P-graph
of which is an outlet from at least one operating unit in set o:
ψ+(o) = [
(α,β)∈o
β (3.4.2)
Mapping ψ(o) is the union of mappings ψ−(o) and ψ+(o) yielding the set of those materials each of which is either an inlet to or an outlet from at least one operating unit found in set o:
ψ(o) =ψ−(o)∪ψ+(o) (3.4.3)
Similar structural mappings can be defined on the materials to yield analog sets of operating units. Mapping ϕ−(m) yields the set of operating units of a process structure, each of which produces at least one material in set m:
ϕ−(m) ={(α, β)∈o :β∩m 6=∅} (3.4.4) Similarly,ϕ+(m) yields the set of operating units each of which consumes at least one material in set m:
ϕ+(m) ={(α, β)∈o :α∩m 6=∅}. (3.4.5) The union of mappings ϕ−(m) and ϕ+(m) is mapping ϕ(m) yielding the set of oper- ating units, each of which either produces or consumes at least one material in set m:
ϕ(m) =ϕ+(m)∪ϕ−(m) (3.4.6)
Now let m1 and m2 be two sets of materials, and o be a set of operating units.
Then, relation ⇒o is defined as follows:
m1 ⇒o m2 if and only if m2 =ψ+(ϕ+(m1)∩o). (3.4.7) Literally, the relation yields the set of materials produced by those operating units in set o that consume at least one material from set m1. The reflexive, transitive closure of ⇒o is denoted by ⇒∗o.
3.5 Axioms of combinatorially feasible process struc- tures
Certain combinatorial properties are inherent in all feasible process structures. For example, a structure containing no linkage between a raw material and a final product is unlikely to represent a practical process. The unique features of feasible processes are formulated into a complete mathematical axiom system and thus the search for the optimal structure is restricted to the set of feasible structures.
3.5.1 Formal definition
The following set of axioms express the necessary combinatorial properties to which a P-graph (m,o) must conform to be a combinatorially feasible process structure or solution structure of process-network synthesis problem (P, R, O):
Definition 3.5.1 (Solution-structure) P-graph (m,o) is a solution-structure of syn- thesis problem (P,R,O) if it satisfies the following axioms:
(S1) Every final product is represented in the graph: P ⊆m.
(S2) A vertex of the material type has no input if and only if it represents a raw material: (m \ψ+(o) =m∩R).
(S3) Every vertex of the operating unit type represents an operating unit defined in this synthesis problem: (o ⊆O).
(S4) Every vertex of the operating unit type has at least one path leading to a vertex of the material type representing a final product: ∀o ∈ o there exists a set m′ such that ψ+({o})⇒∗o m′ and m′∩P 6=∅.
(S5) If a vertex of the material-type belongs to the graph, it must represent an input to or an output from at least one operating unit represented in the graph: m ⊆ψ(o).
In other words, Axiom (S1) ensures that each product is produced by at least one operating unit in the process system; Axiom (S2) implies that no raw material should
be generated by the process system under consideration; through Axiom (S3) only the plausible operating units are taken into account during synthesis; Axiom (S4) disallowes the existence of any operating unit not contributing to the generation of any product and finally Axiom (S5) ensures that only those materials that belong to at least one operating unit in the structure can belong to the structure.
P-graph (m,o) is defined to be a combinatorial feasible or solution structure for a synthesis problem (P,R,O) if and only if it satisfies Axioms (S1) through (S5).
3.5.2 Utilization
This axiom set acts as a filter to eliminate all combinatorially infeasible or invalid networks. In a super-structure generated by a traditional method the number of infeasible networks can be frequently vast even when the super-structure is completely and correctly constructed. For example, the commercial size process in [43, 47] has 35 operating units which gives rise to a complete super-structure containing (235-1) or roughly 34.36 billion possible networks.
None of the traditional methods of process-network synthesis allows the exclusion of the overwhelming majority of infeasible networks a priori. To find the optimal structure among the 34.36 billion possible networks a conventional mathematical programming has to search all of them. At this magnitude, if the efficiency of a conventional method is increased by 100%, it is the same as if the search space is reduced from 34.36 billion to 17.18 billion possible networks which is still an enormous number.
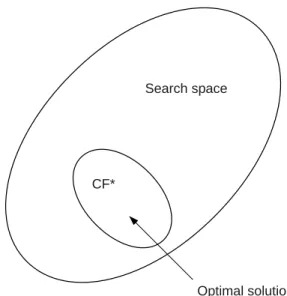
In contrast to the above, with the five axioms it is possible to reduce the search space to the combinatorially feasible solution structures. (See Fig. 3.3) In case of the example cited from [43, 47] this means that it is sufficient to consider 3465 combinatorially feasible networks instead of 34.36 billion possible networks. Note that the search space is reduced by roughly 99.99999% percent.
Figure 3.3: Reduction of the search space
3.5.3 Maximal structure
Let S(P,R,O) be the set of all solution-structures for process-synthesis problem (P,R,O). One of the basic properties of S(P,R,O) is that it is closed under union, i.e., the union of two solution-structures remain a solution structure. Formally, if:
σ1 ∈S(P,R,O) and σ2 ∈S(P,R,O) (3.5.1) then
(σ1∪σ2)∈S(P,R,O). (3.5.2) Definition 3.5.2 (Maximal structure) The union of all solution structures, de- noted by µ(P,R,O) is defined to be the maximal structure, i.e.,
µ(P,R,O) = [
σ∈S(P,R,O)
σ (3.5.3)
In the maximal structure, each arc or vertex belong to at least one solution- structure and each solution-structure is a subgraph of the maximal structure. The maximal structure has been extensively studied in [42] where many of its properties
has been formally proven. Since µ(P,R,O) is closed under union, and its cardinality is finite, the maximal structure is a solution structure itself.
The maximal structure of the synthesis problem (P,R,O) comprises all the com- binatorially feasible structures capable of yielding the specified products from the given raw materials. Thus, the maximal structure contains the optimal process and the mathematical model of a process-network synthesis problem should be based on the maximal structure.
3.6 Combinatorial algorithms
Based on axioms (S1)-(S5) two important combinatorial algorithms can be formu- lated. Algorithm MSG generates the maximal structure of a given problem while al- gorithm SSG generates each combinatorially feasible solution structure exactly once.
3.6.1 Algorithm MSG
Algorithm MSG (Maximal Structure Generator) generates the maximal structure of the given (P,R,O) process-network synthesis problem in polynomial time. In the reduction part algorithm MSG eliminates the materials and operating units which should not belong to the maximal structure. This is carried out stepwisely starting from the raw materials of the input structure validating that no node violates any of the five axioms. In this phase the elimination of a node often leads to the elimination of other nodes linked to it.
In the construction phase the remaining nodes are linked again stepwisely but this time starting from the products. The linking is done with respect to the axioms.
Note, that some of the feasible linkages may be eliminated in the reduction phase and thus they must be reestablished in the construction phase.
Running algorithm MSG to determine the maximal structure of the process- network synthesis problem should be the first step of a solution procedure. Besides generating the mathematical programming model of the problem it can be used to determine whether the problem has a feasible solution, or not. Since the maximal
structure is the union of all combinatorially feasible solution structures, the absence of the maximal structure implies that the problem has no feasible solution.
3.6.2 Algorithm SSG
Algorithm SSG (Solution Structure Generator) has been developed to generate the set of combinatorially feasible solution structures which is also of fundamental importance [43]. SSG generates each combinatorially feasible solution structure exactly once.
Algorithm SSG was originally introduced as a recursive algorithm which used de- cision mappings [47]. While recursion has a certain elegancy in expressing algorithms it is not the most efficient approach in case of a computer implementation. Thus, like many other recursive algorithm, SSG has a nonrecursive formulation, which is implemented in practice.
This nonrecursive formulation of SSG is essentially a branch and bound without a bound function and the enumeration of the combinatorially feasible solutions is the generation of the complete search tree. Note, that while the size of the set of combinatorially feasible solution structures is excessively large to have its elements enumerated in practice, SSG still constitutes a fundamental building block for a mathematical programming approach to process synthesis.
3.7 Parametric model of process-network synthe- sis
A mathematical programming problem consists of the constraints and the objective function. For a process-network synthesis problem, the constraints comprise the mass balances, the availability of raw materials and the lower bounds on the amounts of products to be manufactured to meet the demand.
3.7.1 Mass balance constraints
For each material mj a lower bound Lp(mj) and an upper bound Up(mj) is defined on the gross production. If material mj is a product then the lower bound Lp(mj) on the gross result must be greater than zero; it is defined as zero otherwise.
Lp(mj) =
>0 ∀mj ∈P 0 otherwise.
(3.7.1)
If mj is a raw material then the upper bound on the gross result is set to zero;
otherwise, it must be greater than, or equal to Lp(mj):
Up(mj) =
0 ∀mj ∈R
≥Lp(mj) otherwise.
(3.7.2)
An upper bound on the gross consumption of materials is also defined; for a material mj, it is denoted byUc(mj). Uc(mj) must be greater than zero ifmj is a raw material;
otherwise it is defined as zero.
Uc(mj) =
>0 ∀mj ∈R 0 otherwise.
(3.7.3)
Every intermediate material must satisfy the mass balance constraints such that the amount produced from each intermediate material has to be greater than or equal to the amount consumed from that material.
3.7.2 Objective function
The objective function represents the cost of the network, which is to be minimized.
The cost of the network consists of the costs of the operating units and raw materials.
The annual cost of an operating unit is considered to be the sum of its operating cost and its annualized investment cost:
annual cost = operating cost +investment cost
payout period (3.7.4)
Since the optimization model is expected to provide the optimal loads of operating units beside the optimal process structure, the cost is given as the function of the mass load, e.g., by a linear function with a fixed charge
cf(oi) +cp(oi)xi (3.7.5)
where cf(oi) is the fixed charge, cp(oi) is the proportionality constant, andxi is the load of the operating unit, which typically varies between 0 and 1, i.e., 0-100%. If both the investment and operating costs are given by functions, then the cost function is the combination of them. The parameters of the linear cost function with fixed charge are the sums of the parameters cfop(oi) andcpop(oi) of the operating cost and the parameters payout periodcfinv(oi) and payout periodcpinv(oi) of the annualized investment cost:
cf(oi) = cfinv(oi)
payout period+cfop(oi) (3.7.6) cp(oi) = cpinv(oi)
payout period+cpop(oi) (3.7.7) The price of raw material mj ∈R is denoted by cm(mj).
3.7.3 Further notations
The relation between material mj and operating unit oi is expressed by aij which denotes the difference between the production and consumption rate ofmj by oi:
αi ={mj ∈M :aji <0} (3.7.8) and
βi ={mj ∈M :aji >0}. (3.7.9) Now denote the set of operating units in the optimal structure by o∗ ⊆O and the set of materials by m∗ ⊆M where
m∗ = [
(αi,βi)∈o∗
αi∪βi. (3.7.10)
Furthermore, denote the vector of the optimal loads of the operating units for the problem by x∗ = [x1, x2, ..., xn]T and the objective value by
z∗ = X
(αi,βi)=oi∈o∗
(cf(oi) +x∗i(cp(oi)− X
mj∈α∪β
aijcm(mj))). (3.7.11)