TranslaTional science
Genome- wide whole blood transcriptome profiling in a large European cohort of systemic sclerosis patients
lorenzo Beretta ,
1Guillermo Barturen,
2Barbara Vigone,
1chiara Bellocchi,
1,3nicolas Hunzelmann,
4ellen De langhe,
5ricard cervera,
6Maria Gerosa,
3lászló Kovács,
7rafaela ortega castro,
8isabel almeida,
9Divi cornec,
10,11carlo chizzolini,
12Jacques- olivier Pers,
10Zuzanna Makowska,
13ralf lesche,
14Martin Kerick,
15Marta eugenia alarcón- riquelme,
2Javier Martin,
15PrecisesaDs ssc substudy group, PrecisesaDs Flow cytometry study group
To cite: Beretta l, Barturen G, Vigone B, et al. Ann Rheum Dis 2020;79:1218–1226.
Handling editor Josef s smolen
►additional material is published online only. To view please visit the journal online (http:// dx. doi. org/ 10. 1136/
annrheumdis- 2020- 217116).
For numbered affiliations see end of article.
Correspondence to Dr lorenzo Beretta, referral center for systemic autoimmune Diseases, Fondazione irccs ca’ Granda ospedale Maggiore Policlinico di Milano, Milan 20122, italy;
lorberimm@ hotmail. com Mea- r and JM are joint senior authors.
received 10 February 2020 revised 30 april 2020 accepted 14 May 2020 Published online First 19 June 2020
© author(s) (or their employer(s)) 2020. re- use permitted under cc BY- nc. no commercial re- use. see rights and permissions. Published by BMJ.
AbSTrACT
Objectives The analysis of annotated transcripts from genome- wide expression studies may help to understand the pathogenesis of complex diseases, such as systemic sclerosis (ssc). We performed a whole blood (WB) transcriptome analysis on rna collected in the context of the european PrecisesaDs project, aiming at characterising the pathways that differentiate ssc from controls and that are reproducible in geographically diverse populations.
Methods samples from 162 patients and 252 controls were collected in rna stabilisers. cases and controls were divided into a discovery (n=79+163; southern europe) and validation cohort (n=83+89; central- Western europe). rna sequencing was performed by an illumina assay. Functional annotations of reactome pathways were performed with the Functional analysis of individual Microarray expression (FaiMe) algorithm.
in parallel, immunophenotyping of 28 circulating cell populations was performed. We tested the presence of differentially expressed genes/pathways and the correlation between absolute cell counts and rna transcripts/FaiMe scores in regression models. results significant in both populations were considered as replicated.
results overall, 15 224 genes and 1277 functional pathways were available; of these, 99 and 225 were significant in both sets. among replicated pathways, we found a deregulation in type- i interferon, Toll- like receptor cascade, tumour suppressor p53 protein function, platelet degranulation and activation. rna transcripts or FaiMe scores were jointly correlated with cell subtypes with strong geographical differences;
neutrophils were the major determinant of gene expression in ssc- WB samples.
Conclusions We discovered a set of differentially expressed genes/pathways validated in two independent sets of patients with ssc, highlighting a number of deregulated processes that have relevance for the pathogenesis of autoimmunity and ssc.
InTrOduCTIOn
Systemic sclerosis (SSc) is a complex disease char- acterised by immune system activation, widespread vasculopathy, fibrosis of the skin and internal organs.1 During the last decade, there has been a
great advance in understanding the parthenogenesis of SSc2 with relevance in drug development and repurposing3 as well as in patient stratification and reclassification to pursue the goals of personalised medicine.4 A major contribution to the study of scleroderma pathogenesis has been given by next- generation sequencing (NGS) techniques.5–7
Gene expression profiling has long been used to understand the contribution of genes to biological functions and to discover deregulated pathways that may contribute to disease susceptibility.5 6 8 The vast majority of gene expression studies in SSc are based on microarray technology, while NGS methods, namely RNA sequencing (RNA- seq), despite their advantages over existing approaches, have had limited applications.9–13 RNA- seq yields an unlimited potential due to its resolution and deep- coverage, low sensitivity to background noise, high sensitivity at the extremes of gene expres- sion ranges, high accuracy and concordance with quantitative PCR as well as high reproducibility.14 High- quality RNA can be extracted from whole blood (WB) samples collected with RNA stabi- lisers, allowing the study of large populations15
Key messages
What is already known about this subject?
► A coupled whole blood transcriptome and immunophenotyping analysis has never been performed in patients with systemic sclerosis.
What does this study add?
► Cell composition largely influences the transcriptome in a context- dependent and population- dependent manner.
► A set of validated transcripts and related pathways well differentiate cases from controls.
► Toll- like receptor signalling and other deregulated pathways underlie the pathogenesis of systemic sclerosis.
How might this impact on clinical practice or future developments?
► Results from Reactome pathway analysis may be helpful for drug repurposing.
and reducing technical and source variability that may limit the reproducibility of results and introduce a systematic bias in multicentre studies.16
As a final step of transcriptome studies, differentially expressed (DE) genes are annotated to provide a biological interpretation of results.17 Usually, annotation is based on gene- set analysis failing to provide information at the personalised level. Novel strate- gies developed to translate gene expression data into individual- ised functional profiles proved more informative than gene- set enrichment analysis.18 19 The so- called Functional Analysis of Individual Microarray Expression (FAIME) algorithm18 exhibits more power compared with enrichment methods and yields reproducible results among different experiments pertaining to the same disease.20 FAIME is suitable for functional analysis in a multicohort that is characterised by a high background noise, ensuring the reproducibility of results in a discovery/validation setting.21
In the present study, we performed a genome- wide WB tran- scriptome analysis of patients with SSc enrolled for the multi- centre PRECISESADS project. Via a thorough bioinformatic pipeline, we discovered a reproducible set of DE pathways that withstand validation in geographically diverse populations.
Finally, we show how the knowledge gained from our study can be used for drug repurposing and to find candidates of druggable pathways.
MATerIAl And MeTHOdS Patients and controls
Patients with a diagnosis of SSc according to the American College of Rheumatology (ACR)/European League Against Rheumatism (EULAR) 2013 criteria22 participating in the multi- centre PRECISESADS project23 were included. Patients were grouped according to their geographical origin into a discovery (Southern Europe: Italy, Portugal and Spain) and a validation (Central- Western Europe: Belgium, France, Germany, Hungary and Switzerland) set. Controls were selected for each set to match the cases according to age and gender. Patients were clas- sified as diffuse cutaneous SSc (dcSSc) or limited cutaneous SSc (lcSSc); patients with definite SSc without fibrotic skin disease and puffy fingers were classified as lcSSc. All the patients and controls gave written informed consent for the study that was approved by local ethic committees.
rnA sequencing
Total RNA was extracted from samples collected in Tempus tubes using Tempus Spin technology (Applied Biosystems).
Samples were depleted of alpha- globin and beta- globin mRNAs using globinCLEAR protocol (Ambion) and 1 µg of total RNA as input. Subsequently, 400 ng of globin- depleted total RNA was used for library synthesis with TruSeq Stranded mRNA HT kit (Illumina). Libraries were quantified using qualitative PCR with PerfeCTa NGS kit (Quanta Biosciences), and equimolar amounts of samples from the same 96- well plate were pooled. Four pools were clustered on a high output flow cell (two lanes per pool) using HiSeq SR Cluster kit V.4 and the cBot instrument (Illu- mina). Subsequently, 50 cycles of single- read sequencing were performed on a HiSeq2500 instrument using and HiSeq SBS kit V.4 (Illumina). The clustering and sequencing steps were repeated for three runs to generate enough reads per sample. The raw sequencing data were preprocessed using bcl2fastq software and the quality assessed using FastQC tools.24 Cutadapt25 was used to remove 3′ end nucleotides below 20 Phred quality score and extraneous adapters; additionally, reads below 25 nucleotides
after trimming were discarded. Reads were then processed and aligned to the UCSC Homo sapiens reference genome (Build hg19) using STAR V.2.5.2b.26 Two- pass mapping with default alignment parameters were used. To produce the quantification data, we used RSEM V.1.2.3127 resulting in gene level expres- sion estimates (Transcripts Per Million, TPM and read counts). A sample would pass the RNA single QC if (1) the number of reads mapped to the genes was more than 7 million and (2) the RIN (RNA integrity number) value was higher than 7.
Immunophenotyping
Immunophenotyping was performed after blood collection in Duraclone tubes (Beckman Coulter) specifically designed and optimised for the PRECISESADS study. Harmonisation of instruments used for flow cytometry analysis was described else- where, providing evidence of high- reproducible data in different centres.28 WB samples from patients and controls were collected in tubes with to ready- to- use unitised, dry format antibody cocktails and locally analysed within 24 hours. Flow cytometers were regularly (every 3 months) calibrated to obtain the same target mean fluorescence intensities of a reference instrument and whose coefficient of variation proved to be lower than 3.4%
throughout the study.28 In addition, prior to the inclusion of any patient, a supplementary daily procedure was adopted to ensure that the deviation was below 5% for each sample.
data analysis
For RNA seq preprocessing and DE analysis, the Limma R package29 was used. For all the other analysis, custom codes written in python by LB were used; software and libraries used for the analysis are listed in the online supplementary material.
Differential expression analysis and validation
Data were first corrected for batch, age and sex effects with the voom method.30 DE analysis was performed retaining genes with a false- discovery rate (FDR)- corrected p value <0.05 and a fold- change (FC) between cases and controls FC|>1.5. DE analysis was independently performed in the discovery and vali- dation sets and genes significant in both sets were considered as validated.
To evaluate to what extent genes selected by univariate feature selection in the discovery set jointly predicted the disease status in the validation set, a random forest model was built (500 trees) whose performance was evaluated via the area under precision- recall- gain curve (AUPRG)31 and via the area under receiver operating characteristic (AUROC).
Heatmaps were used to display validated genes: data were clustered by individuals’ similarity with the k- means algorithm and by transcript similarity, by means of the hierarchical clus- tering Ward method.
Functional annotation, differential expression pathway analysis and validation
Individual functional annotations were performed with the FAIME algorithm18 considering Reactome pathways32 mapped by at least 10 genes/transcripts; Entrez Ids without official gene symbols were dropped from the analysis.
To allow the comparison of FAIME scores between datasets, values were normalised to the unit interval and cube root trans- formation applied to unskew the data. Because FAIME scores are a composite measure of transcripts, FC cannot be used to measure the strength of pathway expression and the evaluation of effect size was used instead. Winsorised data were used to
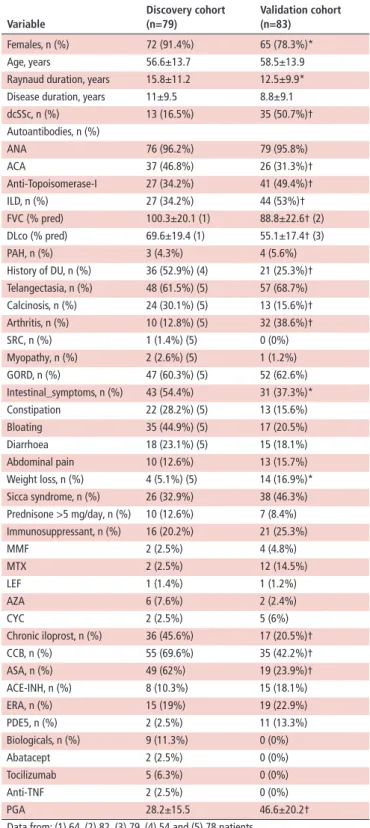
Table 1 Demographic and clinical characteristics of patients with systemic sclerosis (SSc) in the discovery and validation cohort Variable
discovery cohort (n=79)
Validation cohort (n=83)
Females, n (%) 72 (91.4%) 65 (78.3%)*
Age, years 56.6±13.7 58.5±13.9
Raynaud duration, years 15.8±11.2 12.5±9.9*
Disease duration, years 11±9.5 8.8±9.1
dcSSc, n (%) 13 (16.5%) 35 (50.7%)†
Autoantibodies, n (%)
ANA 76 (96.2%) 79 (95.8%)
ACA 37 (46.8%) 26 (31.3%)†
Anti- Topoisomerase- I 27 (34.2%) 41 (49.4%)†
ILD, n (%) 27 (34.2%) 44 (53%)†
FVC (% pred) 100.3±20.1 (1) 88.8±22.6† (2)
DLco (% pred) 69.6±19.4 (1) 55.1±17.4† (3)
PAH, n (%) 3 (4.3%) 4 (5.6%)
History of DU, n (%) 36 (52.9%) (4) 21 (25.3%)†
Telangectasia, n (%) 48 (61.5%) (5) 57 (68.7%)
Calcinosis, n (%) 24 (30.1%) (5) 13 (15.6%)†
Arthritis, n (%) 10 (12.8%) (5) 32 (38.6%)†
SRC, n (%) 1 (1.4%) (5) 0 (0%)
Myopathy, n (%) 2 (2.6%) (5) 1 (1.2%)
GORD, n (%) 47 (60.3%) (5) 52 (62.6%)
Intestinal_symptoms, n (%) 43 (54.4%) 31 (37.3%)*
Constipation 22 (28.2%) (5) 13 (15.6%)
Bloating 35 (44.9%) (5) 17 (20.5%)
Diarrhoea 18 (23.1%) (5) 15 (18.1%)
Abdominal pain 10 (12.6%) 13 (15.7%)
Weight loss, n (%) 4 (5.1%) (5) 14 (16.9%)*
Sicca syndrome, n (%) 26 (32.9%) 38 (46.3%)
Prednisone >5 mg/day, n (%) 10 (12.6%) 7 (8.4%) Immunosuppressant, n (%) 16 (20.2%) 21 (25.3%)
MMF 2 (2.5%) 4 (4.8%)
MTX 2 (2.5%) 12 (14.5%)
LEF 1 (1.4%) 1 (1.2%)
AZA 6 (7.6%) 2 (2.4%)
CYC 2 (2.5%) 5 (6%)
Chronic iloprost, n (%) 36 (45.6%) 17 (20.5%)†
CCB, n (%) 55 (69.6%) 35 (42.2%)†
ASA, n (%) 49 (62%) 19 (23.9%)†
ACE- INH, n (%) 8 (10.3%) 15 (18.1%)
ERA, n (%) 15 (19%) 19 (22.9%)
PDE5, n (%) 2 (2.5%) 11 (13.3%)
Biologicals, n (%) 9 (11.3%) 0 (0%)
Abatacept 2 (2.5%) 0 (0%)
Tocilizumab 5 (6.3%) 0 (0%)
Anti- TNF 2 (2.5%) 0 (0%)
PGA 28.2±15.5 46.6±20.2†
Data from: (1) 64, (2) 82, (3) 79, (4) 54 and (5) 78 patients.
*p<0.05 versus discovery.
†p<0.01 versus discovery.
ACA, anticentromere antibodies; ACE- INH, ACE inhibitors; ANA, antinuclear antibodies; ASA, low- dose acetilsalycilc acid; AZA, azathioprine; CCB, calcium- channel blockers; CYC, cyclophosphamide; dcSSc, diffuse cutaneous SSc; DLco, diffusing capacity for carbon monoxide; DU, digital ulcers; ERA, endothelin receptor antagonists; FVC, forced vital capacity; GORD, gastro- oesophageal reflux disease confirmed by gastroscopy, manometry or X- rays; HCQ, hydroxycloroquine; ILD, interstitial lung disease; LEF, leflunomide; MMF, mycopheolate mophetil; MTX, methotrexate; PAH, pulmonary artery hypertension confirmed by right- heart catetherisation; PDE5, phosphodiesterase 5 inhibitors; PGA, physician's global assessment (0–100); SRC, scleroderma renal crisis; TNF, tumour necrosis factor.
calculate the robust effect size (dr)33 and to perform t- test anal- ysis. Annotations with a FDR p<0.05 and with a |dr|>0.62897, corresponding to a moderate effect size34 were considered as significant.
Random forest and heatmaps were used to evaluate the joint effect of functional annotations and to visualise their interactions.
Druggable functional annotations
Genes contributing to validated FAIME pathways were explored via the Drug Gene Interaction database (DGIdb).35 Functional annotations were considered as druggable if at least one gene/
annotation was found in the DGIdb. Relationship between drug- gable annotations were explored via UpSet36 as described in the online supplementary material 1.
Association between gene expression and FAIME scores with immunophenotyping
Absolute cell counts were correlated with RNA transcripts and FAIME scores to quantify the contribution of immune cells to gene expression and function. We assumed that gene expression and functional annotations are a linear combination of expres- sion levels of immunophenotyped cells as a function of their rela- tive proportions.37 The elastic net regression method was applied to both sets in order to perform feature selection; L1 penalty was set to 1 (equivalent to least absolute shrinkage and selection operator) and the optimal regularisation parameters were chosen by internal fivefold cross- validation. Standardised β coefficients were used to determine the relative contribution ϕ of each of the 19 cell subtypes to the model: ϕ=βx/∑19
i=1βi,x= 1, 2, ..., 19 . Selected features were used to build regression models in each subset and tested for their generalizability in the other set. The overall internal and external contribution of linear models to transcripts or to functional annotation was expressed by means of the adjusted coefficient of determination (adjR2). The same procedure was performed including into the model the use of steroids (prednisone >5 mg/day, yes/no), hydroxychloroquine (yes/no) and immunosuppressants (any molecule, yes/no). The final model (with or without therapy as covariate) was chosen as the one that maximised the adjR2.
reSulTS
Overall, 162 patients with SSc and 252 controls were consid- ered after quality check and filtering; of these, 79 cases aged 56.6±13.7 years and 163 controls aged 53.8±11.8 years were included into the discovery set and 83 cases aged 58.5±13.9 years and 89 controls aged 55.2±13.6 years were included in the validation set. Demographic and clinical characteristics of patients with SSc are reported in table 1.
differential expression analysis
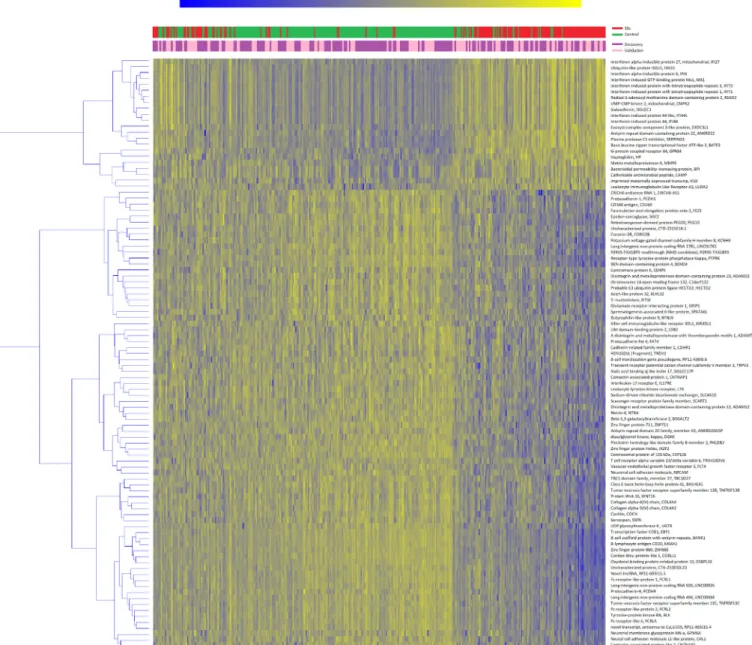
A total of 15224 genes passed the quality control and were selected for the analysis; the average number of reads/sample was 13 695 621.25 (range 8 318 927–32 665 993). Of those, 167 and 709 genes were significant in the discovery and vali- dation sets, respectively; 99 genes overlapped between the two sets and were thus considered as replicated (online supple- mentary file 1). Heatmap representation of replicated genes is shown in figure 1. Cases and controls were well separated after clustering analysis (χ2=143.202, p<0.001). The majority of genes were downregulated in SSc subjects that, conversely, consistently showed an increased expression of interferon (IFN)- related genes.
Figure 1 Heatmap of validated genes. Heatmap representation of replicated genes in the discovery (purple) or validation (pink) sets. Patients (in red) and controls (in green) are clustered column- wise via the k- means algorithm, genes are clustered row- wise via the hierarchical clustering Ward method. Patient- wise data standardisation was applied before clustering.
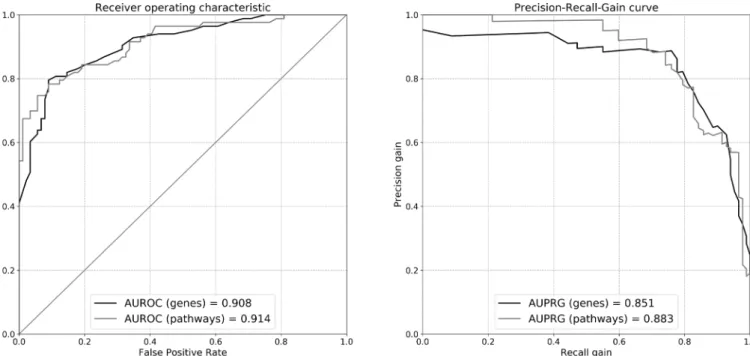
RNA- seq transcripts in the random forest classification algo- rithm could well discriminate cases from controls: with an AUROC=0.908 and AUPRG=0.851 after feature selection in the discovery set and replication in the validation set (figure 2, in comparison with Reactome pathways).
Pathway analysis
A total of 1277 unique Reactome pathways were selected. The dr of individualised FAIME scores and the number of FDR- corrected pathways was higher in the validation set than in the discovery set (online supplementary figure 1). Overall, 241 individual pathways were different between cases and controls in the discovery set, 676 in the validation set and 225 in the intersection between the two sets (online supplementary file 2). Validated FAIME pathways are represented in the heatmap in online supplementary figures 2 and 3, clustering analysis yielded a χ2=89.385, p<0.001 for the case versus control comparison.
Selected pathways in the discovery set could well predict the class in the validation set with an AUROC=0.914 and an AUPRG=0.884 (figure 2, in comparison with WB transcripts).
druggable functional annotations
Druggable Reactome pathways can be explored using UpSet, as shown in online supplementary figure 4. For illustrative purposes, we show an example where the existence of any drug associated with immune system activation/IFN signalling is eval- uated. Two drugs, bortezomib and irinotecan, emerged as poten- tial candidates to tackle the terms R- HSA-168256 (immune system), R- HSA-168249 (innate immune system), R- HSA- 168928 (DDX58/IFIH1- mediated induction of IFN- alpha/beta), R- HSA-913531 (IFN signalling) R- HSA-909733 (IFN alpha/beta signalling) and R- HSA-109581 (apoptosis).
The complete druggable pathways are included in the supple- mental upset SSc\data\FAIME SSc folder (found within the online
Figure 2 Validation of non- linear classification models fit of the random forest algorithm. Differentially expressed genes or pathways in the discovery set are used to train the model, whose performance is evaluated in the validation set. The performance is evaluated via the area under (AU) receiver operating characteristic (ROC) or precision- recall gain (PRG) curves. Black lines: curves for models trained on transcriptome data; grey lines:
curves for models trained on annotated pathways.
Table 2 Immunophenotyping results
Cell subset (gating strategy), count/mm3
discovery (n=203) Validation (n=144)
SSc (n=64) Ctrl (n=139) q SSc (n=72) Ctrl (n=72) q
Basophils (CD123 HLA- DR−) 58.3±39.7 184.9±464.6 0.009 44.3±30.6** 56±60.1* 0.211
Eosinophils (CD15+ CD16−) 174.5±371.1 167.3±174.8 NS 146.6±86.6 152.6±95 NS
Neutrophils (CD15− CD16+) 4116±2389 4363.3±2544.1 NS 4270±1648.8 3312.9±1324.3** 0.001
LDGs (CD15hi CD14−) 0±0.1 0±0.2 NS 0±0.1 0±0.1 NS
Classical monocytes (CD14hi CD16−) 376.9±170.3 390.4±220.8 NS 342.8±168.8 308.8±123.5** 0.208
Intermediate monocytes (CD14+/hi CD16+) 52.2±34.8 50.9±36.2 NS 65.3±37.2** 48.4±24.8 0.004
Non classical monocytes (CD14+ CD16 hi) 12.3±12.1 9.8±7.1 0.071 10.3±7.6 8.2±6.3 0.09
NK regulatory (CD3− CD56hi CD16−) 7±6.4 10±7.5 0.002 4±3.6*** 6.8±4.6*** 0.004
NK cytotoxic (CD3− CD56lo CD16hi) 132.7±95.3 234.2±200.9 1.18E-05 112.4±69.6 190.3±121.3 0.002
NK- like T cells (CD3+ CD56+) 65.7±54.9 130.9±119.3 1.18E-05 50.4±74.3** 101.7±85.1** 8.45E-05
B cells (CD3− CD19+) 152±109.9 256.3±217.6 1.43E-05 169.2±136.2 191.7±116.6** 0.212
CD4 T cells (CD3+ CD4+ CD8−) 649.9±284.3 1084.9±893.4 1.18E-05 607±316 760.8±329.7** 0.043
CD8 T cells (CD3+ CD4 CD8+) 258.6±144.8 408.9±279 2.11E-05 226.8±154.2 304.5±192.2** 0.044
Double positive T cells (CD3+ CD8+ CD4+) 11.4±9.5 23.1±23.1 5.76E-05 14.5±20.8 17.9±17.8 0.16
Double negative T cells (CD3+ CD8- CD4−) 20.7±14 42±33.7 1.11E-06 22.7±42.6 25±20.6*** 0.185
mDC1 (Lin- HLA- DR+ CD11c+ CD123 lo CD141− CD1c+) 2.6±3 11.3±37.8 0.005 1.2±1.1** 3±6.7** 8.12E-04
mDC2 (Lin- HLA- DR+ CD11c+ CD123 lo CD141+ CD1c−) 60.1±90.8 156±514.6 0.046 44.7±45.9 39.3±37.6** NS
mDC (Lin- HLA- DR+ CD11c +CD123 lo CD141− CD1c) 17.1±17.2 32.1±137.4 0.353 7.7±8.7* 10.9±29.9** NS
pDC (Lin- HLA- DR+ CD11c+ CD123 lo CD11c− CD123hi) 10.2±9.2 55.1±174.2 8.22E-04 4.8±4.9* 11.2±22.8*** 2.9E-05
False- discovery rate (FDR) corrected p values (q) after cube root transformation to unskew the data.
*q<0.05 versus discovery; **q<0.01 versus discovery; ***q<0.001 versus discovery.
DC, dendritic cells; LDG, low density grains; NK, natural killers.
supplementary material 2) that can be explored as described in the online supplementary material 1.
Correlations of gene expression and FAIMe scores with immunophenotyping
Flow cytometry data were available for 203 and 144 subjects in the discovery and validation sets (table 2). Cell counts of cases and controls within each set were different for many cell subsets;
additionally, cases- to- cases or controls- to- controls differences
could also be observed comparing the discovery and the valida- tion sets.
Results from elastic net regression analysis are detailed in the online supplementary file 3. The influence of immuno- phenotyping on RNA transcripts and functional annotation is summarised in table 3.
The number of regression models explaining at least 10%
of the variance of transcripts/FAIME annotations after correc- tion for concurrent therapy was higher in the validation than
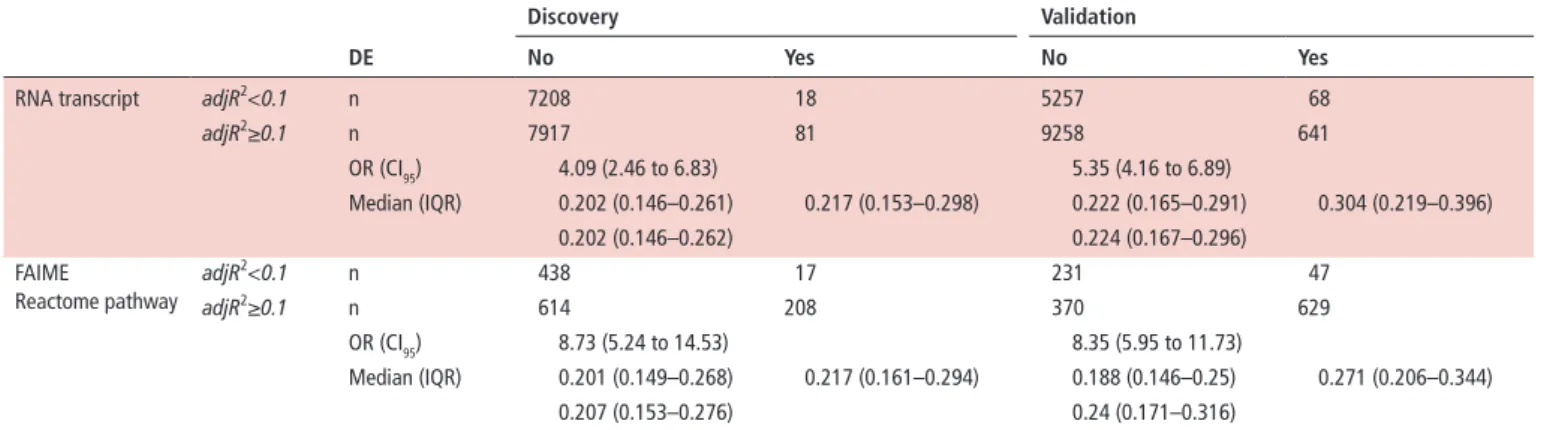
Table 3 Influence of immunophenotyping cell composition on differentially expressed (DE) genes and pathways de
discovery Validation
no Yes no Yes
RNA transcript adjR2<0.1 n 7208 18 5257 68
adjR2≥0.1 n 7917 81 9258 641
OR (CI95) 4.09 (2.46 to 6.83) 5.35 (4.16 to 6.89)
Median (IQR) 0.202 (0.146–0.261) 0.217 (0.153–0.298) 0.222 (0.165–0.291) 0.304 (0.219–0.396)
0.202 (0.146–0.262) 0.224 (0.167–0.296)
FAIME
Reactome pathway
adjR2<0.1 n 438 17 231 47
adjR2≥0.1 n 614 208 370 629
OR (CI95) 8.73 (5.24 to 14.53) 8.35 (5.95 to 11.73)
Median (IQR) 0.201 (0.149–0.268) 0.217 (0.161–0.294) 0.188 (0.146–0.25) 0.271 (0.206–0.344)
0.207 (0.153–0.276) 0.24 (0.171–0.316)
Correlation between absolute cell counts and RNA transcripts or FAIME scores in the discovery and validation sets after regression analysis and correction for concurrent therapy.
The adjusted coefficient of determination (adjR2) of elastic net models is shown. ORs and 95% confidence intervals (CI95) are calculated for categorised values; the 10% of explained variance is chosen as threshold to categorise regression models (meaningful≥10%, not meaningful<10%). Significant DE genes or pathways are more likely to be discovered when the transcriptome or functional data correlate with immunophenotyping data.
DE, differentially expressed; FAIME, Functional Analysis of Individual Microarray Expression.
in the discovery set: RNA, discovery, 7998/15224 (52.5%)—
validation, 9899/15224 (65%); Reactome pathway, discovery 822/1277 (64.4%)—validation, 999/1277 (78.2%). The median variance explained by meaningful regression models was also higher in the validation set than in the discovery set (22%–24%
vs about 20%). Regression models limitedly predicted RNA transcripts or FAIME scores in independent populations and only 849/7730 (11%) and 89/802 (11.1%) of relevant RNA transcript or pathway models (adjR2>0.1) in the discovery population were replicated in the validation set. These results suggest that immunophenotype mostly influences RNA tran- scriptome and the related functional annotations in a context- dependent and population- dependent manner. Differences in cell counts between cases and controls may influence the associ- ation between meaningful regression models and DE transcripts or pathways (table 3). This association is more pronounced in the validation set as a likely consequence of a differential neutro- phil count between cases and controls (online supplementary file 3). Overall neutrophils accounted for 36% and 29.3% of the variance of transcripts and for 30.7% and 27% of the variance of functional annotations in the two sets. CD4+ and CD8+ T cells were the subsets that most contributed to transcripts/anno- tations, while the average effect of steroids on functional path- ways was no higher than 2.3% and 4.7% (online supplementary file 3).
The influence of Reactome pathways/therapies on cell subsets was exploratively analysed via elastic net models in the two pooled populations; results are reported in online supplemen- tary file 5. Overall therapies only marginally influenced cell composition.
dISCuSSIOn
The present study is the first attempt to characterise the WB transcriptome in a large cohort of patients with SSc as part of an international multicentre collaborative project. The discovery/
validation strategy we applied guarantees that our results are reproducible and robust against environmental factors, genetic background and phenotypic variation ensuring their generalis- ability.38 Indeed, the testing of findings in populations different in time, space and clinical characteristics provides an added inherent value compared with the simple replication in pheno- typically similar populations, providing evidence for the causal relationship between genetic transcripts and disease.38
A larger number of DE genes were identified in the validation than in the discovery set (709 vs 167). This discrepancy seems mostly related to a different cell composition in the two popu- lations (table 1). In particular, strong differences, both in cases and controls, were observed in the neutrophil cell count that after correlation analysis and correction for concurrent therapy emerged as the major determinant of RNA abundance (online supplementary file 3). Nonetheless, we cannot exclude that other factors may have contributed to these results, including genotype- specific characteristics or a different phenotype and severity of SSc subjects (online supplementary table 1). Attempts to elucidate the latter aspect performing subset analyses were not fully convincing due to the relatively low effect size, despite significant FDR- adjusted p values (online supplementary file 4) and hence we cannot draw any definite conclusion: both a loss of power due to a reduced sample size and a true lack of signifi- cance can be advocated as explanation.
To gain biological insight on transcriptome data and to char- acterise deregulated pathways, we performed a functional anal- ysis via the FAIME framework. FAIME is advantageous in the context of a multicentre study because it is capable of dissecting the heterogeneity of complex diseases, avoiding normalisation and batch effect issues.21 We could thus confirm the pivotal role of IFN activation and signalling in SSc pathogenesis39 and highlighting the deregulation of several INF- related pathways.
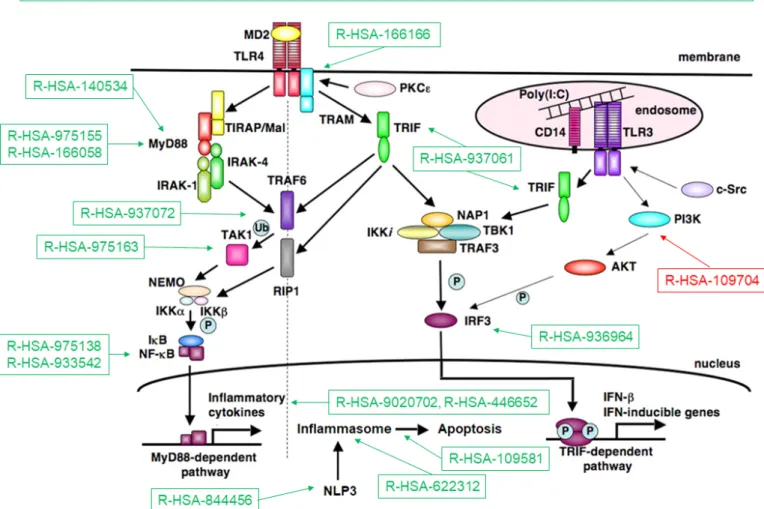
Figure 3 summarises the processes related to the TLR cascades that eventually contribute to IFN type I40 and inflammasome induction. These findings reinforce the notion that TLR and inflammasomes could constitute a potential target in SSc.41
Other pathways of interest are those related to the tumour suppressor p53 gene (TP53). p53 is an ubiquitous protein that regulates genes involved in DNA repair, stress response, cell growth arrest and metabolism, apoptosis and senescence, ulti- mately inhibiting tumorigenesis.42 Point mutations of TP53 have been described in interstitial lung disease.43 The expression of p53 in fibroblasts isolated from IPF lungs is reduced compared with HC- derived fibroblasts,44 and in ex vivo experiments, the loss of p53 activity has been related to a fibrogenic phenotype and its restoration may have a role in the resolution of lung fibrosis. The deregulation of TP53 we observed in SSc (R- HSA- 5633007) as a consequence of translational (R- HSA-3700989, R- HSA-6806003) and post- translational processes (R- HSA- 6804758, R- HSA-6804760, R- HSA-6806003, R- HSA-6804757)
Figure 3 Toll- like receptor (TLR) pathways deregulated in systemic sclerosis (SSc). Representation of TLR pathways and downstream mediators following TLR4 activation. Deregulated Reactome pathwyas in SSc, either upregulated (in green) or downregulated (in red) according to the Functional Analysis of Individual Microarray Expression (FAIME) method. TLR pathways are consistently upregulated in SSc (top). Downstream deregulated pathways include Toll/IL-1 receptor (TIR) domain- adapter MyD88- related signalling; MyD88- independent signalling; TIR- domain- containing adapter- inducing interferon- beta (TRIF) signalling; interferon regulatory factor 3 (IRF3) activation following interaction of TRIF with noncanonical kinase TBK1;
activation of the nuclear factor-κB (NF-κB) by the downstream mediators of MyD88, tumour necrosis factor receptor- associated factor 6 (TRAF6) or via the transforming growth factor (TGF)-β-activated kinase (TAK1); activation of the inflammasome by MyD88- dependent mechanisms; activation of the inflammasome NLRP3 (Cryopyrin); induction of apoptosis by inflammasomes; production of interleukin-1 (IL-1) by inflammasomes and IL-1 signalling (R- HSA-9020702, R- HSA-446652); downregulation of the negative feedback pathway constituted by phosphoinositide 3- kinases (PI3K) and its downstream target serine serin/threonine kinase Akt (PKB) (R- HSA-109704).
may contribute to extracellular matrix remodelling (R- HSA- 1474244, R- HSA-1474228) and collagen turnover (R- HSA- 1442490 in both sets and R- HSA-1474290 in the discovery set).
Similarly, the loss of p53 activity and reduced transcription of DNA repair genes (R- HSA-6796648) may partially explain the increased DNA damage described in SSc.45
Several other deregulated pathways were discovered by our analysis (online supplementary file 2), whose abnormalities are, in some cases, consistent with known pathogenetic mechanisms of SSc as summarised in online supplementary table.
Pathway analysis based on transcriptome data is potentially useful to discover putative therapeutic targets for drug repur- posing. Herein, we describe a framework to find druggable pathways based on the curated database DGIdb35 and the UpSet visualisation tool.36 The combination of druggable pathways that can be explored is gargantuan and cannot be summarised, yet the illustrative example we provide shows the potentialities of our approach. Two drugs emerged as potential candidates to tackle
immune system and IFN pathway: bortezomib and irinotecan.
Bortezomib, a protease inhibitor, is currently under investigation in a phase II clinical trial.46 Irinotecan is an analogue of campto- thecin (CPT),47 a topoisomerase I inhibitor capable of reducing collagen production in SSc fibroblasts.48
It could be argued that RNA- seq analysis of specific leucocyte subsets could theoretically have been more informative compared with WB analysis.49 50 Nonetheless, available methods for subset- specific expression profiling are ill- suited for large studies and the choice of the cell type to analyse is not obvious. Our correla- tion analysis clearly shows that population- dependent effects are unavoidable and strategies to accommodate these differences still need to be developed. Based on our experience, coupling RNA sequencing and immunophenotyping could add a valuable information to transcriptome studies and such strategy is partic- ularly advisable in WB- based approaches.
A potential drawback of our research is related to the average long- standing disease duration of enrolled patients and the lack
of a prospective evaluation. Caution should be exercised in trans- lating our findings to early dcSSc subjects. Overall, our results are hardly comparable with findings from studies involving patients with low- disease duration, analysing other biosamples or relying on different analytical platforms (all reviewed in previous work8).
Summarising, we extensively describe modification of RNA transcripts and related annotations with functional, patho- physiological and therapeutic implications. We show that these modifications are context and population dependent although reproducible across samples with different genetic background and phenotype. Further studies are, however, required to learn to what extent our findings can be translated in non- Caucasian populations.
Author affiliations
1scleroderma Unit, referral center for systemic autoimmune Diseases, Fondazione irccs ca’ Granda ospedale Maggiore Policlinico di Milano, Milan, italy
2GenYo, centre for Genomics and oncological research Pfizer, University of Granada, andalusian regional Government, PTs GranaDa, Granada, spain
3Department of clinical sciences and community Health, University of Milan, Milan, italy
4Klinik und Poliklinik für Dermatologie und Venerologie, Uniklinik Köln, Köln, Germany
5Division of rheumatology, University Hospitals leuven and skeletal Biology and engineering research center, KU leuven, leuven, Belgium
6Department of autoimmune Diseases, Hospital clínic, institut d’investigacions Biomèdiques august Pi i sunyer (iDiBaPs), Barcelona, spain
7Department of rheumatology and immunology, University of szeged, Faculty of Medicine, szeged, Hungary
8servicio de reumatologia, Hospital Universitario reina sofía, instituto Maimónides de investigación Biomédica iMiBic, córdoba, spain
9serviço de imunologia eX- cicaP, centro Hospitalar e Universitário do Porto, Porto, Portugal
10UMr1227, lymphocytes B et autoimmunité, Université de Brest, inserm, labex iGo, Brest, France
11rheumatology Department, cavale Blanche Hospital, Brest, France
12immunology & allergy, University Hospital and school of Medicine (HcUGe), Geneva, switzerland
13Bayer Pharma aG, Berlin, Berlin, Germany
14Drug Discovery, Bayer aG, Berlin, Germany
15instituto de Parasitologia y Biomedicina lopez- neyra, Granada, spain Contributors lB: data analysis, study design, manuscript drafting, revision and approval. GB: data analysis, manuscript revision and approval. BV: data acquisition, manuscript revision and approval. cB: data analysis, manuscript revision and approval. nH: data acquisition, manuscript revision and approval. eDl: data acquisition, manuscript revision and approval. lK: data acquisition, manuscript revision and approval. rc: data acquisition, manuscript revision and approval.
MG: data acquisition, manuscript revision and approval. roc: data acquisition, manuscript revision and approval. ia: data acquisition, manuscript revision and approval. Dc: data acquisition, manuscript revision and approval. cc: data acquisition, manuscript revision and approval. PrecisesaDs ssc substudy group, J- oP: data analysis, manuscript revision and approval. PrecisesaDs Flow cytometry study group, ZM: data analysis, manuscript revision and approval. rl: data analysis, manuscript revision and approval. MK: data analysis, manuscript revision and approval. Mea- r: study design, data analysis, manuscript revision and approval. JM:
study design, data analysis, manuscript revision and approval.
Funding This work was supported by eU/eFPia/innovative Medicines initiative Joint Undertaking PrecisesaDs Grant no. 115 565.
Competing interests none declared.
Patient and public involvement Patients and/or the public were not involved in the design, or conduct, or reporting or dissemination plans of this research.
Patient consent for publication not required.
ethics approval The study (PrecisesaDs cross- sectional cohort) was approved by the following ethic committees (including those for the author listed as collaborators in the supplemental Material): comitato etico area 2 (Fondazione irccs ca’ Granda ospedale Maggiore Policlinico di Milano and University of Milan);
approval no. 425bis nov 19, 2014, and no. 671_2018 sep 19, 2018; Klinikum der Universitaet zu Koeln, cologne, Germany. Geschaftsstelle ethikkommission; Pôle de pathologies rhumatismales systémiques et inflammatoires, institut de recherche expérimentale et clinique, Université catholique de louvain, Brussels, Belgium.
comité d’Èthique Hospitalo- Facultaire; University of szeged, szeged, Hungary.
csongrad Megyei Kormanyhivatal; Hospital clinic i Provicia, institut d’investigacions Biomèdiques august Pi i sunyer, Barcelona, spain. comité Ética de investigación clínica del Hospital clínic de Barcelona. Hospital clinic del Barcelona; servicio andaluz de salud, Hospital Universitario reina sofía córdoba, spain. comité de Ética e la investigación de centro de Granada (cei – Granada); centro Hospitalar do Porto, Portugal. comissao de ética para a saude – ces do cHP; centre Hospitalier Universitaire de Brest, Hospital de la cavale Blanche, avenue Tanguy Prigent 29609, Brest, France. comite de Protection des Personnes ouest Vi; Hospitaux Universitaires de Genève, switzerland. Deas – commission cantonale d’ethique de la recherche Hopitaux universitaires de Geneve ; andalusian Public Health system Biobank, Granada, spain; Katholieke Universiteit leuven, Belgium. commissie Medische ethiek UZ KU leuven /onderzoek; charite, Berlin, Germany. ethikkommission; Medizinische Hochschule Hannover, Germany. ethikkommission.
Provenance and peer review not commissioned; externally peer reviewed.
data availability statement Data are available on reasonable request. raw data are property of the PrecisesaDs consortium and protected under the european General Data Protection regulation (GDPr). Metadata and aggregated processed data are available on reasonable request to the authors and from the eGa (european Genome- phenome archive).
Open access This is an open access article distributed in accordance with the creative commons attribution non commercial (cc BY- nc 4.0) license, which permits others to distribute, remix, adapt, build upon this work non- commercially, and license their derivative works on different terms, provided the original work is properly cited, appropriate credit is given, any changes made indicated, and the use is non- commercial. see: http:// creativecommons. org/ licenses/ by- nc/ 4. 0/.
OrCId id
lorenzo Beretta http:// orcid. org/ 0000- 0002- 6529- 6258 RefeRences
1 Denton cP, Khanna D. systemic sclerosis. Lancet 2017;390:1685–99.
2 Korman B. evolving insights into the cellular and molecular pathogenesis of fibrosis in systemic sclerosis. Transl Res 2019;209:77–89.
3 Volkmann er, Varga J. emerging targets of disease- modifying therapy for systemic sclerosis. Nat Rev Rheumatol 2019;15:208–24.
4 acosta- Herrera M, lópez- isac e, Martín J. Towards a better classification and novel therapies based on the genetics of systemic sclerosis. Curr Rheumatol Rep 2019;21:44.
5 Zuo X, Zhang l, luo H, et al. systematic approach to understanding the pathogenesis of systemic sclerosis. Clin Genet 2017;92:365–71.
6 Tsou P- s, sawalha aH. Unfolding the pathogenesis of scleroderma through genomics and epigenomics. J Autoimmun 2017;83:73–94.
7 Fernández- ochoa Álvaro, Quirantes- Piné r, Borrás- linares i, et al. Urinary and plasma metabolite differences detected by HPlc- esi- QToF- Ms in systemic sclerosis patients.
J Pharm Biomed Anal 2019;162:82–90.
8 assassi s, Mayes MD. What does global gene expression profiling tell us about the pathogenesis of systemic sclerosis? Curr Opin Rheumatol 2013;25:686–91.
9 Denton cP, ong VH, Xu s, et al. Therapeutic interleukin-6 blockade reverses transforming growth factor- beta pathway activation in dermal fibroblasts:
insights from the fasscinate clinical trial in systemic sclerosis. Ann Rheum Dis 2018;77:1362–71.
10 Messemaker Tc, chadli l, cai G, et al. antisense long non- coding rnas are Deregulated in skin Tissue of Patients with systemic sclerosis. J Invest Dermatol 2018;138:826–35.
11 Hudson M, Bernatsky s, colmegna i, et al. novel insights into systemic autoimmune rheumatic diseases using shared molecular signatures and an integrative analysis.
Epigenetics 2017;12:433–40.
12 Moreno- Moral a, Bagnati M, Koturan s, et al. changes in macrophage transcriptome associate with systemic sclerosis and mediate GsDMa contribution to disease risk.
Ann Rheum Dis 2018;77:596–601.
13 Mariotti B, servaas nH, rossato M, et al. The long non- coding rna nrir drives iFn- response in monocytes: implication for systemic sclerosis. Front Immunol 2019;10:100.
14 Wang Z, Gerstein M, snyder M. rna- seq: a revolutionary tool for transcriptomics. Nat Rev Genet 2009;10:57–63.
15 Hoffman rW, Merrill JT, alarcón- riquelme MMe, et al. Gene expression and pharmacodynamic changes in 1,760 systemic lupus erythematosus patients from two phase iii trials of BaFF blockade with Tabalumab. Arthritis Rheumatol 2017;69:643–54.
16 Bondar G, cadeiras M, Wisniewski n, et al. comparison of whole blood and peripheral blood mononuclear cell gene expression for evaluation of the perioperative inflammatory response in patients with advanced heart failure. PLoS One
2014;9:e115097.
17 conesa a, Madrigal P, Tarazona s, et al. a survey of best practices for rna- seq data analysis. Genome Biol 2016;17:13.
18 Yang X, regan K, Huang Y, et al. single sample expression- anchored mechanisms predict survival in head and neck cancer. PLoS Comput Biol 2012;8:e1002350.
19 lim s, lee s, Jung i, et al. comprehensive and critical evaluation of individualized pathway activity measurement tools on pan- cancer data. Brief Bioinform 2018.
doi:10.1093/bib/bby097. [epub ahead of print: 20 nov 2018].
20 chen Jl, Hsu a, Yang X, et al. curation- free biomodules mechanisms in prostate cancer predict recurrent disease. BMC Med Genomics 2013;6(suppl 2):s4.
21 Wang H, sun Q, Zhao W, et al. individual- level analysis of differential expression of genes and pathways for personalized medicine. Bioinformatics 2015;31:62–8.
22 van den Hoogen F, Khanna D, Fransen J, et al. 2013 classification criteria for systemic sclerosis: an american college of rheumatology/european league against rheumatism collaborative initiative. Ann Rheum Dis 2013;72:1747–55.
23 U.s. national library of Medicine. available: https:// clinicaltrials. gov/ ct2/ show/
ncT02890134 [accessed 4 Feb 2020].
24 Babraham Bioinformatics. available: https://www. bioinformatics. babraham. ac. uk/
projects/ fastqc/ [accessed 4 Feb 2020].
25 Martin M. cutadapt removes adapter sequences from high- throughput sequencing reads. EMBnet J 2011;17:10–12.
26 Dobin a, Davis ca, schlesinger F, et al. sTar: ultrafast universal rna- seq aligner.
Bioinformatics 2013;29:15–21.
27 li B, Dewey cn. rseM: accurate transcript quantification from rna- seq data with or without a reference genome. BMC Bioinformatics 2011;12:323.
28 Jamin c, le lann l, alvarez- errico D, et al. Multi- center harmonization of flow cytometers in the context of the european "PrecisesaDs" project. Autoimmun Rev 2016;15:1038–45.
29 ritchie Me, Phipson B, Wu D, et al. limma powers differential expression analyses for rna- sequencing and microarray studies. Nucleic Acids Res 2015;43:e47.
30 law cW, chen Y, shi W, et al. voom: precision weights unlock linear model analysis tools for rna- seq read counts. Genome Biol 2014;15:r29.
31 Flach Pa KM. Precision- recall- gain curves: Pr analysis done right. in: Advances in NeuralInformation processing systems. niPs, 2015: 838–46.
32 The reactome Project. available: https:// reactome. org/ download/ current/
ensembl2reactome_ all_ levels. txt [accessed 6 Jun 2019].
33 li Jc- H. effect size measures in a two- independent- samples case with nonnormal and nonhomogeneous data. Behav Res Methods 2016;48:1560–74.
34 rosenthal rrr. Essentials of behavioral research: methods and data analysis. new York: McGraw- Hill, 1984.
35 nanji aa, French sW. Dietary linoleic acid is required for development of experimentally induced alcoholic liver injury. Life Sci 1989;44:223–7.
36 lex a, Gehlenborg n, strobelt H, et al. Upset: visualization of intersecting sets. IEEE Trans Vis Comput Graph 2014;20:1983–92.
37 shen- orr ss, Gaujoux r. computational deconvolution: extracting cell type- specific information from heterogeneous samples. Curr Opin Immunol 2013;25:571–8.
38 König ir. Validation in genetic association studies. Brief Bioinform 2011;12:253–8.
39 skaug B, assassi s. Type i interferon dysregulation in systemic sclerosis. Cytokine 2019;154635:154635.
40 Uematsu s, akira s. Toll- like receptors and type i interferons. J Biol Chem 2007;282:15319–23.
41 Henderson J, Bhattacharyya s, Varga J, et al. Targeting Tlrs and the inflammasome in systemic sclerosis. Pharmacol Ther 2018;192:163–9.
42 Hafner a, Bulyk Ml, Jambhekar a, et al. The multiple mechanisms that regulate p53 activity and cell fate. Nat Rev Mol Cell Biol 2019;20:199–210.
43 Hwang Ja, Kim D, chun s- M, et al. Genomic profiles of lung cancer associated with idiopathic pulmonary fibrosis. J Pathol 2018;244:25–35.
44 nagaraja Mr, Tiwari n, shetty sK, et al. p53 expression in lung fibroblasts is linked to mitigation of fibrotic lung remodeling. Am J Pathol 2018;188:2207–22.
45 Palomino GM, Bassi cl, Wastowski iJ, et al. Patients with systemic sclerosis present increased Dna damage differentially associated with Dna repair gene polymorphisms. J Rheumatol 2014;41:458–65.
46 U.s. national library of Medicine. available: https:// clinicaltrials. gov/ ct2/ show/
ncT02370693 [accessed 4 Feb 2020].
47 li F, Jiang T, li Q, et al. camptothecin (cPT) and its derivatives are known to target topoisomerase i (Top1) as their mechanism of action: did we miss something in cPT analogue molecular targets for treating human disease such as cancer? Am J Cancer Res 2017;7:2350–94.
48 czuwara- ladykowska J, Makiela B, smith ea, et al. The inhibitory effects of camptothecin, a topoisomerase i inhibitor, on collagen synthesis in fibroblasts from patients with systemic sclerosis. Arthritis Res 2001;3:311–8.
49 lyons Pa, McKinney eF, rayner TF, et al. novel expression signatures identified by transcriptional analysis of separated leucocyte subsets in systemic lupus erythematosus and vasculitis. Ann Rheum Dis 2010;69:1208–13.
50 reyes M, Vickers D, Billman K, et al. Multiplexed enrichment and genomic profiling of peripheral blood cells reveal subset- specific immune signatures. Sci Adv 2019;5:eaau9223.