DOI: 10.1556/606.2019.14.3.5 Vol. 14, No. 3, 43–50 (2019) www.akademiai.com
SHEAR CONNECTION,
EXPERIMENTAL AND THEORETICAL RESEARCH
1 Peter MICHÁLEK, 2Ján BUJŇÁK∗
1,2 Department of Building Structures and Bridges, Faculty of Civil Engineering University of Žilina, Univerzitná 1, 010 26 Žilina, Slovakia
e-mail: 1peter.michalek@fstav.uniza.sk, 2jan.bujnak@fstav.uniza.sk
2 Faculty of Civil Engineering and Architecture, Opole University of Technology Katowicka 48, 45-061 Opole, Poland
Received 5 January 2019; accepted 21 May 2019
Abstract: The resistance of steel-concrete composite trusses is significantly influenced by shear connection producing interaction between the steel beam and concrete slab. To create the interaction between these structural parts, it is needed to prevent the relative slip at the steel- concrete interface using the shear connectors. Push-out testing can reflect the more real effect of the longitudinal force and reproduce the distribution of the shear force between the steel section and concrete slab. The finite element analysis is used in the paper to investigate numerically this structural system behavior, exploiting finite element computer procedures.
Keywords: Composite structure, Connection, Slip, Push-out testing
1. Introduction
Composite truss systems are based on the concept of composite beams. In this particular case, the steel part is substituted by trusses reducing considerably self-weight of resulting structures [1]. This efficient structural concept begins presently to be preferable mainly in the case of larger bridge spans. Even in buildings, because of advantage to place complex electrical, heating, ventilation installations, and communication settings into the free ceiling structure with unrestricted room between truss members.
∗ Corresponding Author
2. Push-out tests
The typical cross-section of the composite beam normally consists of a reinforced concrete deck joined by shear connectors to steel truss. The slab generally represents a large concrete flange width non-uniform distribution of normal bending stresses in the transverse direction due to shear longitudinal displacement. The currently applied design of composite systems is based on the effective width beff, according to the standard EN 1994-1-1 [2], EN 1994-2 [3], practically sufficiently describing the above shear lag effect. For assuring connection of the steel beam and concrete slab, various types of shear connectors are used. In the case of truss beam, they are typically located essentially in the nodes of upper chords. This discrete connector distribution can result to different transfer in special way and usually may represent a critical design task [4].
Appropriate solution requires identifying corresponding shear resistance as well as load and slipping relationship as the key design characteristics.
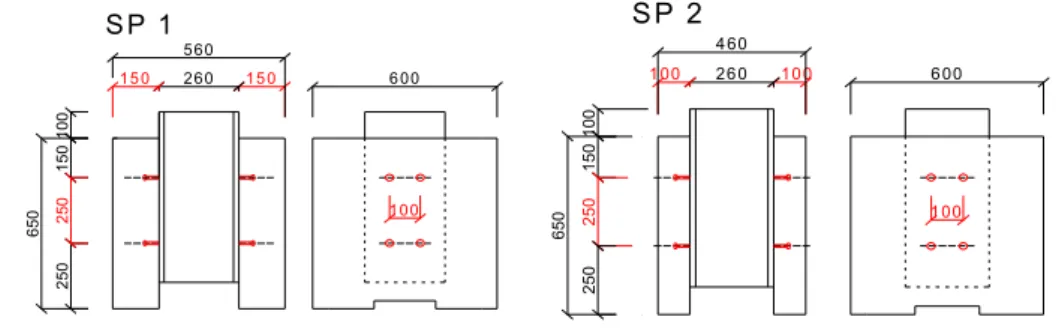
Connection using steel studs is actually the most common mode of the concrete slab joining to the upper chord of a truss. A real behavior of this connection type has been initially investigated experimentally. The standard push-out test specimens according to EN 1994-1-1 [2] were prepared, since this testing process can provide necessary input data by simple and rather straightforward way. As it can be seen in Fig. 1 - Fig. 5, the specimens consisted of a steel profile HEB 260 and two identic adjacent slabs 650 mm long and 600 mm wide of concrete strength C 25/30. The round studs of the structural steel grade S 235J2 with 10 mm in diameter and 50 mm height were used as shear connectors. Five similar specimens grouped as SP1 to SP5 were tested. The first two sets SP1 and SP2 had only four headed studs on each of both steel-concrete interfaces, 100 mm horizontally and 250 mm vertically spaced as it is shown in Fig. 1 and Fig. 2.
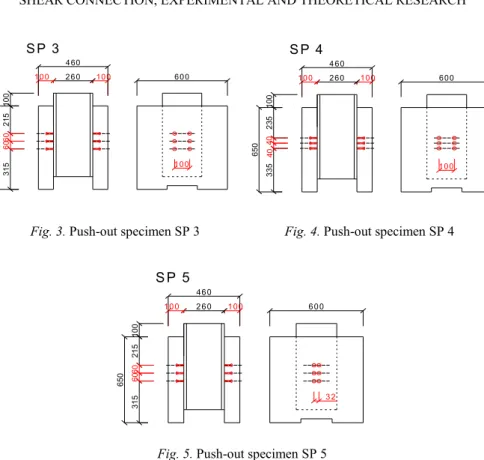
But the slab thickness varied. It was 150 mm thick for SP1 specimen and only 100 mm in the case of SP2. The following three specimen groups SP3 to SP5 had concrete slabs 100 mm thick connected by six shear studs of different spacing values according to Fig. 3, Fig. 4 and Fig. 5.
Fig. 1. Push-out specimen SP 1 Fig. 2. Push-out specimen SP 2
1 0 0
S P 1
1 5 0 2 6 0 1 5 0
5 6 0
6 0 0
150250100
650 250
S P 4
150250250100
650
S P 2
1 0 0 1 0 0
2 6 0 1 0 0
4 6 0
6 0 0
Fig. 3. Push-out specimen SP 3 Fig. 4. Push-out specimen SP 4
Fig. 5. Push-out specimen SP 5
With regard to standard practices, the load has been applied gradually using universal testing machine (see Fig. 6), automatically collecting results and storing them in a database. In the beginning, the force increments of 20 kN were added progressively from 0 to 160 kN, i.e. up to 40% of the expected limit value. Then, the load decreasing was following to 20 kN, magnitude representing 5% of the limit failure force.
Moreover, cyclic loading 25 times repetitive between 20 kN and 160 kN succeeded.
After that, the loading, but by imposed deformation of 1 mm in time step of 2 minutes continued till the connection failure appeared.
The ultimate characteristic forces and corresponding slips for all tested specimen groups are given in Table I.
Table I
Representative load and slip values
Specimen Pu,min [kN] PRk,exp [kN] δuk [mm]
SP1 255.28 229.68 4.5
SP2 235.84 212.24 4.4
SP3 399.48 359.52 4.7
SP4 355.68 320.04 4.1
SP5 409.08 368.16 5.9
21560
1 0 0
315100
2 6 0 1 0 0
4 6 0
650
1 0 0
60
S P 3
6 0 0
23540335100
650
1 0 0
40
S P 4
1 0 0 2 6 0 1 0 0
4 6 0
6 0 0
21560
1 0 0
315100
2 6 0 1 0 0
4 6 0
650
3 2
60
S P 5
6 0 0
Fig. 6. Overall push-out test organization
Three samples from each series were completely tested. Thus, there were totally 15 push-out experimentally studied specimens and corresponding registered load-slip relationships, as it is shown in Fig. 7.
Fig. 7. Summary of experimental test results of all the 15 specimens
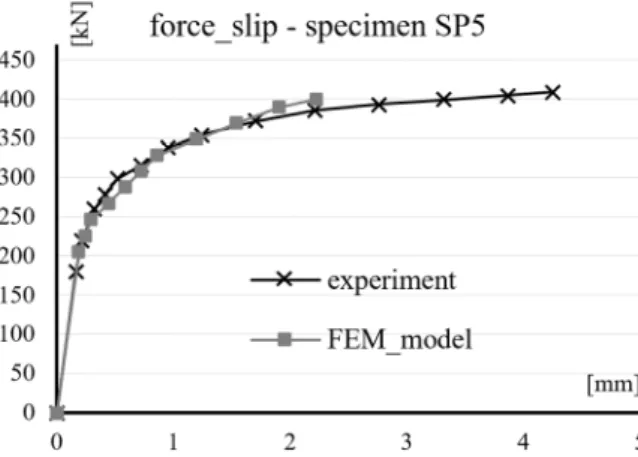
For specimens particularly of the group SP5, further studied in detail, the progressive development of this function representing average resulting values is in Fig. 8.
But the push-out testing proved to be rather challenging and time-consuming.
Therefore the development of a numerical model based on experimental data simulating connection behavior present the next theoretical part of this research [5].
Fig. 8. Example of numerical and experimental load-slip relationship of specimen SP5
3. Numerical study of push-out tests
Theoretical model of connection behavior in push-out experimental tests has been created using nonlinear analysis provided by ADINA software. This computational system offers numerous possibilities to simulate more correctly various particularities of the concrete and steel properties of composite specimens, including headed studs. Even though, shear connection modeling has required some modification to consider more appropriately real interaction at the interface of the concrete slab and steel part as the main problem of nonlinear analysis. Beside the composite action of both constitutive parts and headed studs modeling, it was necessary to include contribution effect of the contact shear surface, obviously simply neglected. This influence has been taken into account into analyses by an equivalent shear modulus representing action of an equivalent connector surrounding area, like in the study [6]. The input in the model was calibrated particularly using the test output of the push-out specimen SP5 from Fig. 8.
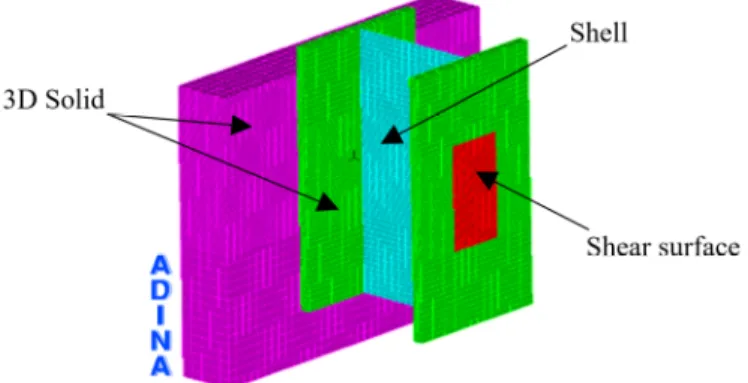
As it is illustrated in Fig. 9, the web of the steel part of a specimen could be discredited in shell-like elements. The solid space 3D iso-parametric four-node elements were used to substitute numerically the steel flanges and adjacent concrete slabs.
An action of the real group of six stud connectors surrounded by concrete might be simulated as a tapered concrete pyramid with its base length of 200 mm and 100 mm in width, as it is shown in Fig. 10.
The corresponding shearing surface would be A=100.200=20 000 mm2. Considering area of a steel connector shank of 10 mm in diameter As,1 = π D2/4 = 78.54 mm2, the entirely six studs shear surface amounts As = 6.As,1 = 471.2 mm2. With the shear steel modulus Gs = 81 000 N/mm2, shear resistance would be GsAs = 38 167 kN. The equality of the above six-stud group shear resistance gives corresponding value of the shear
modulus of the active surface in the form Gs,N = GsAs / As,1 = 1 908 N/mm2. Finally Young’s modulus can be calculated from evident relationship Es,N = Gs,N [2(1 + ν)] = 49 621 N/mm2 with Poisson’s number ν = 0.3.
Fig. 9. Final elements in the numerical model
Fig. 10. Mode of connector’s real failure and shear stud effectively cooperative composite body More significant nonlinear connection behavior due to cracking propagation in the concrete slab together with steel studs bending started evidently at the value of loading force 205 kN (see Fig. 8). Thus, the corresponding stress on the hypothetical contact surface amounts fu,N = 205/20 = 10.25 N/mm2. More accurate stress values were also calculated in the similar way for selected and immediately precedent loading stages, allowing construction of the multi-linear working diagram of the shear connection is shown in Fig. 11. More detail numerical records are given in Tab. II.
This slip-load relationship of the specimen SP5 based on the above data was determined using developed analytical model for the following gradually increasing loading up to the maximum final failure force of 409 kN. Sufficiently good agreement of experimental results with the theoretically declared values is apparent in Fig. 8. It confirms the suitability of modeling of the shear connection of concrete and steel with the alternative shear surface.
The displacements of the SP5 sample under different load ratios obtained by analytical modeling are shown in Fig. 12. The test results, especially the maximum
vertical displacements recorded by gauges placed at opposite slab surfaces reveal the symmetrical distribution. Moreover, the theoretical modeling assessed accurately even horizontal deformations, because all prediction errors fall within a very restrain interval.
Another important finding relates to the real distribution of deformations correlated to the experimental form within the load-band.
Fig. 11. Load - slip relationship of the specimen SP5 Table II
Stress - strain values of alternative shear surface fy [MPa] ε [-]
1 0.00 0.0000
2 8.50 0.0017
3 8.70 0.0040
4 9.20 0.0090
5 9.80 0.0140
6 10.25 0.0220
b) b) c)
Fig. 12. Progressive deformation of specimen SP5 at different load ratio:
a) dominantly vertical displacement at level 25%; b) even horizontal translation at level 75%;
c) final deformation at final load level 100%
Concluding remarks
In this study, connection behavior in composite trusses is investigated. For this purpose, fifteen push-out laboratory standard tests were carried out. Effect of various connector distribution and attached concrete slab parameters were researched.
Furthermore experiments are modeled by using finite element method. Steel beam and concrete slabs were modeled by appropriate elements, as a result of special examination in ADINA software system. Load-slip relationships are drawn and numerical results compared. Reasonable correlation of outputs could be generally found. Even global specimen behavior is properly simulated by developed analytical model, allowing effective and economical numerical parametrical study.
Acknowledgment
The paper presents results of the research activities supported partly by the Slovak Science Grant Agency; grant No. 1/0343/18
References
[1] Bujňák J., Perkowski Z. Performance study of composite truss, Conference Proceedings of the 4th International Conference on Contemporary Achievements in Civil Engineering, Subotica, Serbia, 22 April 2016, pp. 165‒172, http://www.gf.uns.ac.rs/, (last visited 10 November 2107).
[2] EN 1994-1-1 Eurocode 4, Design of composite steel and concrete structures, Part 1-1, General rules and rules for buildings, March 1992.
[3] EN 1994-2 Eurocode 4, Design of composite steel and concrete structures, Part 2, Bridges, July 1996.
[4] Bujňák J., Furtak K. Connection slip in composite elements under quasi-long-term actions, Pollack Periodica, Vol. 9, No. 2, 2014, pp. 29‒34.
[5] Ďuratná P., Bujňák J., Bouchaïr A. Behavior of steel-concrete composite trusses, Pollack Periodica, Vol. 8, No. 2, 2013, pp. 23‒28.
[6] Michalek P., Bujňák J., Composite truss beams experimental and theoretical research, Pollack Periodica, Vol. 13, No. 2, 2018, pp. 35–42.