Journal of Structural Geology 138 (2020) 104105
Available online 15 June 2020
0191-8141/© 2020 The Authors. Published by Elsevier Ltd. This is an open access article under the CC BY license (http://creativecommons.org/licenses/by/4.0/).
Shear strain and volume change associated with sigmoidal vein arrays in the Boda Claystone
Emese T � oth
*, Ervin Hrabovszki , Tivadar M. T oth , F � � elix Schubert
Department of Mineralogy, Geochemistry and Petrology, University of Szeged, 6722, Szeged, Hungary
A R T I C L E I N F O Keywords:
Shear zones
Sigmoidal en �echelon veins Antitaxial vein growth Mass-balance calculation Micro-computed tomography
A B S T R A C T
The Boda Claystone Formation, a potential host rock for high-level nuclear waste in Hungary, contains numerous sigmoidal vein arrays with angular vein terminations. These veins are excellent strain markers and can be used in the interpretation of palaeo-environments. Sigmoidal vein arrays were investigated in the BAF-2 well, which penetrates the formation to depths above 900 m with nearly 100% core recovery. The veins have antitaxial growth morphologies and are filled by calcite, anhydrite and barite–celestine phases. To estimate the volume change in shear zones, we used geometric, mass-balance and density-change calculations. These methods exhibit different volume loss rates. The geometric approach indicates a large amount of volume loss, whereas the isocon method and density-change approach suggest that volume loss in the shear zones was less than 10%. We propose that the volume loss in the shear zone occurred because of tectonic compaction. Vein shapes indicate formation under compressional stress fields. Based on their intersections with other vein generations, the sigmoidal en
�echelon vein generation is determined to be one of the youngest structures in the well.
1. Introduction
Fracturing and vein formation in rock bodies provides essential in- formation for interpreting their paleo-environments and conditions of formation. Among others, sigmoidal veins are excellent strain markers with a characteristic geometry that can be used for understanding stress field and vein cementation processes (Ramsay, 1980; Ramsay and Huber, 1987; Olson and Pollard, 1991; Lisle, 2013). Sigmoidal tension gashes are S- or Z-shaped veins, occurring as arrays in which they usu- ally exhibit an en �echelon (step-like) arrangement (Fig. 1). The longitu- dinal axis of the veins is parallel to the largest principal stress (σ1), and veins are the thickest perpendicular to σ1 in the central parts before tapering towards their ends (Ramsay and Huber, 1987; Lisle, 2013).
Sigmoidal en �echelon veins are common in deformed sedimentary rocks, especially carbonates and sandstones. Their development is usually accompanied by pressure solution (Beach, 1975; Seyum and Pollard, 2016), such that pressure solution seams accumulate the relatively insoluble phases of rock material, e.g. clay minerals, graphite, iron ox- ides and hydroxides. Tectonic stylolites form almost synchronously with vein propagation in calcareous rocks, where precipitating vein-filling minerals are derived directly from the stylolite (Ramsay and Huber, 1983). Sigmoidal vein arrays frequently occur in conjugate pairs in
outcrops, where the strain rate of the two shear zones is approximately equal intensity, and the orientation of the principal axes of the stress field can be determined using these conjugate pairs. The bisector angles between conjugate pairs indicate the directions of the maximum and minimum principal stresses (Ramsay and Huber, 1987).
Several authors (Ramsay and Graham, 1970; Beach, 1975; Nicholson and Pollard, 1985; Nicholson and Ejiofor, 1987; Olson and Pollard, 1991; Nicholson, 2000; Lisle, 2013; Thiele et al., 2015) have discussed the formation mechanism of sigmoidal veins. Although many specific details remain subject to discussion, it is widely accepted that their formation is related to shear zones. According to Ramsay and Huber (1987), such veins usually occur in brittle-ductile shear zones, where continuous and discontinuous deformational features are combined.
The studied sigmoidal vein arrays are from the Late Permian Boda Claystone Formation, which is a potential host rock for high-level radioactive waste in Hungary (Konr�ad and H�amos, 2006). Samples were obtained from the BAF-2 well, which penetrated the formation to depths of more than 900 m with close to 100% core recovery; more than 200 sigmoidal vein arrays can be identified along the well.
This study aimed to present a detailed description of sigmoidal vein arrays in an uncommon host rock and estimate the amount of shear strain and volume change in shear zones along the BAF-2 well through
* Corresponding author.
E-mail address: tothemese@geo.u-szeged.hu (E. T�oth).
Contents lists available at ScienceDirect
Journal of Structural Geology
journal homepage: http://www.elsevier.com/locate/jsg
https://doi.org/10.1016/j.jsg.2020.104105
Received 7 February 2020; Received in revised form 29 May 2020; Accepted 29 May 2020
the application of three approaches: geometric, mass-balance and density-change calculations.
2. Geological setting
The Late Permian Boda Claystone Formation (BCF) is located in SW Hungary in the Mecsek Mountains. Its distribution covers approximately 150–200 km2, and its average thickness is 1000 m (Fig. 2; Konr�ad and H�amos, 2006). The BCF consists mainly of well-compacted homoge- neous reddish-brown claystones and siltstones with sandstone and dolomite interbeds. It contains predominantly albite, illite–muscovite, quartz, hematite, calcite, dolomite and chlorite mineral phases (Arkai � et al., 2000; M�ath�e, 2015). Based on its mineralogical, petrographical, geochemical and sedimentological characteristics, the depositional
environment of the formation was a shallow alkaline lake and playa mudflat that formed under arid–semiarid climate (Arkai et al., 2000; � Varga et al., 2005; Konr�ad et al., 2010; M�ath�e, 2015). Derived from illite and chlorite crystallinity, deep diagenetic to lower anchizone conditions (200 �C–250 �C) prevailed in the BCF (Arkai et al., 2000). �
Various brittle structures can be identified along the well, indicating multiple tectonic deformations. Arkai et al. (2000) conducted detailed � investigations of veins in the formation and defined examples dominated by calcite, barite–quartz–calcite, anhydrite, calcite–barite and calcite- –anhydrite precipitated from meteoric (~70 �C) and/or hydrothermal (~150 �C) parent fluids. Based on the mineralogy and microstructure of veins in the BAF-2 well, four groups of veins (branched veins, straight veins, breccia-like veins and sigmoidal veins) were defined by Hra- bovszki et al. (2017). The most characteristic feature of branched veins is the presence of wall-rock inclusions within the veins with a typical cone-in-cone geometry (VeinCIC; e.g. Cobbold and Rodrigues, 2007). The average width of the veins varies between 2 and 15 mm; they mainly consist of calcite with a significant amount of albite around the solid inclusions. Straight veins (VeinSTR) are 1–5-mm wide; the vein-filling minerals are dominantly calcite and anhydrite with elongate blocky morphology, although a small amount of barite–celestine and quartz is also present. Straight veins have syntaxial vein morphologies with several inclusion bands, indicating multiple subsequent opening events.
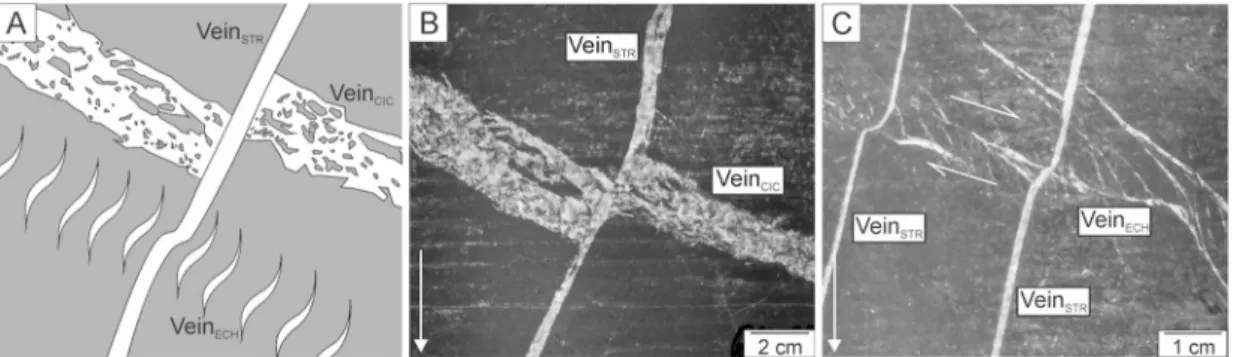
The average width of breccia-like veins is 5–12 mm (VeinBR), and these morphologies are filled with blocky calcite, fibrous quartz and minor amounts of pyrite. Calcite crystals grow on the walls, leaving open pores inside the vein. The last vein type described in the studied core material is the sigmoidal en �echelon vein (VeinECH; Hrabovszki et al., 2017). Based on the intersection of veins, a relative age relationship of each vein generation can be determined (Fig. 3). It is well documented in numerous cases that branched veins are cross-cut by straight veins and are thus older. According to Hrabovszki et al. (2017), sigmoidal veins are younger than the straight vein generation because the sigmoidal arrays offset the straight vein generation. Nevertheless, they did not observe intersections among the branched, breccia-like and sigmoidal Fig. 1.Sigmoidal en �echelon vein array in the studied claystone; sample BAF-
2_657. The horizontal arrows indicate the shear sense of the shear zone. The arrow in the lower left corner indicates the core axis and downward direction of the specimen.
Fig. 2.(A) Map showing the location of the Mecsek Mountains in Hungary. (B) Distri- bution of the Boda Claystone Formation (modified after Konr�ad and Sebe, 2010).
Legend: 1 Palaeozoic; 2 Upper Permian Boda Claystone Fm; 3 Upper Permian–Triassic K}ov�ag�oszol}os Sandstone Fm; 4 Triassic sed-} iments (sandstones, carbonates and evapo- rites); 5 Jurassic and Cretaceous sediments and Cretaceous volcanite; 6 Neogene sedi- ments; 7 fault; 8 strike-slip fault; 9 thrust fault; 10 syncline and anticline; 11 well site.
veins.
3. Samples and methods
Measurements were performed on core samples from the BAF-2 well between 500 and 667 m. The studied samples represent a ~200-m-long section within the 900-m-deep well. The numbers in the sample names denote the specimen depth. Based on macroscopic and microscopic features in the studied samples, the conditions of the vein formation in this portion of the well were similar. Consequently, each sigmoidal vein is considered to have the same formation history. For petrographic analysis of the veins, a standard polarising Olympus BX41 microscope with Olympus DP73 digital microscope camera was used. Cath- odoluminescence (CL) images were obtained using a Reliotron VII CL instrument operated at 7 kV and 0.7 mA, mounted on an Olympus BX43 microscope. Raman spectroscopy was conducted using a Thermo Sci- entific DXR Raman microscope equipped with a 532-nm wavelength Nd:
YAG laser. A laser power of 10 mW and a pinhole confocal aperture of 25 μm were used for these measurements.
To estimate the volume change effect of a geological process, the representative elementary area (REA) of the analysed system should first be identified. By definition, the REA is the smallest area above which the given petrographic parameter can be considered representative of the whole (Bear, 1972; Kanit et al., 2003).
Based on its microstructure, the studied system can be subdivided into two major domains, the wall rock and shear zone. The wall rock is undeformed, whereas the shear zone contains two further subdomains, sigmoidal veins and the rock bridges between them (Fig. 4). The veins and rock bridges were treated independently, such that REA was esti- mated for each of the three microdomains using density and volume change calculations.
The REA of the two major domains was determined using image analysis of micro-CT data. Micro-CT analysis was conducted on a single core sample of the BAF-2 well at 657-m depth, containing a 2-cm-wide shear zone with sigmoidal veins. Two micro-CT measurements were performed: one on a sample from the wall rock lacking veins or macroscopic inhomogeneity (BAF-2_657WR) and another on a sample from the shear zone (BAF-2_657SZ), containing both sigmoidal veins and rock bridges. The CT slices were perpendicular to the vein orientation, facilitating the simultaneous visualisation of both bridges and veins in one slice. Micro-CT scans used a Bruker Skyscan 2211 cone-beam scanner with X-ray source settings as follows: 168-kV source voltage, 50-μA source current and 50-ms exposure time for each measurement.
The voxel size of the dataset was 11 �11 �11 μm3. CT was used to determine Hounsfield Units (HU), numerical data presenting a linear correlation with material density over limited density intervals (Kawa- mura, 1990; Guntoro et al., 2019).
The REA was determined via image analysis using the ImageJ soft- ware on 16-bit greyscale CT images. To achieve this, squares of
gradually increasing size were chosen by a random sampler macro (Appendix A), and the average colour value of each square was computed. The sizes of the squares were between 2 and 250 pixels, and the pixel size was 11 μm. Variation coefficients (the ratio of mean and standard deviation) of the colour values of the squares were determined, and the REA was defined as the pixel size where this value reaches a threshold (in the present case, 0.05). All further investigations were conducted on REA-sized portions of the samples.
The strain analysis of the shear zone was conducted using three different methods. Based on Lisle (2013), both the shear strain and volume change of a shear zone can be determined by the geometry of sigmoidal veins. The sigmoidal shape of veins can develop in two ways according to the passive rotation and folded bridge models (Lisle, 2013).
These models provide different approaches to calculating shear strain and volume change.
According to the passive rotation model, the curvature of the vein is produced by heterogeneous strain within the shear zone; therefore, different segments of the tension gash rotate differently. The final orientation of the tension gash depends on both the initial orientation of the vein and the strain accumulated since the propagation of the tension gash (Beach, 1975; Lisle, 2013). In the case of isochoric (constant vol- ume) simple shear, the expected initial orientation of the veins is 45� with respect to the shear zone boundary (Ramsay and Huber, 1987). If volume change accompanies shear strain, this angle could be lower or higher, resulting in a positive or a negative volume change (Ramsay and Graham, 1970; Lisle, 2013).
Fig. 3.(A) Intersection geometry of the VeinCIC, VeinSTR and VeinECH generations. (B) The oldest vein generation is VeinCIC, which is penetrated by the VeinSTR
generation in sample BAF-2_662. (C) VeinSTR is sheared by VeinECH in sample BAF-2_667. There is no evidence for the intersection between the VeinCIC and VeinECH
generations in the studied core samples. The arrow in the lower left corner indicates the core axis and the downward direction.
Fig. 4. Domains of the studied system; the two major domains are the wall rock and the shear zone. The shear zone contains two subdomains, the veins and their intervening rock bridges.
The application of this model requires the use of two differently oriented passive line markers deformed by the shear zone (Fig. 5) to calculate shear strain and volume change following the method described by Ramsay (1980). Shear strain (Eq. (1)) and the volume change (Eq. (2)) can be estimated as follows (Ramsay, 1980):
γ¼cotα’cotβ cotβ’cotα
cotα’ cotβ’ (1)
1þΔ¼ cotα cotβ
cotα’ cotβ’ (2)
where α is the original orientation of the tension gash, and α0 is the deformed orientation (Fig. 5). The original fracture orientation, α, can be estimated from the orientation of the gash tip at the edge of the shear zone. β and β0are the initial and the deformed orientations of the passive line marker, respectively (Fig. 5; Ramsay, 1980; Lisle, 2013).
The folded bridge model considers the mechanical strength of the rock bridges between veins. The curved shape of the vein forms during dilatation of the gash and is influenced by the mechanical competence of the rock bridges. The strain rate of the shear zone can be determined by measuring the displacement of points along the shear zone boundary. In this approximation, dx is the component parallel to the shear zone boundary, giving simple shear, whereas dy is the boundary-normal component, indicating the volume change of the shear zone (Fig. 5).
Dividing dx and dy by the original width of the zone gives Dx and Dy, respectively (Lisle, 2013). Finally, according to the folded bridge model, shear zone displacement can be obtained using an eight-step algorithm (for details, see Lisle, 2013). This method requires the orientation data α and α’ for sigmoidal veins (denoted as above).
The geometric analysis of the shear zones was conducted on core scanner images of samples BAF-2_662 and BAF-2_667, and the width of the investigated shear zones was approximately 5 mm in both cases.
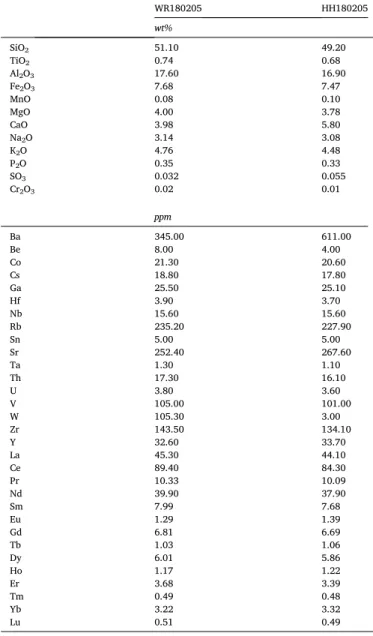
Mass-balance calculations were applied using the bulk rock chemical composition of two portions of a single sample (BAF-2_500). One part represents the wall rock without any visible inhomogeneity, and another represents the shear zone, which contains sigmoidal veins and inter- vening rock bridges. Each sample has a weight of 60 g. The bulk rock chemical analysis was conducted by the Bureau Veritas Mineral Labo- ratories, Canada, using the LF100 and XF702 analysis packages, and the whole-rock chemical data are presented in Table 1.
The density of the investigated sample (BAF-2_500) was determined to be the average of two independent measurements using the water displacement method. Prior to measuring their weight and volume, samples were coated with impermeable masking fluid to prevent water infiltration during measurement.
The composition and volume relationship of the metasomatic alter- ation process was considered by Gresens (1967), who defined equations for calculating gains and losses from chemical analyses. Using Gresens’ (1967) method, the interrelationships of volume change, composition and density can be traced between altered and unaltered varieties of the same rock type using the following equation:
Δmi¼ fvðρa=ρ0ÞCia–C0i (3) where Δmi is the mass change in component i, fv is the volume factor, the ratio of the final volume to the initial volume, ρ0 and ρa represent the original and altered rock densities and Cai and C0i are the initial and final concentrations of component i. Moreover, fv ¼ 1 indicates constant volume during the alteration process, fv <1 indicates volume loss and fv
>1 indicates volume gain (Gresens, 1967).
During the alteration, some elements are likely to become immobile
Fig. 5. Position of α, α0and β, β0in the shear zone. α and α0are the initial and deformed tension gash orientations, β and β0are the initial and deformed vein orientations (β’ is the acute angle between the tangent of the inflexion point of the sheared vein and shear zone boundary), and dy and dx are the dilatational and lateral components of shear zone displacement. Li indicates the initial length of the vein. Modified from Lisle (2013).
Table 1
Bulk chemical composition of the wall rock (WR180205) and the shear zone (HH180205).
WR180205 HH180205
wt%
SiO2 51.10 49.20
TiO2 0.74 0.68
Al2O3 17.60 16.90
Fe2O3 7.68 7.47
MnO 0.08 0.10
MgO 4.00 3.78
CaO 3.98 5.80
Na2O 3.14 3.08
K2O 4.76 4.48
P2O 0.35 0.33
SO3 0.032 0.055
Cr2O3 0.02 0.01
ppm
Ba 345.00 611.00
Be 8.00 4.00
Co 21.30 20.60
Cs 18.80 17.80
Ga 25.50 25.10
Hf 3.90 3.70
Nb 15.60 15.60
Rb 235.20 227.90
Sn 5.00 5.00
Sr 252.40 267.60
Ta 1.30 1.10
Th 17.30 16.10
U 3.80 3.60
V 105.00 101.00
W 105.30 3.00
Zr 143.50 134.10
Y 32.60 33.70
La 45.30 44.10
Ce 89.40 84.30
Pr 10.33 10.09
Nd 39.90 37.90
Sm 7.99 7.68
Eu 1.29 1.39
Gd 6.81 6.69
Tb 1.03 1.06
Dy 6.01 5.86
Ho 1.17 1.22
Er 3.68 3.39
Tm 0.49 0.48
Yb 3.22 3.32
Lu 0.51 0.49
in the system, whereas others become mobile. If immobile elements can be identified, they may be used to estimate the volume change involved in the process (Gresens, 1967; Grant, 1986). Grant (1986) provided a graphical solution to Gresens’ equations, termed the isocon method, by rearranging the equations into a linear relationship between the con- centration of a component in the original and altered rocks. Therein, elements that remain immobile must lie on a straight line through the origin, called the isochemical line or isocon (Grant, 1986; Mukherjee and Gupta, 2008; L�opez-Moro, 2012). The immobility of one or more elements is assumed as a reference frame from which the mass transfer calculations are estimated. The slope of the isocon line indicates the mass change of the alteration. Elements that are lost and gained are located below or above the isocon line, respectively (Grant, 1986).
Mass-balance modelling was performed using the Microsoft Excel spreadsheet programme EASYGRESGRANT (L�opez-Moro, 2012), which provides correct selection of immobile elements, volume factors, and an improved isocon diagram based on the method of Gresens (1967) and Grant (1986). The mass-balance calculation provides lists of mobile el- ements, as well as the quantity of volume, and mass change during vein formation and development processes.
The density changes of the shear zone and wall rock were also ana- lysed by evaluating the micro-CT images. The exact separation of small
rock bridges is difficult because of their size, but it is necessary for the application of the ordinary density measurement methods. Nevertheless, CT is a non-destructive procedure allowing the determination of HU values on even micrometre-sized rock volumes, i.e. on a single rock bridge between veins. Since average HU values correlate with density (Kawamura, 1990), manually measured density and HU data of the wall rock and the shear zone can be used for calibrating the density of the rock bridges. To do so, image analysis using the ImageJ (Schneider et al., 2012) image processing software was conducted on the CT images.
Consequently, the density of the bridges could be obtained as follows:
manually measured densities of the wall rock and shear zone, as well as the average greyscale values were calculated on the CT images of all three domains; assuming a linear correlation between greyscale value and density, the density of the rock bridge can be computed.
The microstructure of the wall rock and rock bridges were analysed by scanning electron microscopy (SEM) using a Hitachi S-4700 field emission instrument, where differences in 2D porosity, grain orientation and grain size could be identified for the two major rock domains. The element distribution maps were acquired using a BRUKER (former RONTEC) energy-dispersive device (EDS) attached to the Hitachi S-4700 € SEM. The 2D porosity of the wall rock and the rock bridges was deter- mined by image analysis using the ImageJ software on REAs, calculated
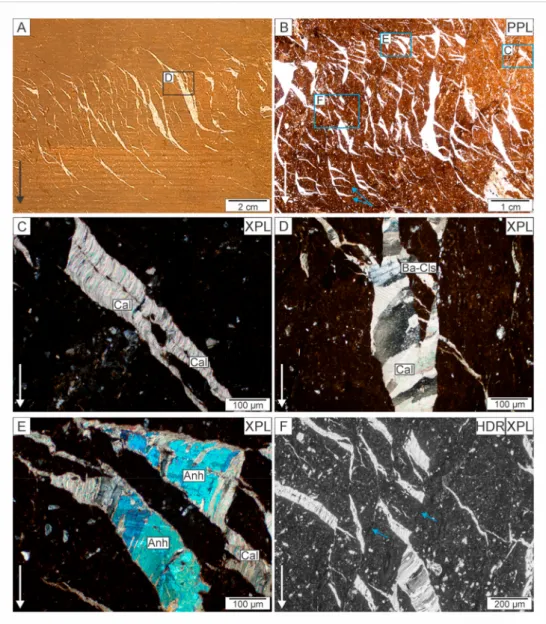
Fig. 6.Microstructure of the sigmoidal veins. (A) Shear zone with sigmoidal veins in sample BAF-2_500. (B) Vertical veins branching away from the sigmoidal vein in sample BAF-2_657; blue arrows indicate angular vein terminations. (C) Antitaxial vein with fibrous calcite vein filling in sam- ple BAF-2_657. (D) Textural appearance of barite–celestine in the vein in sample BAF- 2_500. (E) Anhydrite vein-filling fabric with small calcite crystal remnants enclosed as inclusions in sample BAF-2_657. (F) Shear planes (blue arrows) with rhombus-shaped vein segments in sample BAF-2_657. The arrows in the lower left corners of the im- ages indicate the downward direction of the core. PPL – plane-polarised light. XPL – crossed polarised light. HDR – extreme high- dynamic range image. (For interpretation of the references to colour in this figure legend, the reader is referred to the Web version of this article.)
as explained above.
4. Results
4.1. Petrography of the veins
Sigmoidal veins occur within 0.5–5-cm-wide shear zones between depths of 280–730 m in the BAF-2 well (Fig. 6A). The average thickness of veins in the cross-section varies between 0.5 and 1.5 mm, and their aperture can significantly change within one vein (Fig. 6B). CT images revealed that their 3D geometry is varied, their length spatially excee- ded the diameter of the core sample, and thicker veins often joined together with thinner ones.
The shape of the investigated veins often exhibited angular features, triangular vein terminations were common (Fig. 6A and B). Several thin planar veins branch away from veins around their tips (Fig. 6B). This vein shape was different from the typical sigmoidal geometry, which was characterised by the smooth ‘S’ shape. However, in addition to the mentioned angular vein parts, curved segments can also be observed.
The average dip of the zones, which was adjusted according to the inclination of the well, was 22�with low deviations (Hrabovszki et al., 2017). Based on the downward direction of the cores, the orientation of the vein tips, which point in the opposite direction to the shear sense, and the direction of the dip relative to the shear sense, the sigmoidal veins indicate reverse structures.
The major vein-forming minerals are calcite and anhydrite, although barite–celestine occurs in smaller quantities. In most parts, calcite has a characteristic fibrous texture with slightly curved fibres (Fig. 6C), which show only minor growth competition. As a result of minor growth competition, small widening of the fibrous crystals can be observed in the central part of the veins (Fig. 6D). The calcite phase exhibits a bright orange CL colour in all samples. Triangular terminations of the veins contain thin curved calcite fibres. In general, calcite crystals fill the veins entirely, whereas barite–celestine is observed only in the centre of the veins. Occasionally, vein-filling fibres consist of barite–celestine across the entire vein (Fig. 6D). Anhydrite occurs as relatively large mono- crystals, which also have fibrous textures, but that is less defined than in calcite (Fig. 6E). Anhydrite crystals are located in various textural po- sitions. In certain cases, they fill the majority of the veins, but elsewhere, they appear only in small quantities between fibrous calcite crystals.
Nevertheless, they regularly enclose small calcite crystal remnants (Fig. 6E). Median zones consisting of wall-rock fragments can be observed within the mineral filling of the veins (Fig. 6C). These median zones are not always located in the middle of the veins, indicating asymmetrical vein opening.
Dark fine-grained seams are discernible in the rock bridges in the thin sections (Fig. 6F). The triangular vein terminations arise from these seams, pointing opposite the shear sense. In some cases, mineral pre- cipitation occurs in rhombus-shaped cavities between the seams (Fig. 6F). These dark lines are detectable across the shear zone joining together different vein segments and could be interpreted as shear
planes. Sometimes, rock bridges in the core of the shear zone contain thin, undulated dark seams, whose orientation is different from the above-mentioned shear planes, they are perpendicular to the vein orientation. Some seam, mainly in the outer part of the shear zone enriched in Ti and Fe according to the EDS images (Fig. 7), the width range of the seams are between 20 and 40 μm. Most of the dark seams appeared in the microscopic analysis enrichment of elements and marks of pressure solution cannot be found on the SEM images.
4.2. Volume change estimations
The density and volume change of the shear zones was estimated on REA-sized segments, which significantly differ for the wall rock and shear zone. The wall rock is fine-grained, homogenous claystone; hence, the REA is relatively small for this domain. Moreover, the length of the side of the representative sampling square is ~150 μm. The REA of the shear zone is larger, around 1400 μm, due to the heterogeneity of the veins and rock bridges determined based on the CT images (Fig. 8).
4.2.1. Geometric approach
Shear zones of the BAF-2_662 and BAF-2_667 samples were analysed using Lisle’s (2013) method for calculating shear strain and the volume change of the shear zone based on the geometry of sigmoidal veins. Since the passive rotation model demands two differently oriented line markers for shear strain and volume change calculations, two samples were chosen in which sigmoidal vein arrays intersect with straight veins.
The results of shear strain and volume change calculations derived from the original and deformed orientations of the straight and sigmoidal veins according to the passive rotation and the folded bridge models shown by Toth et al. (2018) are presented in Table 2. �
Applying the passive rotation and folded bridge models to our samples, the average shear strain is found to be approximately γ ¼0.7, corresponding to intermediate shear strain. Volumetric estimations suggest a ca. 50% volume loss for both samples. These results appear unaffected by the choice of the kinematic model.
4.2.2. Mass-balance analysis
Another approach to determine the volume change of the shear zone is mass-balance analysis of the system (Gresens, 1967; Grant, 1986).
Mass-balance analysis was conducted on sample BAF-2_500, for which the average density of the wall rock is 2.53 g/cm3 and the density of the shear zone is 2.89 g/cm3; values were determined using the water displacement method. All chemical, mass and density changes of the wall rock and the shear zone were compared using the isocon method (Grant, 1986). Ti was chosen as an immobile element during the mass transfer computations. The results reveal that the shear zone became enriched in Ca, Ba, S, Sr and Mn (Fig. 9). Other major and trace ele- ments, as well as the REEs, were located near to the isocon line, sug- gesting that the deformation process caused no changes in the concentration of these elements (Fig. 9). According to these calculations, mass transfer resulted in a þ9% mass change in the shear zone. Despite
Fig. 7.Back scattered electron image and element distribution maps measured on the representative elementary area along a fine-grained seam in a rock bridge. (A) Backscattered electron image of the seam. (B) Distribution of Fe. (C) Distribution of Ti. Dashed lines indicate the border of the seam.
the positive mass change, the shear zone bore a 5% loss in volume.
4.2.3. Density-change evaluation
To study the density change, the three rock domains were analysed using micro-CT. The average grey colours of the wall rock, shear zone and rock bridges were determined and correlated with densities derived from traditional density measurements. Since micro-CT is a non- destructive method with high spatial resolution, it allows the analysis of the rock bridges alone. The density of the rock bridges is estimated at 2.76 g/cm3 based on micro-CT values (Fig. 10). Using this value, the bridges suggest a density increase of ~8% compared with the wall rock.
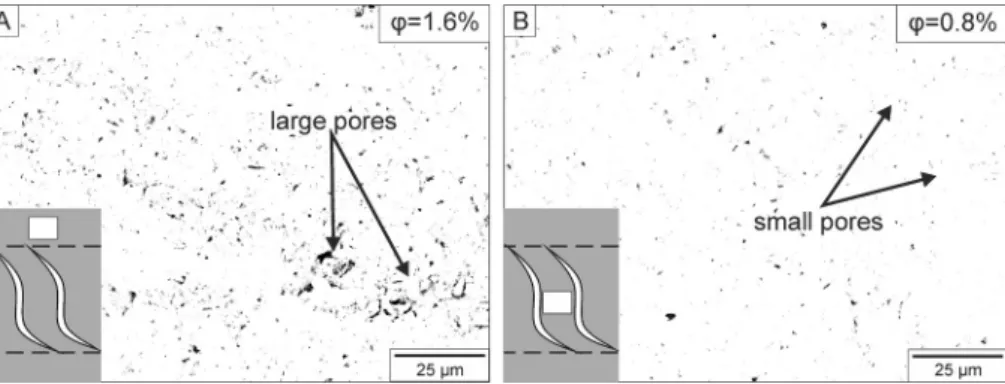
Analysis of SEM images, based on the selected REA (~4400 μm), gives 1.6% 2D porosity (ϕ) for the wall rock and 0.8% for the bridges, i.e.
a 50% loss of porosity in the bridges due to deformation (Fig. 11).
5. Discussion
5.1. Microstructure and evolution of sigmoidal veins
En �echelon veins were previously examined mostly in carbonates (Beach, 1975; Rothery, 1988; Seyum and Pollard, 2016) and sandstones (Hancock, 1972; Rickard and Rixon, 1983; Nicholson, 1991; Smith, 1995; Lisle, 2013; Thiele et al., 2015). These authors investigated the formation process of these veins and found that it was influenced by the Fig. 8. Representative elementary areas (REA) of the wall rock (A) and the
shear zone (B) determined by image analysis based on micro-CT images of different domains.
Table 2
Strain rate and volume change estimates for the shear zones in BAF-2_662 and BAF-2_667 samples based on the geometric approach (Lisle, 2013).
BAF-2_662 BAF-2_667
Passive rotation model γ ¼0.74
ΔV ¼ 49% γ ¼0.73
ΔV ¼ 57%
Folded bridge model Dx ¼0.71
ΔV ¼ 46% Dx ¼0.63
ΔV ¼ 41%
Fig. 9.Isocon analysis of the shear zone: Co, concentration for unaltered samples; Cf, concentration for altered samples. The concentration of elements located on the isocon line is unchanged, elements above the line are enriched in the altered sample, and elements under the isocon line are depleted in the altered sample. Concentrations of the major elements and elements of the rock- forming minerals are presented in the first diagram (A); concentrations of the rare-earth elements are presented in the second diagram (B). Numbers before element names are scaling factors, e.g. 2CaO.
Fig. 10.Density calculation of the rock bridges based on greyscale values of the two main domains in micro-CT images.
composition of the host rock itself through pressure solution of the rock-forming minerals. The samples analysed herein derive from the BCF; more than 200 sigmoidal vein arrays were detected in the BAF-2 well alone. They all occur in claystone, which has different rheological features from the lithologies mentioned in the above papers.
Described triangular vein terminations can be derived from different kinematics (Swanson, 1992; Willemse and Pollard, 1998; Coelho et al., 2006). We propose that the formation of the investigated vein arrays can be related to that of pennant veins (Coelho et al., 2006). Coelho et al.
(2006) described pennant veins, which have distinct triangular pennant-shaped vein terminations, and their kinematics are controlled by Riedel conjugate sets of fractures (Fig. 12). The triangular space, which is filled with minerals, is obtained by rotation and slip of the operating shear fractures.
In our case, the vein-filling calcite fibres of the triangles are curved, indicating shearing during the crystal growth (Fig. 13A inset ‘a’). The triangular terminations (Fig. 13B inset ‘b’) arise from the dark seams, which can be attributed to the localised shear planes possibly formed from initial flaws (Willemse and Pollard, 1998, Fig. 13B inset ‘c’). Be- tween these shear planes, rhombus-shaped vein segments can open (Fig. 13A inset ‘d’), during the evolution of the shear zone these vein segments and vein tips could rotate and bend (Fig. 13A inset ‘e’). Min- eral precipitation can also occur in the middle parts of the shear planes when the orientation becomes favourable for vein opening by rotation induced by the shear zone (Fig. 13B inset ‘f’). The sigmoidal shape could have been formed by the connection of these vein segments via rotation
and continuous mineral precipitation.
In our samples, the dominant vein filling of the sigmoidal veins is fibrous calcite with anhydrite and barite–celestine in minor quantities.
The fibrous morphology of the calcite and the systematic presence of the middle line in the veins indicate antitaxial vein growth morphology. No common growth competition texture is presented; therefore, crystal precipitation and fracture opening probably occurred simultaneously (Means and Li, 2001; Wiltschko, 2001; Barker et al., 2006). Crystal fibres in antitaxial veins usually follow the opening trajectory of the fracture (Bons et al., 2012). Calcite crystal habits, together with the relative positions of barite–celestine crystals, indicate that they grew simulta- neously with vein opening. Based on the habit of the anhydrite and calcite inclusions, the anhydrite phase resulted from post-kinematic replacement of the calcite phase (Fig. 6E).
The size of the shear zones, vein shape, and their shear sense relative to their dip are unified. The vein-filling sequence in each studied sigmoidal vein arrays is similar. The crosscutting relationship within the studied depth interval is uniform, and the sigmoidal vein arrays (Vei- nECH) are the youngest of the three vein generations in each situation.
Such structural inhomogeneities and fracture planes could behave as fluid migration pathways in the rock body; therefore, detailed analyses of each vein generation and recent hydrodynamic behaviour of the fracture system are essential (Gentier et al., 2000). Based on the 3D geometry of the shear zones, more evolved hydrological inter- connectivity can be achieved through these veins, which is more sig- nificant than that predicted from the cross-sectional geometry.
However, the lateral extension of the shear zones outside the well is not known.
Because sigmoidal veins with similar attributes occur throughout the depth of the well, the formation of these veins could be related to the same deformation event, which had a significant effect on the whole BCF. The shear sense of the shear zones, the direction of dip relative to the shear sense and the known upward direction of the cores suggest development during a compressional stress field. The position of the arrays relative to the bedding is unknown; nevertheless, the dip of the arrays is almost constant throughout the BAF-2 well. Thus, the forma- tion of the veins is not older than the tilting and folding of the formation caused by the prevailing compressional stress field in the Late Creta- ceous (Benkovics et al., 1997; Haas and P�ero, 2004). This event gener-� ated folds with a NE–SW axis orientation, which are characteristic in the Mecsek Mountains and accompanied by thrust faulting in the BCF (Wein, 1967; Maros et al., 2000).
5.2. Evaluation of volume change estimations
The three tested methods of volume change estimation used (the geometric approach, isocon method and density approach) exhibit significantly different rates of volume loss (Table 3). The results of the mass-balance and the density-change calculations are similar (5% and Fig. 11. Average 2D porosity (ϕ) of the representative elementary area (REA) segments of (A) the wall rock and (B) the rock bridge on binarised SEM-BSE images.
Drawings in the left corners indicate the positions of the analysed areas in the shear zone. The wall rock contains larger, connected pores, whereas the rock bridges enclose small, separate pores.
Fig. 12. Development of pennant-shaped veins controlled by R and R0Riedel fractures. These fractures rotate and slip during progressive deformation, opening pennant-shaped gaps (modified after Coelho et al., 2006).
8%, respectively); however, the geometric method suggests a signifi- cantly larger volume reduction (~50%). The reason for this difference could be related to the different principles of the three approaches. The geometric method (Lisle, 2013) was introduced on sandstones and uses exclusively vein shape parameters. Thiele et al. (2015) suggested that the effects of pressure solution within the shear zones are crucial in vein development. Along the pressure solution seams, slight rotation and slip could occur, which influence the geometry of the veins. Consequently, the veins become highly sigmoidal without substantial rotation or bending; therefore, if pressure solution was active then the volume change and strain calculations based on the geometry of the veins will overestimate (Thiele et al., 2015).
While pressure solution is an important process in sandstones (Toussaint et al., 2018), its role is less critical in claystones because of their poor solubility under low-temperature physicochemical conditions (Rutter, 1983). In the BAF samples seams frequently appear as thin dark-coloured lines under a polarising microscope in the rock bridges in two orientations. One of them, which the triangular and rhombus-shaped vein segments arise from, possibly represent shear planes (DSSP) according to the evolution of pennant-shaped veins (Coelho et al., 2006). Element enrichment and marks of pressure solu- tion cannot be traced in the SEM images. The other group of dark seams (DSPS), which are perpendicular to the vein orientation, show enrich- ment of certain elements (Fe, Ti) based on EDS images. As pressure so- lution can be observed along certain dark seams only, we suppose that the effect of pressure solution along the shear zone was subordinate.
Additionally, the reduced effect of pressure solution is confirmed by the fact that the mass-balance calculations did not show any element depletion in the shear zone.
Our calculations suggest that the application of the geometric approach in rock types for which rheological and petrophysical prop- erties are different from those typical in sandstones (siltstones and claystones in the present case) leads to an unrealistic result (~50%).
Moreover, the proposed vein formation process namely, the pennant- shaped vein forming mechanism significantly differs from those, which are responsible for the development of regular tension gashes.
Thus the volume change and strain calculations based only on the
geometric approach may provide misguided results.
According to the coinciding results of two other volume change estimations–the isocon method and the density approach–the shear zones underwent a low-rate volume loss. Based on the isocon method, despite the volume loss of the shear zone, its mass increased. Assuming Ti as immobile for the isocon calculation (Maclean and Kranidiotis, 1987; Gong et al., 2016), the shear zone became enriched in Ca, Mn, Ba, Sr and S relative to the undeformed host rock (Table 3.). All other studied elements behaved in an immobile manner. Considering the mineralogical composition of the veins, the increase in Ca probably derived from the calcite and anhydrite, whereas the minor amount of barite–celestine vein-fillings was responsible for the increases in Ba and Sr concentration. Most probably S gain derived from sulphate phases, anhydrite, barite and celestine. The cathodoluminescent activity of the calcite phase confirms the Mn content of the calcite (Gotze, 2012). All € precipitating mineral phases may have been responsible for the mass increase observed in the shear zone, although the shear zone carries 5%
volume loss. Therefore, the rate of volume loss in the shear zone must have been higher than the overall volume gain caused by the vein formation.
Based on the above calculations, the evolution of the shear zone can be divided into three main stages. Two of these stages, namely, fracture opening and mineral precipitation inside the veins, are responsible for the increases in volume and mass, respectively. Nevertheless, since the total volume decreased along the shear zone proven by the mass-balance calculations, there must be additional processes causing volume loss.
The results of the micro-CT analyses and density calculations detailed above indicate that the density of the rock bridges is signifi- cantly higher than that of the wall rock (2.76 and 2.53 g/cm3, respec- tively), suggesting different mineralogies and/or porosities and/or chemical compositions in the two domains.
The rock bridges show ~50% lower 2D porosity than the wall rock, based on SEM-BSE images (0.8% and 1.6%, respectively), which in- dicates that the volume loss of the shear zone took place in the rock bridges and occurred by porosity reduction. Considering all of these results together, we believe that tectonic compaction inside the rock bridges is an essential process for significant volume loss in the deformed portion of the studied claystone. Further processes could cause volume loss in the bridges, such as grain size reduction and reorientation of grains. Tectonic compaction caused a more significant effect on vol- ume change than fracture opening, whereas compaction and subordi- nate pressure solution was responsible for the volume decrease and fracture opening caused volume increase in the shear zone.
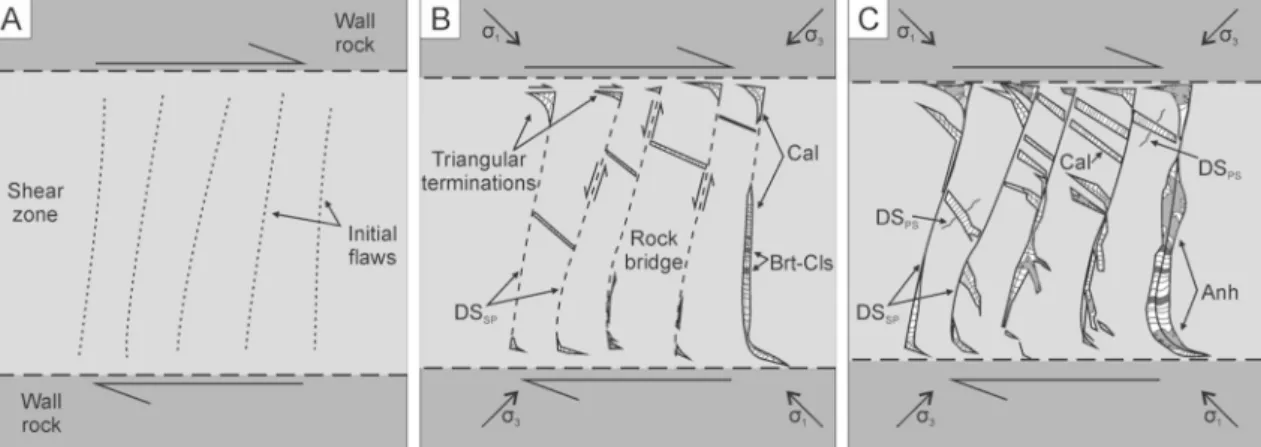
5.3. Conceptual model of the development of a shear zone in the BAF The formation of the sigmoidal vein arrays is associated with the development of shear zones. We propose that vein arrays formed from initial flaws (Fig. 14A), where pennant-shaped vein termination could form with conjugate Riedel shear fractures (Fig. 14B). The rotation and bending of these flaws resulted in the sigmoidal veins with triangular Fig. 13.Formation mechanism of the sigmoidal veins.
Shear zone in cross-polarised light (A) in sample BAF- 2_657 and (B) sample BAF-2_500. (a) Curved calcite fi- bres in the vein tips. (b) Triangular vein terminations of the veins. (c) Initial flaws, which develop to shear planes, in many cases without mineral-fillings. (d) Rhombus- shaped segments, which opened as a result of the adja- cent shear planes. (e) Tips of the veins bend as the shear zone develop. (f) Significant mineral precipitation occurs in the central part of the shear zone when their orientation became favourable for vein opening. Dashed lines indicate the shear planes. XPL – crossed polarised light.
Table 3
The observed features of the shear zones based on three different approaches.
Volume change of the shear zone
Average density
of the domains Other observations
Geometric
approach 50% – –
Mass-balance
calculation 5% Wall rock: 2.53
g/cm3 Shear zone:
2.89 g/cm3
Shear zone enriched in Ca, Mn, Ba, Sr, S Mass change þ9%
Density-change
approach 8% Rock bridge:
2.76 g/cm3 Porosity in the rock bridges is decreased by 50%
vein terminations (Fig. 14C). The evolution of the veins was accompa- nied by porosity reduction in the rock bridges. The primary, syn- kinematic vein-filling phase, mainly calcite and barite–celestine is pre- sent in minor quantities (Fig. 14B). The fibrous morphology of the calcite and middle zone of the vein indicate antitaxial vein growth. Vein- filling calcite was post-kinematically replaced by anhydrite (Fig. 14C).
6. Conclusions
Sigmoidal en �echelon arrays were examined in the Late Permian BCF, Hungary, in which more than 200 sigmoidal vein arrays were detected along the BAF-2 well, which penetrated most of the utmost thickness of the formation. The formation of these vein arrays is associated with the development of shear zones. Based on the detailed microstructural analysis, the veins are interpreted as pennant-veins, their kinematics are controlled by Riedel conjugate fractures.
Volume change of the shear zone was conducted using three different approaches, the geometric approach, mass-balance analysis and density- change approach, each of which estimated different rates of volume change. Nevertheless, the studied shear zone undoubtedly went through volume loss. The result of the geometric approach indicates a large volume loss; however, the isocon method and density approaches yield a volume loss in the shear zones of <10%. It appears that the application of the geometric approach, which considers only the shape of the veins without considering the role of other processes can lead to an unrealistic result. Therefore, we propose low rates of volume loss in the shear zones based on the results of the other two methods. Considering these ob- servations, the sigmoidal veins studied are among the youngest struc- tures of the BCF. The genesis of sigmoidal veins is not older than the tilting and folding of the formation caused by the Cretaceous compres- sion event.
Declaration of competing interest
The authors declare that they have no known competing financial interests or personal relationships that could have appeared to influence the work reported in this paper.
CRediT authorship contribution statement
Emese T�oth: Conceptualization, Writing - original draft. Ervin Hrabovszki: Writing - review & editing. Tivadar M. T�oth: Writing - review & editing, Supervision. F�elix Schubert: Supervision, Writing -
review & editing.
Acknowledgements
Access to the BAF–2 core samples was provided by the Public Limited Company for Radioactive Waste Management (RHK Kft.) and the Mec- sek�erc Zrt. Zolt�an M�ath�e is thanked for the helpful contributions for the research.
Financial support for purchasing the CT instrument was provided by the Hungarian National Research, Development and Innovation Office through project GINOP-2.3.3-15-2016-00010.
This work was supported by the University of Szeged Open Access Fund (grant number: 4608).
We thank for Samuel T. Thiele and an anonymous reviewer whose comments and suggestions helped improve and clarify this manuscript.
Appendix A. Supplementary data
Supplementary data to this article can be found online at https://doi.
org/10.1016/j.jsg.2020.104105.
References
Arkai, P., Dem� �eny, A., F�orizs, I., Nagy, G., Balogh, K., M�ath�e, Z., 2000. Composition, diagenetic and post-diagenetic alterations of a possible radioactive waste repository site: the Boda Albitic claystone formation, southern Hungary. Acta Geol. Hung. 43, 351–378.
Barker, S.L.L., Cox, S.F., Eggins, S.M., Gagan, M.K., 2006. Microchemical evidence for episodic growth of antitaxial veins during fracture-controlled fluid flow. Earth Planet Sci. Lett. 250, 331–344.
Beach, A., 1975. Geometry of en-echelon vein arrays. Tectonophysics 28, 245–263.
Bear, J., 1972. Dynamics of Fluids in Porous Media. American Elsevier Pub. Co., New York.
Benkovics, L., Mansy, J.-L., Csontos, L., Bergerat, F., 1997. Folding in the abaliget road cut (Mecsek Mountains). Acta Geol. Hung. 40/4, 425–440.
Bons, P.D., Elburg, M.A., Gomez-Rivas, E., 2012. A review of the formation of tectonic veins and their microstructures. J. Struct. Geol. 43, 33–62.
Cobbold, P.R., Rodrigues, N., 2007. Seepage forces, important factors in the formation of horizontal hydraulic fractures and bedding-parallel fibrous veins (’beef’ and cone-in- cone). Geofluids 7, 313–322.
Coelho, S., Passchier, C., Marques, F., 2006. Riedel-shear control on the development of pennant veins: field example and analogue modelling. J. Struct. Geol. 28, 1658–1669.
Gentier, S., Hopkins, D., Riss, J., 2000. Role of fracture geometry in the evolution of flow path under stress. Dynam. Fluids Fract. Rocks (122), 169–184.
Gong, Q.J., Yan, T.T., Li, J.Z., Zhang, M., Liu, N.Q., 2016. Experimental simulation of element mass transfer and primary halo zone on water-rock interaction. Appl.
Geochem. 69, 1–11.
Fig. 14. Conceptual model of the evolution of the studied shear zones. (A) Presumably, initial flaws of unknown origin are located in the shear zone. (B) During the evolution of the shear zone, triangular terminations form with Riedel conjugate fractures and the initial flaws are working as shear planes. Fibrous calcite and barite- celestine are precipitated in the veins. Parallel to the evolution of the shear zone, the porosity of the rock bridges decreases, which cause volume loss in the shear zone. (C) As a result of shear strain, the fractures rotate and buckle and that resulted in the formation of ‘S’ shape of the veins. Significant mineral precipitation occurs also in the middle part of the zone when the orientation becomes favourable for vein opening. Subsequently the vein filling sequence was partially replaced by anhydrite. DSPS- dark seams with element enrichment. DSSP – shear planes.
G€otze, J., 2012. Application of cathodoluminescence microscopy and spectroscopy in geosciences. Microsc. Microanal.: Offc. J. Microscopy. Soc. Am, Microbeam. Anal.
Soc. Micro. Soc. Canada. 18, 1–15.
Grant, J.A., 1986. The isocon diagram - a simple solution to Gresens equation for metasomatic alteration. Econ. Geol. 81, 1976–1982.
Gresens, P.L., 1967. Composition-volume relationships of metasomatism. Chem. Geol. 2, 47–65.
Guntoro, P.I., Ghorbani, Y., Koch, P.-H., 2019. Rosenkranz, J. X-ray microcomputed tomography (μct) for mineral characterization: a review of data analysis methods.
Minerals 9, 20–26.
Haas, J., P�er�o, C., 2004. Mesozoic evolution of the tisza mega-unit. Int. J. Earth Sci. 93, 297–313.
Hancock, P., 1972. The analysis of en-�echelon veins. Geol. Mag. 109 (3), 269–276.
Hrabovszki, E., T�oth, E., Raucsik, B., Varga, A., Schubert, F., 2017. Microstructure and cementation analyses on core samples from the BAF–2 well (Boda Claystone Formation, Mecsek mts). Foldtani Kozlony 147, 245 in Hungarian with English abstract.
Kanit, T., Forest, S., Galliet, I., Mounoury, V., Jeulin, D., 2003. Determination of the size of the representative volume element for random composites: statistical and numerical approach. Int. J. Solid Struct. 40, 3647–3679.
Kawamura, T., 1990. Nondestructive, 3-dimensional density-measurements of ice core samples by X-ray computed-tomography. J. Geophys. Res-Solid. 95, 12407–12412.
Konr�ad, Gy, H�amos, G., 2006. Geological aspects of determining high activity radioactive waste depository sites in Hungary and the results of the recent research. Acta Geographica ac Geologica et Meteorologica Debrecina 1, 33–38.
Konr�ad, G.Y., Sebe, K., 2010. New details of young tectonic phenomena in the Western Mecsek Mts and their surroundings. Foldtani Kozlony 140, 135–162 in Hungarian with English abstract.
Konr�ad, G.Y., Sebe, K., Hal�asz, A., Babinszki, E., 2010. Sedimentology of a permian playa lake: the Boda Claystone Formation, Hungary. Geologos 16, 27–41.
Lisle, R.J., 2013. Shear zone deformation determined from sigmoidal tension gashes.
J. Struct. Geol. 50, 35–43.
Lopez Moro, F.J., 2012. EASYGRESGRANT—a Microsoft Excel spreadsheet to quantify � volume changes and to perform mass-balance modelling in metasomatic systems.
Comput. Geosci. 39, 191–196.
Maclean, W.H., Kranidiotis, P., 1987. Immobile elements as monitors of mass-transfer in hydrothermal alteration - phelps dodge massive sulfide deposit, matagami, quebec.
Econ. Geol. 82, 951–962.
Maros, G.Y., Palot�as, K., Fodor, L., Sallay, E., R�alischn�e Felgenhauer, E., Koroknai, B., Matayiko, M., 2000. A Bodai Aleurolit Form�aci�oban M�elyült D–5 �Es D–6 Fúr�asok ImaGeo Magszkennerrel T€ort�ent Ert� �ekel�es�enek Eredm�enyei. K�ezirat, Magyar Allami � F€oldtani Int�ezet, Budapest (in Hungarian).
M�ath�e, Z., 2015. Results of Mineralogical, Petrological and Geochemical Investigation of Boda Claystone Formation. Doctoral dissertation E€otv€os L�or�and University, Budapest, Hungary, p. 130 in Hungarian with English summary).
Means, W.D., Li, T., 2001. A laboratory simulation of fibrous veins: some first observations. J. Struct. Geol. 23, 857–863.
Mukherjee, P.K., Gupta, P.K., 2008. Arbitrary scaling in ISOCON method of geochemical mass balance: an evaluation of the graphical approach. Geochem. J. 42, 247–253.
Nicholson, R., 1991. Vein morphology, host rock deformation and the origin of the fabrics of echelon mineral veins. J. Struct. Geol. 13, 635–641.
Nicholson, R., 2000. Inter-array and intra-array kinematics of en echelon sigmoidal veins in cross-bedded sandstone, Merimbula, southeastern Australia: Discussion. J. Struct.
Geol. 22, 145-145.
Nicholson, R., Ejiofor, I.B., 1987. The 3-dimensional morphology of arrays of echelon and sigmoidal, mineral-filled fractures - data from north cornwall. J. Geol. Soc.
London 144, 79–83.
Nicholson, R., Pollard, D.D., 1985. Dilation and linkage of echelon cracks. J. Struct. Geol.
7, 583–590.
Olson, J.E., Pollard, D.D., 1991. The initiation and growth of en-echelon veins. J. Struct.
Geol. 13, 595–608.
Ramsay, J.G., 1980. Shear zone geometry - a review. J. Struct. Geol. 2, 83–99.
Ramsay, J.G., Graham, R.H., 1970. Strain variations in shear belts. Can. J. Earth Sci. 7, 786–813.
Ramsay, J.G., Huber, M.I., 1983. The Techniques of Modern Structural Geology.
Academic Press, London; New York.
Ramsay, J.G., Huber, M.I., 1987. The Techniques of Modern Structural Geology: 2: Folds and Fractures. Academic Press, London; New York.
Rickard, M.J., Rixon, L.K., 1983. Stress configurations in conjugate quartz-vein arrays.
J. Struct. Geol. 5, 573–578.
Rothery, E., 1988. En-Echelon vein array development in extension and shear. J. Struct.
Geol. 10, 63–71.
Rutter, E.H., 1983. Pressure solution in nature, theory and experiment. J. Geol. Soc.
London 140, 725–740.
Schneider, C.A., Rasband, W.S., Eliceiri, K.W., 2012. NIH Image to ImageJ: 25 years of image analysis. Nat. Methods 9, 671–675.
Seyum, S., Pollard, D.D., 2016. The mechanics of intersecting echelon veins and pressure solution seams in limestone. J. Struct. Geol. 89, 250–263.
Smith, J.V., 1995. True and apparent geometric variability of en-echelon vein arrays.
J. Struct. Geol. 17, 1621–1626.
Swanson, M.T., 1992. Late Acadian-Alleghian transpressional deformation: evidence from asymmetric boudinage in the Casco Bay area, coastal Maine. J. Struct. Geol. 14, 323–341.
Thiele, S.T., Micklethwaite, S., Bourke, P., Verrall, M., Kovesi, P., 2015. Insights into the mechanics of en-�echelon sigmoidal vein formation using ultra-high resolution photogrammetry and computed tomography. J. Struct. Geol. 77, 27–44.
T�oth, E., Hrabovszki, E., Steinbach, G., Schubert, F., 2018. Quantitative estimation of shear strain and volume change using sigmoidal tension gashes. Foldtani Kozlony 148, 367–380 in Hungarian with English abstract.
Toussaint, R., Aharonov, E., Koehn, D., Gratier, J.P., Ebner, M., Baud, P., Rolland, A., Renard, F., 2018. Stylolites: a review. J. Struct. Geol. 114, 163–195.
Varga, A., Szakm�any, G., Raucsik, B., M�ath�e, Z., 2005. Chemical composition, provenance and early diagenetic processes of playa lake deposits from the Boda Siltstone Formation (Upper Permian), SW Hungary. Acta Geol. Hung. 48, 49–68.
Wein, Gy, 1967. D�elkelet-Dun�antúl hegys�egszerkezeti egys�egeinek €osszefügg�esei az oalpi � ciklusban. Foldtani Kozlony 97/3, 286–293 in Hungarian.
Willemse, E.J.M., Pollard, D.D., 1998. On the orientation and patterns of wing cracks and solution surfaces at the tips of a sliding flaw or fault. J. Geophys. Res. B 103, 2417e2438.
Wiltschko, D.V., Morse, J.W., 2001. Crystallization pressure versus "crack seal" as the mechanism for banded veins. Geology 29, 79–82.