Accepted Manuscript
Zinc-induced root architectural changes of rhizotron-grown B. napus correlate with a differential nitro-oxidative response
Gábor Feigl, Árpád Molnár, Réka Szőllősi, Attila Ördög, Kitti Törőcsik, Dóra Oláh, Attila Bodor, Katalin Perei, Zsuzsanna Kolbert
PII: S1089-8603(19)30079-5
DOI: https://doi.org/10.1016/j.niox.2019.06.003 Reference: YNIOX 1906
To appear in: Nitric Oxide Received Date: 6 March 2019 Revised Date: 27 June 2019 Accepted Date: 28 June 2019
Please cite this article as: Gá. Feigl, Áá. Molnár, Ré. Szőllősi, A. Ördög, K. Törőcsik, Dó. Oláh, A. Bodor, K. Perei, Z. Kolbert, Zinc-induced root architectural changes of rhizotron-grown B. napus correlate with a differential nitro-oxidative response, Nitric Oxide (2019), doi: https://doi.org/10.1016/j.niox.2019.06.003.
This is a PDF file of an unedited manuscript that has been accepted for publication. As a service to our customers we are providing this early version of the manuscript. The manuscript will undergo copyediting, typesetting, and review of the resulting proof before it is published in its final form. Please note that during the production process errors may be discovered which could affect the content, and all legal disclaimers that apply to the journal pertain.
M AN US CR IP T
AC CE PT ED
Zinc-induced root architectural changes of rhizotron-grown B. napus correlate with a 1
differential nitro-oxidative response 2
3
Gábor Feigl1*, Árpád Molnár1, Réka Szőllősi1, Attila Ördög1, Kitti Törőcsik1, Dóra Oláh1, 4
Attila Bodor2,3, Katalin Perei2,3, Zsuzsanna Kolbert1 5
6
1Department of Plant Biology, University of Szeged, H6726 Szeged, Közép fasor 52., 7
Hungary 8
2Department of Biotechnology, University of Szeged, H6726 Szeged, Közép fasor 52., 9
Hungary 10
3Institute of Environmental and Technological Sciences, University of Szeged, H6726 11
Szeged, Közép fasor 52., Hungary 12
13
Árpád Molnár: molnara@bio.u-szeged.hu 14
Réka Szőllősi: szoszo@bio.u-szeged.hu 15
Attila Ördög: aordog@bio.u-szeged.hu 16
Kitti Törőcsik: kittitorocsik@gmail.com 17
Dóra Oláh: olah.dora18@citromail.hu 18
Attila Bodor: bodor.attila@gmail.com 19
Katalin Perei: perei@bio.u-szeged.hu 20
Zsuzsanna Kolbert: kolzsu@bio.u-szeged.hu 21
22
*Corresponding author:
23
Gábor Feigl 24
e-mail: feigl@bio.u-szeged.hu 25
H6726 Szeged, Közép fasor 52. Hungary 26
M AN US CR IP T
AC CE PT ED
Abstract 27
28
Roots have a noteworthy plasticity: due to different stress conditions their architecture can 29
change to favour seedling vigour and yield stability. The development of the root system is 30
regulated by a complex and diverse signalling network, which besides hormonal factors, 31
includes reactive oxygen (ROS) - and nitrogen species (RNS). The delicate balance of the 32
endogenous signal system can be affected by various environmental stimuli, such as the 33
excess of essential heavy metals, like zinc (Zn). Zn at low concentration, is able to induce the 34
morphological and physiological adaptation of the root system, but in excess it exerts toxic 35
effects on plants.
36
In this study the effect of a low, growth-inducing, and a high, growth inhibiting Zn 37
concentrations on the early development of Brassica napus (L.) root architecture and the 38
underlying nitro-oxidative mechanisms were studied in a soil-filled rhizotron system.
39
The growth-inhibiting Zn treatment resulted in elevated protein tyrosine nitration due to the 40
imbalance in ROS and RNS homeostasis, however its pattern was not changed compared to 41
the control. This nitro-oxidative stress was accompanied by serious changes in the cell wall 42
composition and decrease in the cell proliferation and viability, due to the high Zn uptake and 43
disturbed microelement homeostasis in the root tips. During the positive root growth 44
response, a tyrosine nitration-pattern reorganisation was observed; there were no substantial 45
changes in ROS and RNS balance and the viability and proliferation of the root tips’
46
meristematic zone decreased to a lesser extent, as a result of a lower Zn uptake.
47
The obtained results suggest that Zn in different amounts triggers different root growth 48
responses accompanied by distinct changes in the pattern and strength of tyrosine nitration, 49
proposing that nitrosative processes have an important role in the stress-induced root growth 50
responses.
51
M AN US CR IP T
AC CE PT ED
Highlights 52
Different levels of Zn induce distinct alterations in the root growth of rapeseed 53
Low Zn supplementation changes protein nitration pattern and stimulates root growth 54
High Zn treatment increases nitrosative stress and nitration, inhibiting root growth 55
Nitrosative processes have an important role in Zn-induced root growth responses 56
57
Keywords 58
Brassica napus, zinc, root growth, nitrosative stress, nitro-oxidative stress, protein tyrosine 59
nitration 60
M AN US CR IP T
AC CE PT ED
1. Introduction 61
62
Heavy metal (HM) contamination of soils and water is an actual and growing challenge for 63
the environment and for agriculture as well. This has partly originated from anthropogenic 64
activities such as mining, waste disposal or agricultural processes for instance the excessive 65
use of fertilisers or application of sewage (Tóth et al. 2016), often causing higher Zn 66
concentration than the typical 10-300 µ g/g (ppm) in soils (Bacon and Dinev, 2005; Bi et al.
67
2006). Zinc (Zn) is the second most abundant metal in living organisms (Andreini and Bertini, 68
2009), possessing a fundamental role in diverse physiological processes. As the only metal 69
represented in all six enzyme classes (Broadley et al. 2007), Zn is involved in carbohydrate, 70
lipid and nucleic acid metabolism and protein synthesis as well. Even though it is 71
indispensable, it can be phytotoxic in amounts greater than the optimal. Zn as a non-redox 72
active element is able to tightly bind to oxygen, nitrogen or sulphur atoms, inactivating 73
enzymes by binding to their cysteine residues (Nieboer and Richardson, 1980). Zn is able to 74
promote secondary oxidative stress by the replacement of essential metal ions in catalytic sites 75
(Schützendübel and Polle, 2002). During Zn-induced oxidative stress, several reactive oxygen 76
species (ROS), like superoxide anion (O2.-
), hydrogen peroxide (H2O2), and hydroxyl radicals 77
(˙OH) are commonly generated (Morina et al. 2010; Jain et al. 2010; Gill et al. 2010). In order 78
to ensure the plants’ survival, the level of ROS has to be strictly regulated by a complex 79
mechanism (Apel and Hirt, 2004), including numerous enzymatic antioxidants such as 80
ascorbate peroxidase (APX; EC 1.11.1.11), glutathione reductase (GR; EC 1.6.4.2), catalase 81
(CAT; EC 1.11.1.6) and superoxide dismutase (SOD; EC 1.1.5.1.1), or non-enzymatic 82
antioxidants like ascorbate or glutathione.
83
In addition to ROS, reactive nitrogen species (RNS) are also being formed as the consequence 84
of many different environmental stresses. The term RNS refer to the family of nitric oxide 85
(NO) and associated molecules, including peroxynitrite (ONOO-) and S-nitrosoglutathione 86
(GSNO), (Wang et al. 2013). Nitrosative stress, analogue to oxidative stress is the 87
consequence of the accumulation of the above-mentioned molecules in the plant cells, can be 88
caused by numerous environmental factors (Corpas et al. 2007, 2011).
89
The metabolisms of ROS and RNS are connected at several points. The concept of nitro- 90
oxidative stress has only recently become the subject of research in the field of plant biology 91
(Corpas and Barrosso, 2013). A typical example of ROS-RNS crosstalk is the reaction of O2.
92
and NO resulting in the formation of ONOO-, which is accountable for post-translational 93
M AN US CR IP T
AC CE PT ED
modification protein tyrosine nitration, the covalent modification on specific tyrosines in 94
proteins forming 3-nitrotyrosine (Corpas et al. 2013). The addition of the nitro group to one of 95
the ortho carbons in the aromatic ring of tyrosine residues (Gow et al. 2004) results in steric 96
and electronic perturbations, modifying the tyrosine’s ability to keep the proper conformation 97
of the proteins or to function in electron transfer reactions (van der Vliet et al. 1999). Tyrosine 98
nitration might affect the function of the proteins in different ways: the most common 99
outcome is the loss of the protein’s function, but rarely gain of function or the lack of effect 100
has also been reported (Greenacre and Ischiropoulos, 2001; Radi, 2004, Corpas et al. 2013).
101
Moreover, tyrosine nitration is furthermore able to disturb signal transduction pathways by the 102
inhibition of tyrosine phosphorylation (Galetsky et al. 2011).
103
Due to nitro-oxidative stress and disturbances in macro- and microelement homeostasis (Jain 104
et al. 2010), excess Zn inhibits seed germination and plant growth (Mrozek and Funicelli, 105
1982; Wang et al. 2009) including root development (Lingua et al. 2008). HMs in high 106
concentration lead to growth inhibition due to their phytotoxic effect by altering the most 107
important plant physiological and metabolic processes (Kalaivanan and Ganeshamurthy, 108
2016), while on the other hand at low concentrations they are able to persuade the 109
morphological and physiological adaptation of the root system called stress-induced 110
morphogenic response (SIMR). SIMR is a special mixture of inhibition of primary root 111
growth and induction of lateral root development, resulting in a shallower but horizontally 112
more extensive root architecture, which most likely provides an enhanced stress tolerance 113
(Potters et al. 2007; Kolbert 2016). A protection machinery in contradiction of enhanced HM 114
concentrations is the modification of the cell wall in the root by the addition of e.g. callose or 115
pectin. This process can assist the survival of the plant by restraining the uptake and 116
translocation of HMs and by inhibiting the outflow of nutrients and assimilates (Sjölund, 117
1997; Chen and Kim, 2009), and at the same time cell wall alterations modify root growth 118
processes as well.
119
Tracking the growth of the root system in soil can be challenging, however number of 120
research apply rhizotrons to in situ observe root system architecture of e.g. maize (Jordan, 121
1992), trees (Pagés, 1992), Arabidopsis (Devienne-Barret et al. 2005) or Brassica napus 122
under phosphorus deficiency (Yuan et al. 2016). Rhizotrons may vary in size, depending on 123
the goal of the experiments and the investigated plant species, but in general their main 124
feature is a transparent wall ensuring the in situ monitoring of the development of plants’ root 125
M AN US CR IP T
AC CE PT ED
system. In the present study, a 15 cm wide and 30 cm tall rhizotron system was developed, 126
allowing the observation the early development of Brassica napus root system.
127
Contaminants, like Zn are able to change interactions between soil organisms (Krumins et al.
128
2015), hereby investigation of soil properties like enzyme activity can provide a more 129
complete understanding of the effect of HM stress on plant-soil system (Hagmann et al.
130
2015). There are both examples of decreased (Wang et al. 2007) and increased (Kzlkaya, 131
2004; Pascual et al. 2004) enzyme functions due to contamination with different HMs, 132
suggesting that soil microbial communities might be able to react differently to HM stress.
133
The crops’ responses in their early developmental stage basically determine their subsequent 134
development, thus studying of the zinc-induced changes in root architecture and the 135
underlying mechanisms have a great significance. In a previous study we determined that B.
136
napus is sensitive to Zn stress in a hydroponic system (Feigl et al. 2015), but no experiments 137
were conducted in the topic in a near-natural (soil filled rhizotron) setup. Therefore, our goal 138
was to compare growth-inducing and growth-inhibiting Zn concentrations in soil for Brassica 139
napus, and to determine whether if the nitro-oxidative signalling network is involved in the 140
development of these different growth responses.
141
M AN US CR IP T
AC CE PT ED
2. Materials and methods 142
143
2.1. Rhizotron system 144
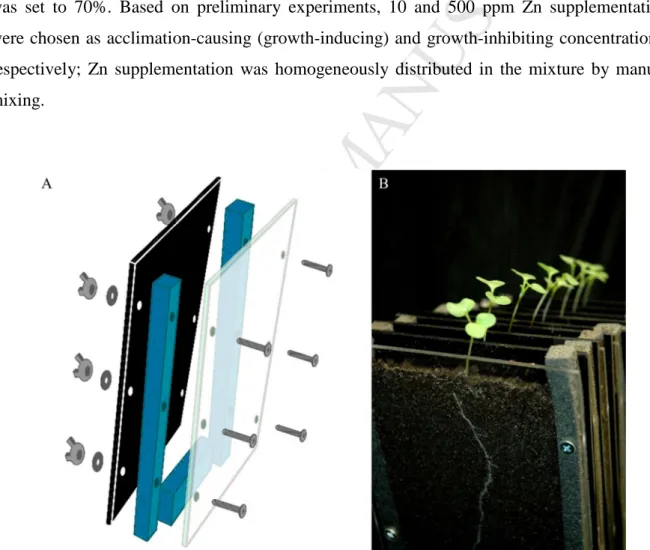
Custom-made plexi panels were assembled into 15 cm wide, 30 cm tall and 1.6 cm thick 145
rhizotrons, using polifoam sheets and screws with wing nuts. The front panel is made of 3 mm 146
thick, anti-glare, 100% transparent plastic, while the back panel is a 3 mm thick non- 147
transparent black sheet; the thickness of the soil layer inside the rhizotron was 1 cm (Fig. 1).
148
The rhizotrons were filled with Klasmann Potgrond P blocking substrate (100% frozen 149
through black peat with a fine structure of maximum 8 mm size, pH 6.0; 210 mg N/l; 240 mg 150
P2O5/l, 270 mg/l K2O, 60.21 mg/kg (ppm) Zn) mixed with 20% sand; the initial water content 151
was set to 70%. Based on preliminary experiments, 10 and 500 ppm Zn supplementation 152
were chosen as acclimation-causing (growth-inducing) and growth-inhibiting concentrations, 153
respectively; Zn supplementation was homogeneously distributed in the mixture by manual 154
mixing.
155 156
157
Fig. 1. Rhizotron design (A) and growing Brassica napus seedlings in soil-filled rhizotrons 158
(B) 159
160
2.2. Plant material and growing conditions 161
M AN US CR IP T
AC CE PT ED
Brassica napus L. (GK Gabriella; oilseed rape or rapeseed) seeds provided by the Cereal 162
Research Non-Profit Ltd. (Szeged, Hungary) were pre-germinated for 24 hours at 26°C and 163
germinated seeds were transferred to the soil surface of the pre-filled rhizotrons (one seed per 164
rhizotron, Fig 1B). During the first 48 hours after the sowing, the seedlings were covered with 165
transparent plastic foil to provide optimal humidity, then the growing plants were 166
supplemented with 10 ml distilled water on every second day. Seedlings were cultivated in 167
greenhouse at photon flux density of 150 µmol m-2 s-1 (12/12h light/dark cycle) at a relative 168
humidity of 55-60% and 25±2°C for 10 days, then the rhizotrons were scanned, disassembled 169
and the roots were cleaned for further examination. In some cases, daily scanning was also 170
performed to obtain images for the representation of the growth dynamics of the root system 171
(Supplementary video 1).
172 173
2.3. Morphological measurements 174
Scanned images of the rhizotrons were analysed using Fiji software (http://fiji.sc/Fiji;
175
Schindelin et al. 2012). The length of the primary root (PR; mm) was measured; the number 176
of visible lateral roots were counted (LR; laterals per root) and their length (mm) and angle 177
included with the vertical direction (degrees) were also measured. These data were acquired 178
from eight to ten separate generations, in each generation eight plants were examined (n=8).
179 180
2.4. Element content analysis 181
The concentrations of microelements were measured by inductively-coupled plasma mass 182
spectrometry (ICP-MS, Thermo Scientific XSeries II, Asheville, USA) according to Lehotai 183
et al. (2012). Values of Zn and other microelement concentrations (Fe, Cu, Mn, Ni, Cr, Co 184
and Mo) are given in µ g/g dry weight (DW). Bioaccumulation factor (BAF, Zn concentration 185
in the shoot/Zn concentration in the soil) and translocation factor (TF, Zn concentration in the 186
shoot/Zn concentration in the root) was calculated according to Rezvani and Zaefarian (2011).
187
This analysis was carried out twice with three samples each (n=3).
188 189
2.5. Microscopic determination of Zn distribution, callose and pectin deposition, lipid 190
peroxidation, viability and DNA replication capability in the root tissues 191
M AN US CR IP T
AC CE PT ED
For the detection of Zn uptake, root tips were washed in PBS buffer (137 mM NaCl, 2.68 mM 192
KCl, 8.1 mM Na2HPO4, 1.47 mM KH2PO4, pH 7.4), and then dyed with 25 µM Zinquin 193
(ethyl (2-methyl-8-p-toluenesulphonamido-6-quinolyloxy)acetate) in PBS for 1 h at room 194
temperature in darkness as described by Sarret et al. (2006).
195
Callose content of the root tips’ cell walls was visualised by using aniline blue staining 196
according to Feigl et al. (2015). Roots tips were dyed in aniline blue solution (0.1%, w/v in 197
1M glycine) for 5 min, then replaced by distilled water prior to microscopic analysis.
198
Cell wall pectin content was detected by using 0.05% (w/v) ruthenium red (RR) solution 199
prepared with distilled water, according to Durand et al. (2009).
200
Viability of meristematic cells in the root was determined by fluorescein diacetate (FDA) 201
staining, according to Lehotai et al. (2011); roots were dyed with 10 µ M staining solution 202
prepared in 10 mM MES (4-morpholineethanesulfonic acid) / 50 mM KCl buffer (pH 6.15).
203
FDA is a cell membrane-permeant esterase-substrate, which is widely used as a viability 204
probe, which measures enzymatic (intracellular esterase) activity (it is required to activate its 205
fluorescence) and membrane integrity (it is required for the retention of the fluorescent 206
product) (McCabe and Leaver, 2000).
207
To evaluate DNA replication prior to cell proliferation in root tips 5-ethynyl-2′-deoxyuridine 208
(EdU) was used as described by Nakayama et al. 2015 with slight modifications. Root 209
segments were incubated in 20 µM EdU solution (prepared in PBS) in darkness for 2 hours 210
followed by incubation in detergent buffer (PBS buffer pH 7.4 containing 4% formaldehyde 211
and 0,5% Triton X-100). Samples were washed tree times with PBS and incubated for 30 212
minutes in reaction buffer (40 mM ascorbate, 4.2 mM CuSO4 and 3.6 µM Alexa Fluor 488 213
azide in PBS). To determine the number of cells in which EdU incorporation has occurred in 214
the apical meristem, fluorescent cells were counted within circles of 50 µm radii. These 215
measurements were carried out twice with 10-15 samples each (n=10-15).
216 217
2.6. Detection of ROS and RNS 218
Fluorescence consistent with superoxide anion in the root tips was detected by using 219
dihydroethidium (DHE) (30 min incubation in darkness at 37°C with 10 µM dye solution 220
followed by two washing with 10 mM Tris/HCl, pH 7.4) (Pető et al. 2013). Fluorescence 221
consistent with hydrogen peroxide was detected by the incubation of root tips in 50 µM 222
M AN US CR IP T
AC CE PT ED
AmplifluTM (10-acetyl-3,7-dihydroxyphenoxazine, ADHP or Amplex Red) solution (prepared 223
in 50 mM sodium-phosphate buffer, pH 7.5), according to Lehotai et al. (2012).
224
Fluorescence consistent with NO in Brassica root tips were determined by 4-amino-5- 225
methylamino-2’,7’-difluorofluorescein diacetate (DAF-FM DA), by incubation in 10 µM dye 226
solution prepared in 10 mM Tris/HCl buffer, (pH 7.4) for 30 min in darkness at room 227
temperature (Kolbert et al. 2012). Fluorescence consistent with peroxynitrite was visualised 228
with 10 µM dihydrorhodamine 123 (DHR) prepared in Tris-HCl buffer. After 30 min of 229
incubation, root tips were washed with buffer two times (Sarkar et al. 2014).
230
These measurements were carried out twice with 10-15 samples each (n=10-15). Suppl. fig. 5 231
shows positive and negative controls for the applied fluorescent dies.
232 233
2.7. Immunofluorescent microscopic detection of 3-nitrotyrosine in root tissues 234
For immunofluorescent staining, small pieces of root samples derived from the root tips were 235
fixed in 4% (w/v) paraformaldehyde according to Barroso et al. (2006). Following fixation, 236
root samples were rinsed with distilled water and fixed in 5% agar (bacterial; Zelko et al.
237
2012 with modifications). Then 100 µm thick longitudinal sections were made using a 238
vibratome (VT 1000S, Leica).
239
Immunodetection of 3-nitrotyrosine was carried out according to Valderrama et al. (2007) as 240
described by Kolbert et al. (2018).
241
Immunofluorescent detections were carried out on two separate plant generations with 8 242
plants examined in each (n=8).
243
2.8. Acquisition and processing of microscopic images 244
Brassica root samples labelled with different fluorescent dyes were examined under a Zeiss 245
Axiovert 200M inverted microscope (Carl Zeiss, Jena, Germany). Filter set 9 (exc.: 450-490 246
nm, em.: 515- ∞ nm) was used for DHE; filter set 10 (exc.: 450-490, em.: 515-565 nm) was 247
applied for DAF-FM, DHR, FDA and FITC; filter set 20HE (exc.: 546/12, em.: 607/80) was 248
used in case of AmplexRed and filter set 49 (exc.: 365 nm, em.: 445/50 nm) was utilised with 249
aniline blue, EdU and Zinquin staining.
250
Fluorescence intensities (pixel intensity, consistent with the amount of the detected molecule) 251
in the meristematic zone were measured on the acquired images using Axiovision Rel. 4.8 252
software within circles of 50 µm radii.
253
M AN US CR IP T
AC CE PT ED
254
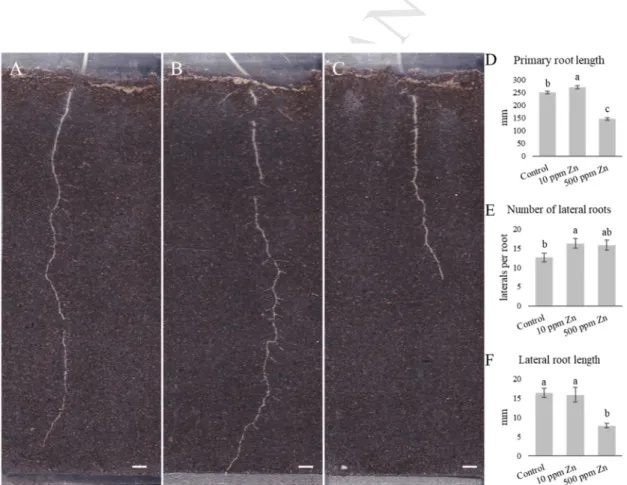
2.9. Determination of soil catalase activity 255
Activity of catalase in soil was measured by a titrimetric method according to Stępniewska et 256
al. (2009). 2 g soil from each rhizotron was added to a mixture of 40 mL distilled water and 5 257
mL 0.3% H2O2. After 20 minutes of shaking, 5 mL of 1.5 M H2SO4 was added and the 258
suspension was filtered, then titrated with 0.02 M KMnO4. Catalase activity (CAT) was 259
expressed as µmol H2O2/g dry soil weight/min calculated from the reacted amount of 0.02 M 260
KMnO4. Soil samples without H2O2 addition were used as blanks.
261
This measurement was carried out on two separate generations with 3 examined soil sample 262
each (n=3).
263 264
2.10. Measurement of root SOD activity and SOD isoform staining on native-PAGE 265
SOD (EC 1.15.1.1) activity of Brassica napus roots was determined according to (Dhindsa et 266
al. 1981), as described by Feigl et al. (2015); enzyme activity is expressed in Unit/g fresh 267
weight. SOD isoforms were detected in gels by the modified method of Beauchamp and 268
Fridovich (1971) as described by Feigl et al. (2015).
269
These experiments were carried out on two separate plant generations with three samples 270
examined each (n = 3).
271 272
2.11. NADPH-oxidase (NOX) activity of the roots on native-PAGE 273
NOX activity was examined on 10% native polyacrylamide gels by the NBT reduction 274
method of Gémes et al. (2016) with slight modifications published by Kolbert et al. (2018). 25 275
µl of protein extracts were loaded in each well.
276
These experiments were carried out on two separate plant generations with three samples 277
examined each (n = 3).
278 279
2.12. GSNOR activity on native-PAGE 280
GSNOR activity was visualized using a slightly modified method of Seymour and Lazarus 281
(1989) and is described in detail by Kolbert et al. (2018). 50 µl of protein extracts were loaded 282
in each well.
283
M AN US CR IP T
AC CE PT ED
These experiments were carried out on two separate plant generations with three samples 284
examined each (n = 3).
285 286
2.13. SDS-PAGE and western blotting for NO-Tyr and GSNOR 287
Protein extracts of Brassica napus root tissues were prepared as described in Kolbert et al.
288
(2018); protein concentration was determined using the Bradford (1976) assay with bovine 289
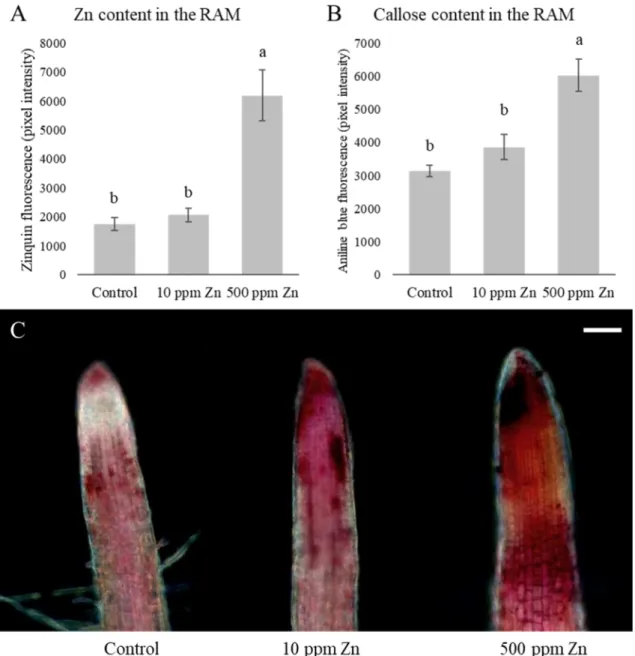
serum albumin as a standard. 20 µl of root protein extracts per lane were subjected to sodium 290
dodecyl sulphate-PAGE (SDS-PAGE) on 12% acrylamide gels, followed by procedures 291
described by Kolbert et al. (2018).
292
Immunoassay for GSNOR enzyme was performed using a polyclonal primary antibody from 293
rabbit diluted 1:2000 purchased from Agrisera (AS09 647). As secondary antibody affinity- 294
isolated goat anti-rabbit IgG–alkaline phosphatase secondary antibody (Sigma-Aldrich, cat.
295
No. A3687) was used at a dilution of 1:10000, and bands were visualized by using the 296
NBT/BCIP (nitroblue tetrazolium/5-bromo-4-chloro-3-indolyl phosphate) reaction.
297
Western blot was applied to three separate protein extracts from different plant generations, 298
multiple times per extract, giving a total of six blotted membranes (n = 3).
299
Protein bands of SOD, NOX, GSNOR enzyme and nitrated proteins were quantified by 300
Gelquant softwareprovided by biochemlabsolutions.com.
301 302
2.14. Statistical analysis 303
The results are expressed as the mean ± s.e. Multiple comparison analyses were performed 304
with SigmaStat 12 software using analysis of variance (ANOVA; P<0.05) and Duncan’s test.
305
In some cases, Microsoft Excel 2010 and Student’s t-test were used (*P≤0.05, **P≤0.01, 306
***P≤0.001).
307
M AN US CR IP T
AC CE PT ED
3. Results and discussion 308
309
3.1. Zn uptake-induced changes in root architecture, root cell wall composition and 310
microelement homeostasis 311
As previously stated, control soil contained 60 ppm total Zn, thus 10 and 500 ppm Zn 312
supplementation resulted in 70 (within the typical 10-300 ppm range) and 560 ppm (over the 313
typical range) total soil Zn content, respectively. Zn exists in five distinct pools in soils such 314
as water soluble, exchangeable, adsorbed, chelated or complexes of Zn (Noulas et al. 2018, 315
however the investigation of the form and bioavailability of the total Zn in the soil were not 316
our aim, thus were not examined. Throughout the article control refers to soil containing 60 317
ppm Zn, as provided by the manufacturer.
318
The rhizotron system allows the easy monitoring of the development of the root system 319
architecture (RSA) (Fig 2A). Compared to the control, both Zn supplementations caused 320
significant changes in the RSA (for the dynamics of RSA development see supplementary 321
video 1). Mild Zn treatment (10 ppm supplementation) induced root growth in terms of the 322
length of the primary root (107%) and number of lateral roots (129%) (Fig 2B, C), while the 323
length of lateral roots remained similar to the control (Fig 2D). On the other hand, high Zn 324
concentration (500 ppm supplementation) inhibited primary and lateral root elongation (58 325
and 48%, respectively) (Fig 2B, D), while the number of lateral roots (similar to the 10 ppm 326
supplementation) were higher than in the control (125%) (Fig 2 C). It can be noted, that due to 327
the significant shortening of the primary root under 500 ppm Zn supplementation, lateral root 328
density increased noticeably compared to control conditions (LR/cm; control: 0.5, 500 ppm 329
Zn: 1.1). In a previous, hydroponic study, lateral root number of B. juncea and B. napus was 330
also increased by Zn excess (Feigl et al. 2016); and this phenomenon is also a known 331
symptom of SIMR (Potters et al. 2009). Moreover, in Sesbania species, Zn also induced 332
lateral root formation (Yang et al. 2004). Interestingly, the angle of lateral roots relative to the 333
vertical direction also changed significantly due to Zn supplementation, but the response was 334
different depending on Zn concentrations: addition of 10 ppm Zn induced a more horizontal 335
lateral root growth (control: 65°, 10 ppm Zn 68°), while 500 ppm Zn supplementation led to a 336
more vertical (60°) lateral root orientation (Suppl. fig. 1). This contrasting response 337
corroborate the opposite effect of the two applied Zn treatment: low Zn-induced growth 338
induction is accompanied by a more horizontal root system (acclimation), while the growth- 339
inhibiting Zn concentration caused the lateral roots to grow more to the vertical direction, 340
M AN US CR IP T
AC CE PT ED
possibly as compensational reaction. According to our hypothesis, since the PR growth is 341
inhibited by 500 ppm Zn supplementation, the LRs are aiming to the deeper zones, while 342
addition of 10 ppm Zn did not inhibit PR growth and the LRs are expanding laterally, since 343
they are able acclimatise to the mild Zn treatment. Many studies discuss the regulation of root 344
angle determination by a complex series of internal and external factors (Toal et al. 2018), 345
however the existence or background of Zn-induced changes in the lateral root angle is yet to 346
be discovered.
347
According to the obtained RSA data, the two applied Zn concentrations causes two distinctly 348
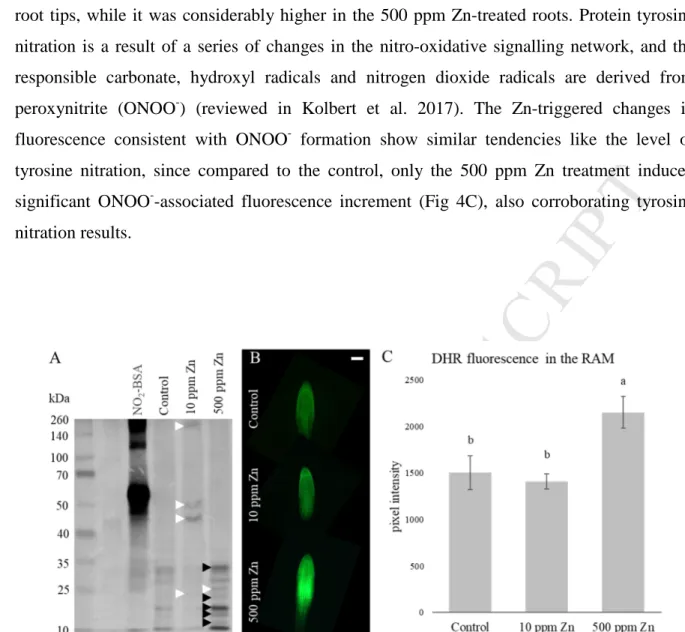
different responses: the effect of 10 ppm Zn supplementation has an overall positive 349
consequence, while 500 ppm Zn supplementation inhibits longitudinal growth (PR and LR) 350
and induces branching process at the same time. It has to be also noted that though 500 ppm 351
Zn treatment caused responses that could even meet the requirements of SIMR (Potters et al.
352
2009), however its negative, growth inhibiting effects are more pronounced.
353 354
355
Fig. 2. (ABC) Representative images of the effect of Zn on the root system architecture of 10- 356
days-old B. napus. (A – control, B – 10 ppm Zn supplementation, C – 500 ppm Zn 357
supplementation; bar=1cm). Length of the primary root (D) and the effect of Zn on the 358
number (E) and length (F) of lateral roots. Different letters indicate significant differences 359
according to Duncan-test (n=8, P<0.05).
360 361
M AN US CR IP T
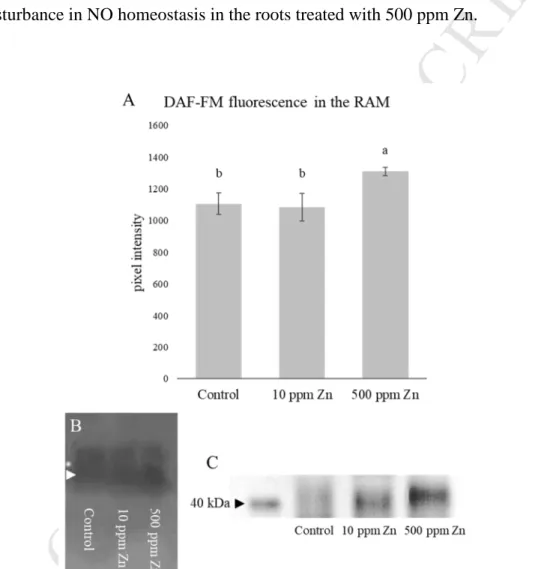
AC CE PT ED
Microscopic analysis of the Zn content in the root apical meristem (RAM) revealed that the 362
meristematic zones of plants grown in the 10 ppm Zn supplemented soil did not accumulate 363
significantly more Zn than the control, while the addition of 500 ppm Zn caused significant 364
Zn uptake (3.5-fold increase) in their root apical meristems (Fig 3A). Root cell wall 365
modifications can indicate and prevent heavy metal uptake. Callose content of the root tips 366
shows a similar tendency to the Zn contents, namely only the high Zn concentration caused 367
significant (almost two-fold, compared to the control) callose deposition (Fig 3B). Excess Zn 368
reportedly caused significant callose deposition in e.g. bean (Peterson and Rauser, 1979) and 369
B. juncea and B. napus (Feigl et al. 2015). The high amount of deposited callose might 370
contribute to growth inhibition, since it decreases cell wall loosening and inhibits symplastic 371
transport (Jones et al. 2006; Piršelová et al. 2012). Callose is not permeable to metal ions 372
(Hall, 2002), thus prevents Zn to enter the cells. On the other hand, both Zn treatments 373
increased pectin content in the root tips, providing a possible explanation how 10 ppm Zn- 374
treated root meristem is able to exclude Zn. Although, in case of 500 ppm Zn addition, RAM 375
showed more pronounced pectin staining compared to 10 ppm Zn treatment (Fig 3C). Pectin 376
is able to bind HMs in the cell walls (Krzesłowska, 2011) and the observed pectin 377
accumulation due to the 10 ppm Zn treatment could be enough to exclude Zn but probably it 378
was not sufficient against 500 ppm Zn supplementation. The observed changes in pectin and 379
callose content could complement each other: the increase of pectin may bind Zn in the cell 380
wall, and the deposited callose immobilizes it in the cell wall and ensures that it does not enter 381
the cytoplasm. The latter can contribute to the above discussed growth inhibition as well.
382
M AN US CR IP T
AC CE PT ED
383
Fig. 3. Zinc (A) and callose (B) content in the root apical meristem of 10 days-old Brassica 384
napus grown in soil-filled rhizotrons in the presence of optimal (control, 60 ppm Zn) or 385
supraoptimal (10 and 500 ppm supplementation) Zn levels. Different letters indicate 386
significant differences according to Duncan-test (n=10-15, P<0.05). (C) Representative image 387
showing the pectin-associated pink colorization in the Brassica napus root tips (bar=100µm).
388 389
According to the ICP-MS measurements Zn content of the whole root system was 390
significantly increased by both Zn treatments in a concentration dependent manner (2.8 and 391
175-fold, compared to the control) (Table 1). Additionally, Zn was translocated to the shoot in 392
a concentration-dependent manner. Bioaccumulation factor (BAF, shoot/soil concentration 393
ratio) is a suitable tool to assess the plants’ metal accumulation potential hence their 394
phytoremediation ability (Zhao et al. 2003). The BAF under control circumstances was 3.19, 395
while 10 and 500 ppm Zn treatment enhanced it to 5.32 and 4.77, respectively, proving that B.
396
M AN US CR IP T
AC CE PT ED
napus is a moderate Zn accumulator species, since in excluder plants this value is below 1 397
(Ebbs and Kochian 1997). Also, in our previous works, similar Zn accumulation tendencies 398
were observed (Feigl et al. 2015, 2016). Translocation factor (TF), as Zn concentration ratio 399
of plant shoots to roots can also be used to evaluate a species’ phytoremediation potential 400
(Yoon et al. 2006). Contrary to BAF values, TF proportionally decreased by the increasing 401
external Zn concentration (0.74; 0.51 and 0.05, respectively), indicating that though rapeseed 402
is a moderate accumulator, it’s translocation capacity is low.
403
Zn supplementation of the soil also modified the microelement homeostasis of Brassica roots.
404
Iron (Fe), cobalt (Co) and molybdenum (Mo) content of the roots decreased in a 405
concentration-dependent manner, while the decline of copper (Cu), nickel (Ni), chromium 406
(Cr) concentrations was not proportional to the increasing Zn concentration (Table 1). On the 407
other hand, manganese (Mn) content increased due to the Zn supplementation in a 408
concentration-dependent way (Table 1). There is evidence published about the crosstalk of Zn 409
and another elements like Fe, Cu and Cd, but a comprehensive evaluation is still lacking (Jain 410
et al. 2013). In Arabidopsis thaliana roots, Zn treatment caused decreased Fe and Cu content 411
(Jain et al. 2013), while in A. halleri Zn treatment reduced Ni (Zhao et al. 2001) and Mn 412
(Küpper et al. 2000) content of the roots. In the present experimental system, excess Zn 413
decreased the in planta concentrations of relevant microelements like Fe, Cu, Mo, Co, Cr thus 414
disturbing microelement homeostasis of B. napus roots which in turn may contribute to 415
growth reduction.
416 417 418 419
A Control 10 ppm Zn 500 ppm Zn
Zn root (µg/g DW) 258.7 ± 3.87 c 723.3 ± 22.15 b 45300 ± 109.6 a Zn shoot (µg/g DW) 191.8 ± 0.84 c 373 ± 2.98 b 2672 ± 32.57 a
BAF Zn 3.19 5.32 4.77
TF Zn 0.74 0.51 0.05
B Control 10 ppm Zn 500 ppm Zn
Fe root (µg/g DW) 744.9 ± 4.81 a 515 ± 4.02 b 284.9 ± 2.48 c Cu root (µg/g DW) 56.01 ± 0.95 a 9.06 ± 0.44 b 9.32 ± 0.05 b Mn root (µg/g DW) 233.5 ± 1.73 c 240.8 ± 2.06 b 322.9 ± 1.25 a Ni root (µg/g DW) 267.3 ± 1.33 a 3.93 ± 0.19 b 3.40 ± 0.13 b
M AN US CR IP T
AC CE PT ED
Cr root (µg/g DW) 23.37 ± 0.36 a 0.53 ± 0.04 b 0.74 ± 0.02 b Co root (µg/g DW) 3.04 ± 0.09 a 2.38 ± 0.03 b 0.86 ± 0.01 c Mo root (µg/g DW) 0.94 ± 0.05 a 0.85 ± 0.02 b 0.46 ± 0.02 c 420
421
Table 1. (A) Zn content of the B. napus organs and BAF/TF values. (B) Microelement content 422
of the roots (µg/g DW). Different letters indicate significant differences according to Duncan- 423
test (n=3, P<0.05).
424 425
3.2. Distinct tyrosine nitration response associated with different root architectural 426
changes 427
Protein tyrosine nitration, a posttranslational modification is observed to participate in many 428
physiological and stress-related processes (Kolbert et al. 2017) and proved to be a suitable 429
biomarker in case of Zn-stressed Brassica species in hydroponics (Feigl et al. 2015, 2016).
430
The presence of tyrosine nitration has been proved in control, healthy plants as well (Corpas 431
et al. 2013; Feigl et al. 2015; Lehotai et al. 2016). In the present experimental setup six 432
nitrated protein bands were detectable in the 35-10 kDa molecular weight zone (Fig 4A) 433
under control circumstances, proving that a physiological nitroproteome is present in soil- 434
grown roots as well. The low and high Zn concentrations caused a diverse response. 10 ppm 435
Zn supplementation caused a tyrosine nitration-pattern rearrangement: the nitration of several 436
protein bands decreased that were nitrated under control conditions, while four newly nitrated 437
protein bands appeared (approximately 250, 50, 45 and 23 kDa) (Fig 4A, white arrows). In 438
contrast, 500 ppm Zn treatment resulted in a generally increased tyrosine nitration in the 439
lower molecule weight zone (Fig 4A, same bands as in control roots, black arrows), and also a 440
newly nitrated protein band appeared (approximately 25 kDa) (Fig 4A). The existence of a 441
basal nitration state of the protein pool is observed in many species (reviewed in Kolbert et al.
442
2017), and previous studies also found that Zn induces increased tyrosine nitration in the roots 443
of B. napus (Feigl et al. 2015, 2016). The pattern and rate of tyrosine nitration however is 444
different in the present study compared to the previous results, possibly because of the 445
different experimental setup (hydroponics vs soil filled rhizotron) and applied Zn 446
concentrations.
447
We also detected protein tyrosine nitration in situ in the root tips, and the overall strength of 448
the tyrosine nitration-dependent fluorescence showed correlation with the previous results:
449
compared to the control, fluorescence did not increase significantly in the 10 ppm Zn-treated 450
M AN US CR IP T
AC CE PT ED
root tips, while it was considerably higher in the 500 ppm Zn-treated roots. Protein tyrosine 451
nitration is a result of a series of changes in the nitro-oxidative signalling network, and the 452
responsible carbonate, hydroxyl radicals and nitrogen dioxide radicals are derived from 453
peroxynitrite (ONOO-) (reviewed in Kolbert et al. 2017). The Zn-triggered changes in 454
fluorescence consistent with ONOO- formation show similar tendencies like the level of 455
tyrosine nitration, since compared to the control, only the 500 ppm Zn treatment induced 456
significant ONOO--associated fluorescence increment (Fig 4C), also corroborating tyrosine 457
nitration results.
458 459 460
461
Fig. 4. Representative immunoblot showing protein tyrosine nitration in the roots of B. napus 462
grown in soil-filled rhizotrons under control circumstances (60 ppm Zn) and Zn 463
supplementation (A). White arrows show newly nitrated protein bands while black arrows 464
show protein bands with increased nitration compared to the control (n=3). (B) 465
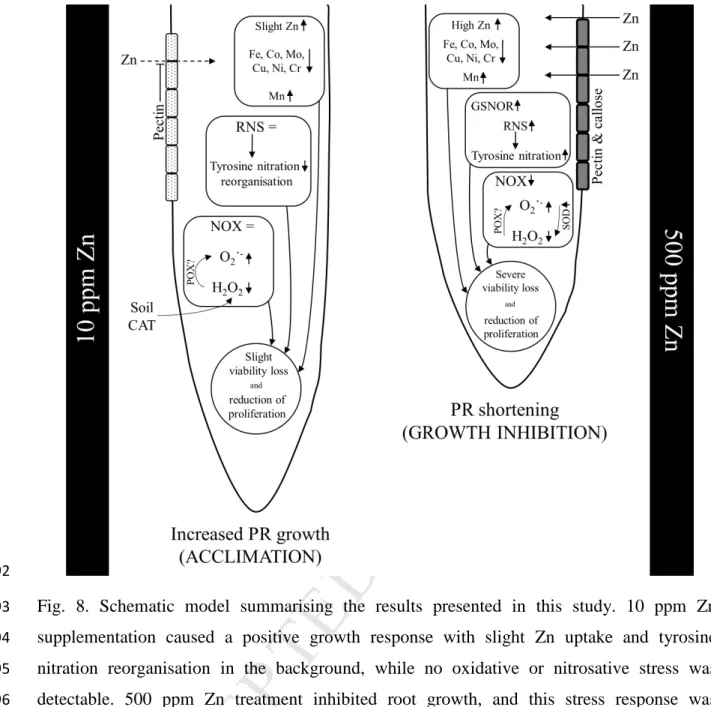
Immunolocalisation of 3-nitrotyrosine in root tips of B. napus grown in soil-filled rhizotrons 466
under control circumstances and Zn supplementation (bar=100µm). (C) Changes in the 467
fluorescence consistent with peroxynitrite in the root apical meristem of B. napus upon Zn 468
treatment. Different letters indicate significant differences according to Duncan-test (n=10-15, 469
P<0.05).
470 471
3.3. Distinctive changes in the underlying nitro-oxidative signal transduction network 472
Peroxynitrite is derived from superoxide anion and nitric oxide, thus the amount of ONOO- 473
and ultimately the appearance of tyrosine nitration depends on the production and 474
accumulation of these reactive species (Kolbert et al. 2017). Similar to ONOO-, fluorescence 475
consistent with NO formation in the root apical meristem was increased only by 500 ppm Zn 476
M AN US CR IP T
AC CE PT ED
treatment (Fig 5A). NO can be also stored in the form of S-nitrosoglutathione (GSNO), which 477
can act as a mobile NO reservoir (Begara-Morales et al. 2018). GSNO can either 478
spontaneously decompose to NO or can be enzymatically reduced by GSNOR to GSSG and 479
NH3 (Lindermayr 2018). Zn treatment, especially 500 ppm Zn supplementation, increased 480
both GSNOR enzyme activity (Fig 5C and suppl. fig. 2) and protein amount (Fig 5D), 481
however the reason behind the size-shift of the immunopositive band is yet unknown. The 482
higher NO-associated fluorescence discussed above can be related to the higher activity and 483
presence of GSNOR, which is responsible for GSNO removal, suggesting that Zn induces a 484
severe disturbance in NO homeostasis in the roots treated with 500 ppm Zn.
485 486
487
Fig. 5. Fluorescence consistent with NO formation in the root apical meristem of B. napus 488
grown in soil-filled rhizotrons containing optimal (control, 60 ppm total Zn) or supraoptimal 489
(10 ppm and 500 ppm Zn supplementation) Zn concentrations. (A). Different letters indicate 490
significant differences according to Duncan-test (n=10-15, P<0.05). Representative native- 491
PAGE (6%) of B. napus root extracts and staining for GSNOR activity (white arrow) (B).
492
Representative immunoblot showing GSNOR protein abundance in roots of control or Zn- 493
treated B. napus (C) (n=3).
494 495
M AN US CR IP T
AC CE PT ED
Besides the homeostasis of reactive nitrogen species, the balance of reactive oxygen species 496
was also changed by Zn treatment. Both Zn treatment increased the fluorescence consistent 497
with superoxide formation in the root tips, regardless of the applied concentration (Fig 6B).
498
The native-PAGE analysis of the O2˙- producing NADPH oxidase enzyme revealed five 499
isoenzymes, and the total activity of this enzyme decreased in a concentration-dependent way 500
(Fig 6A, for separate izoenzyme activities see suppl. fig. 3), suggesting that there is an another 501
source of O2˙- in the root tips, like plant peroxidases that mainly generate O2˙- through 502
oxidation of phenolic compounds (Kimura et al. 2014). Measurement of the SOD activity 503
shown increment only in case of 500 ppm Zn treatment (Fig 6C), and the native-PAGE 504
analysis of the enzyme identified that there is a rearrangement of isoenzyme activities (Fig 505
6D). While the overall SOD activity in case of 10 ppm Zn treatment did not change 506
significantly, in the background a very slight increment in the Mn and Fe-SOD isoenzyme- 507
activity could be detected (Suppl. fig. 4AB). On the other hand, in case of 500 ppm Zn 508
treatment, Fe-SOD isoenzyme activity decreased notably, while the activity of all three 509
Cu/Zn-SOD isoenzymes increased significantly (Suppl. fig. 4C). One of the reason of the 510
decreased Fe-SOD activity could be the reduced availability of iron as previously shown in 511
Table 1, while the also reduced accessibility of copper did not affect Cu/Zn-SOD activity in a 512
negative way.
513 514
515
M AN US CR IP T
AC CE PT ED
Fig. 6. (A) Native-PAGE (10%) separation of NADPH oxidase isoenzymes in the root of B.
516
napus supplemented with 10 and 500 ppm Zn, compared to the control (60 ppm total Zn).
517
Putative isoenzymes are numbered and indicated by black arrows. (B) Fluorescence consistent 518
with superoxide formation in the root apical meristem. Total superoxide dismutase activity 519
(C) and superoxide dismutase isoenzymes separated on native-PAGE (10%) (D). (E) 520
Fluorescence consistent with H2O2 formation in the root apical meristem of B. napus and (F) 521
catalase activity of the soil supplemented with 10 and 500 ppm Zn. Different letters indicate 522
significant differences according to Duncan-test (n=3 (SOD, CAT) or 10-15 (O2˙- and H2O2), 523
P<0.05).
524 525
Fluorescence consistent with hydrogen peroxide formation in the root tips decreased 526
significantly after Zn treatment, and the different amounts of supplied Zn caused different 527
responses. The H2O2-associated fluorescence of the root tips was the lowest in case of 10 ppm 528
Zn supplementation (Fig 6E); however, the activity of SOD in the roots did not explain this 529
difference. Therefore, as an interesting possibility, soil CAT activity was examined. As the 530
effect of Zn supply, the CAT activity in the soil increased significantly in case of 10 ppm Zn 531
supplementation (Fig 6F), which was accompanied by the lowest H2O2-related fluorescence in 532
the root tips, suggesting that somehow the growth medium may be able to buffer/extinguish 533
the produced H2O2 in the root apical meristem. The CAT activity in the soil partly depends on 534
the total number of aerobic heterotrophic bacteria (measured with colony forming unit 535
counting), which was only negatively affected by the 500 ppm Zn treatment, while the 536
addition of 10 ppm Zn slightly increased bacterial counts in the growth media (data not 537
shown). Also, micromycetes, as the members of soil microbial communities often produce 538
extracellular catalases (Kurakov et al. 2001), providing a further explanation for decreased 539
fluorescence consistent with H2O2 formation in the root tips. In general, heavy metal 540
contamination can either lower (Kandeler et al. 2000) or increase (Kzlkaya, 2004; Pascual et 541
al. 2004) the enzymatic activities of soil microbial communities, showing the complexity of 542
the heavy metal induced responses of soil enzyme activities. Belyaeva et al. (2005) reported 543
that catalase is inhibited by Zn stress, although this inhibition is much less pronounced than 544
invertase or urease activity loss.
545 546
3.4. Subsequent viability loss of the root tips 547
Viability of the root apical meristem seriously affects the growth of the root system. The 548
above discussed Zn uptake and Zn-induced changes in the nitro-oxidative homeostasis affects 549
the development of the root system by modifying the viability and proliferation rate of the 550
apical meristem. According to the fluorescent EdU staining, which detects cell DNA synthesis 551
M AN US CR IP T
AC CE PT ED
(Salic and Mitchison, 2008), the number of cells with active DNA replication decreased 552
significantly by both Zn treatment (by 33 and 77%, respectively) (Fig 7AB).With FDA 553
staining we detected the viability of the root apical meristem, and it showed similar changes 554
as seen in the number of proliferating cells, both Zn supplementations caused significant 555
decrease in their viability (by 45 and 75%, respectively, compared to the control, if that’s 556
fluorescence is defined by 100%) (Fig. 7C), suggesting that the cells with decreased DNA 557
replication activity correlate closely with the viability of the meristematic cells. These results 558
do not necessarily coincide with the primary root growth data, since besides proliferation and 559
viability, many other factors (alterations in the primary metabolism or changes in the 560
hormonal homeostasis) influence primary root elongation (Satbhai et al. 2015).
561 562
563
Fig. 7. (A) Number of cells with active DNA synthesis in the meristematic zone of the roots 564
supplemented with 10 or 500 ppm Zn compared to the control (60 ppm total Zn). (B) 565
Representative image of the root tips stained with EdU, showing the number and localisation 566
of cells with active DNA synthesis in the root tips supplemented with 10 or 500 ppm Zn 567
compared to the control (60 ppm total Zn) (bar=100µm). (C) Viability of the root apical 568
meristem supplemented with 10 or 500 ppm Zn compared to the control (60 ppm total Zn).
569
Different letters indicate significant differences according to Duncan-test (n=10-15, P<0.05).
570 571
M AN US CR IP T
AC CE PT ED
4. Conclusions 572
The present study compared the effect of two different Zn supplementation on the rapeseed 573
RSA and the underlying processes (summarised in Fig. 8). The two applied Zn concentrations 574
triggered two completely different growth responses in B. napus root system. In the 575
background of the 10 ppm Zn supplementation-induced positive growth response the pattern 576
of tyrosine nitration rearranged significantly, and four new protein bands became nitrated.
577
There were no severe disturbances in the nitro-oxidative signalling network; and due to the 578
low Zn treatment and mild Zn uptake the composition of the cell walls changed only slightly 579
in the root tips (pectin content increment). It has to be noted though, that despite the positive 580
growth response, the viability of the root apical meristem cells decreased to some extent. On 581
the other hand, 500 ppm Zn supplementation caused severe growth inhibition, what was co- 582
occurred with increased tyrosine nitration. The nitro-oxidative balance was disturbed, both the 583
fluorescence consistent with ROS and RNS formation increased significantly. Due to the high 584
Zn concentration, Zn uptake was high in the root system and it caused severe alterations in the 585
cell walls (both pectin and callose contents increased) and all these processes were coupled 586
with a significant reduction in the viability of the root apical meristem.
587
Results suggest that Zn in different amounts triggers different root growth responses 588
accompanied by distinct changes in the metabolism of ROS and RNS consequently resulting 589
in alterations in pattern and intensity of protein tyrosine nitration. These suggest that 590
nitrosative processes have an important role in zinc stress-induced root growth responses.
591
M AN US CR IP T
AC CE PT ED
592
Fig. 8. Schematic model summarising the results presented in this study. 10 ppm Zn 593
supplementation caused a positive growth response with slight Zn uptake and tyrosine 594
nitration reorganisation in the background, while no oxidative or nitrosative stress was 595
detectable. 500 ppm Zn treatment inhibited root growth, and this stress response was 596
accompanied by high Zn uptake and indicated by increased cell wall modifications, tyrosine 597
nitration and fluorescence consistent with ROS/RNS formation. (An upward arrow indicates 598
increase while a downward arrow shows decrease; = means no significant change.) 599
M AN US CR IP T
AC CE PT ED
5. Acknowledgements 600
This work was supported by the National Research, Development and Innovation Fund (Grant 601
no. NKFI-1 PD 120962 and NKFI-6, K120383) and by the János Bolyai Research 602
Scholarship of the Hungarian Academy of Sciences (Grant no. BO/00751/16/8). Zs. K. was 603
supported by UNKP-18-4 New National Excellence Program of the Ministry of Human 604
Capacities.
605
M AN US CR IP T
AC CE PT ED
6. References 606
Andreini, C., Bertini, I., & Rosato, A. (2009). Metalloproteomes: a bioinformatic approach.
607
Accounts of chemical research, 42(10), 1471-1479.
608
Apel, K., & Hirt, H. (2004). Reactive oxygen species: metabolism, oxidative stress, and signal 609
transduction. Annu. Rev. Plant Biol., 55, 373-399.
610
Bacon, J. R., & Dinev, N. S. (2005). Isotopic characterisation of lead in contaminated soils 611
from the vicinity of a non-ferrous metal smelter near Plovdiv, Bulgaria. Environmental 612
Pollution, 134(2), 247-255.
613
Barroso, J. B., Corpas, F. J., Carreras, A., Rodríguez-Serrano, M., Esteban, F. J., Fernández- 614
Ocana, A., ... & del Río, L. A. (2006). Localization of S-nitrosoglutathione and expression of 615
S-nitrosoglutathione reductase in pea plants under cadmium stress. Journal of experimental 616
botany, 57(8), 1785-1793.
617
Beauchamp, C., & Fridovich, I. (1971). Superoxide dismutase: improved assays and an assay 618
applicable to acrylamide gels. Analytical biochemistry, 44(1), 276-287.
619
Begara-Morales, J. C., Chaki, M., Valderrama, R., Sánchez-Calvo, B., Mata-Pérez, C., 620
Padilla, M. N., ... & Barroso, J. B. (2018). Nitric oxide buffering and conditional nitric oxide 621
release in stress response. Journal of experimental botany, 69(14), 3425-3438.
622
Belyaeva, O. N., Haynes, R. J., & Birukova, O. A. (2005). Barley yield and soil microbial and 623
enzyme activities as affected by contamination of two soils with lead, zinc or copper. Biology 624
and Fertility of Soils, 41(2), 85-94.
625
Bi, X., Feng, X., Yang, Y., Qiu, G., Li, G., Li, F., ... & Jin, Z. (2006). Environmental 626
contamination of heavy metals from zinc smelting areas in Hezhang County, western 627
Guizhou, China. Environment international, 32(7), 883-890.
628
Bradford, M. M. (1976). A rapid and sensitive method for the quantitation of microgram 629
quantities of protein utilizing the principle of protein-dye binding. Analytical biochemistry, 630
72(1-2), 248-254.
631
Broadley, M. R., White, P. J., Hammond, J. P., Zelko, I., & Lux, A. (2007). Zinc in plants.
632
New phytologist, 173(4), 677-702.
633
M AN US CR IP T
AC CE PT ED
Chen, X. Y., & Kim, J. Y. (2009). Callose synthesis in higher plants. Plant signaling &
634
behavior, 4(6), 489-492.
635
Corpas, F. J., & Barroso, J. B. (2013). Nitro‐oxidative stress vs oxidative or nitrosative stress 636
in higher plants. New Phytologist, 199(3), 633-635.
637
Corpas, F. J., Luis, A., & Barroso, J. B. (2007). Need of biomarkers of nitrosative stress in 638
plants. Trends in plant science, 12(10), 436-438.
639
Corpas, F. J., Leterrier, M., Valderrama, R., Airaki, M., Chaki, M., Palma, J. M., & Barroso, 640
J. B. (2011). Nitric oxide imbalance provokes a nitrosative response in plants under abiotic 641
stress. Plant Science, 181(5), 604-611.
642
Corpas, F. J., Palma, J. M., del Río, L. A., & Barroso, J. B. (2013). Protein tyrosine nitration 643
in higher plants grown under natural and stress conditions. Frontiers in Plant Science, 4, 29.
644
Devienne-Barret, F., Richard-Molard, C., Chelle, M., Maury, O., & Ney, B. (2006). Ara- 645
rhizotron: An effective culture system to study simultaneously root and shoot development of 646
Arabidopsis. Plant and Soil, 280(1-2), 253-266.
647
Dhindsa, R. S., Plumb-Dhindsa, P., & Thorpe, T. A. (1981). Leaf senescence: correlated with 648
increased levels of membrane permeability and lipid peroxidation, and decreased levels of 649
superoxide dismutase and catalase. Journal of Experimental botany, 32(1), 93-101.
650
Durand, C., Vicré-Gibouin, M., Follet-Gueye, M. L., Duponchel, L., Moreau, M., Lerouge, P., 651
& Driouich, A. (2009). The organization pattern of root border-like cells of Arabidopsis is 652
dependent on cell wall homogalacturonan. Plant physiology, 150(3), 1411-1421.
653
Ebbs, S. D., & Kochian, L. V. (1997). Toxicity of zinc and copper to Brassica species:
654
implications for phytoremediation. Journal of Environmental Quality, 26(3), 776-781.
655
Feigl, G., Lehotai, N., Molnár, Á., Ördög, A., Rodríguez-Ruiz, M., Palma, J. M., ... &
656
Kolbert, Z. (2015). Zinc induces distinct changes in the metabolism of reactive oxygen and 657
nitrogen species (ROS and RNS) in the roots of two Brassica species with different sensitivity 658
to zinc stress. Annals of botany, 116(4), 613-625.
659
M AN US CR IP T
AC CE PT ED
Feigl, G., Kolbert, Z., Lehotai, N., Molnár, Á., Ördög, A., Bordé, Á., ... & Erdei, L. (2016).
660
Different zinc sensitivity of Brassica organs is accompanied by distinct responses in protein 661
nitration level and pattern. Ecotoxicology and environmental safety, 125, 141-152.
662
Galetskiy, D., Lohscheider, J. N., Kononikhin, A. S., Popov, I. A., Nikolaev, E. N., &
663
Adamska, I. (2011). Phosphorylation and nitration levels of photosynthetic proteins are 664
conversely regulated by light stress. Plant molecular biology, 77(4-5), 461.
665
Gémes, K., Kim, Y. J., Park, K. Y., Moschou, P. N., Andronis, E., Valassaki, C., ... &
666
Roubelakis-Angelakis, K. A. (2016). An NADPH-oxidase/polyamine oxidase feedback loop 667
controls oxidative burst under salinity. Plant Physiology, 172(3), 1418-1431.
668
Gow, A. J., Farkouh, C. R., Munson, D. A., Posencheg, M. A., & Ischiropoulos, H. (2004).
669
Biological significance of nitric oxide-mediated protein modifications. American Journal of 670
Physiology-Lung Cellular and Molecular Physiology, 287(2), L262-L268.
671
Greenacre, S. A., & Ischiropoulos, H. (2001). Tyrosine nitration: localisation, quantification, 672
consequences for protein function and signal transduction. Free radical research, 34(6), 541- 673
581.
674
Hagmann, D. F., Goodey, N. M., Mathieu, C., Evans, J., Aronson, M. F., Gallagher, F., &
675
Krumins, J. A. (2015). Effect of metal contamination on microbial enzymatic activity in soil.
676
Soil Biology and Biochemistry, 91, 291-297.
677
Hall, J. L. (2002). Cellular mechanisms for heavy metal detoxification and tolerance. Journal 678
of experimental botany, 53(366), 1-11.
679
Jain, R., Srivastava, S., Solomon, S., Shrivastava, A. K., & Chandra, A. (2010). Impact of 680
excess zinc on growth parameters, cell division, nutrient accumulation, photosynthetic 681
pigments and oxidative stress of sugarcane (Saccharum spp.). Acta Physiologiae Plantarum, 682
32(5), 979-986.
683
Jain, A., Sinilal, B., Dhandapani, G., Meagher, R. B., & Sahi, S. V. (2013). Effects of 684
deficiency and excess of zinc on morphophysiological traits and spatiotemporal regulation of 685
zinc-responsive genes reveal incidence of cross talk between micro-and macronutrients.
686
Environmental science & technology, 47(10), 5327-5335.
687
M AN US CR IP T
AC CE PT ED
Jones, D. L., Blancaflor, E. B., Kochian, L. V., & Gilroy, S. (2006). Spatial coordination of 688
aluminium uptake, production of reactive oxygen species, callose production and wall 689
rigidification in maize roots. Plant, cell & environment, 29(7), 1309-1318.
690
Jordan, M. O. (1992). Can rhizotrons be used for the study of corn (Zea mays L.) root 691
ramification? [needle board, root development, number of secondary roots]. Agronomie 692
(France) 12, 3–14.
693
Kalaivanan, D., Ganeshamurthy, A.N. (2016). Mechanisms of heavy metal toxicity in plants.
694
pp 21, in Rao, N. S., Shivashankara, K. S., & Laxman, R. H. (Eds.). (2016). Abiotic stress 695
physiology of horticultural crops. New Delhi: Springer. https://doi.org/10.1007/978-81-322- 696
2725-0 697
Kandeler, F., Kampichler, C., & Horak, O. (1996). Influence of heavy metals on the 698
functional diversity of soil microbial communities. Biology and fertility of soils, 23(3), 299- 699
306.
700
Kimura, M., Umemoto, Y., & Kawano, T. (2014). Hydrogen peroxide-independent generation 701
of superoxide by plant peroxidase: hypotheses and supportive data employing ferrous ion as a 702
model stimulus. Frontiers in plant science, 5, 285.
703
Kolbert, Z. (2016). Implication of nitric oxide (NO) in excess element-induced morphogenic 704
responses of the root system. Plant Physiology and Biochemistry, 101, 149-161.
705
Kolbert, Z. (2012). In vivo and in vitro studies on fluorophore-specificity. Acta Biologica 706
Szegediensis, 56(1), 37-41.
707
Kolbert, Z., Feigl, G., Bordé, Á., Molnár, Á., & Erdei, L. (2017). Protein tyrosine nitration in 708
plants: Present knowledge, computational prediction and future perspectives. Plant physiology 709
and biochemistry, 113, 56-63.
710
Kolbert, Z., Molnár, Á., Szőllősi, R., Feigl, G., Erdei, L., & Ördög, A. (2018). Nitro-oxidative 711
stress correlates with Se tolerance of Astragalus species. Plant and Cell Physiology, 59(9), 712
1827-1843.
713
Krumins, J. A., Goodey, N. M., & Gallagher, F. (2015). Plant–soil interactions in metal 714
contaminated soils. Soil Biology and Biochemistry, 80, 224-231.
715