Submitted27 February 2018 Accepted 29 June 2018 Published26 July 2018 Corresponding author
Ádám Kőrösi, korozott@gmail.com Academic editor
Christian Hof
Additional Information and Declarations can be found on page 14
DOI10.7717/peerj.5269 Copyright
2018 Kőrösi et al.
Distributed under
Creative Commons CC-BY 4.0
OPEN ACCESS
Climate-induced phenological shift of apple trees has diverse effects on pollinators, herbivores and natural enemies
Ádám Kőrösi1,2,*, Viktor Markó3,*, Anikó Kovács-Hostyánszki4, László Somay4, Ákos Varga3, Zoltán Elek1, Virginie Boreux5, Alexandra-Maria Klein5,
Rita Földesi6and András Báldi4
1MTA-ELTE-MTM Ecology Research Group, Budapest, Hungary
2Theoretical Evolutionary Ecology Group, Department of Animal Ecology and Tropical Biology, University of Würzburg, Würzburg, Germany
3Department of Entomology, Szent István University, Budapest, Hungary
4Institute of Ecology and Botany, Lendület Ecosystem Services Research Group, MTA Centre for Ecological Research, Vácrátót, Hungary
5Nature Conservation and Landscape Ecology, Faculty of Environment and Natural Resources, University of Freiburg, Freiburg, Germany
6Agroecology and Organic Farming, Institute of Crop Science and Resource Conservation, University of Bonn, Bonn, Germany
*These authors contributed equally to this work.
ABSTRACT
Climate change is altering the phenology of trophically linked organisms, leading to increased asynchrony between species with unknown consequences for ecosystem services. Although phenological mismatches are reported from several ecosystems, experimental evidence for altering multiple ecosystem services is hardly available.
We examined how the phenological shift of apple trees affected the abundance and diversity of pollinators, generalist and specialist herbivores and predatory arthropods.
We stored potted apple trees in the greenhouse or cold store in early spring before transferring them into orchards to cause mismatches and sampled arthropods on the trees repeatedly. Assemblages of pollinators on the manipulated and control trees differed markedly, but their overall abundance was similar indicating a potential insurance effect of wild bee diversity to ensure fruit set in flower-pollinator mismatch conditions. Specialized herbivores were almost absent from manipulated trees, while less-specialized ones showed diverse responses, confirming the expectation that more specialized interactions are more vulnerable to phenological mismatch. Natural enemies also responded to shifted apple tree phenology and the abundance of their prey. While arthropod abundances either declined or increased, species diversity tended to be lower on apple trees with shifted phenology. Our study indicates novel results on the role of biodiversity and specialization in plant-insect mismatch situations.
SubjectsAgricultural Science, Biodiversity, Ecology, Entomology, Climate Change Biology Keywords Climate change, Ecosystem services, Pest control, Phenological mismatch, Pollination, Trophic interactions, Apple orchards, Agro-ecosystems
INTRODUCTION
There is growing evidence that in response to ongoing global climate change (IPCC, 2014) the phenology of functionally diverse organisms has been shifted in the last few decades (for a review seeDonnelly, Caffarra & O’Neill, 2011). The rate of phenological shift can vary across different taxa within the same community (Primack et al., 2009;Cook, Wolkovich & Parmesan, 2012), a phenomenon also known as response diversity (Elmqvist et al., 2003). As a consequence, phenological overlap of interacting species can decrease, sometimes resulting in mismatches that uncouple the interaction (Stenseth & Mysterud, 2002;Thackeray et al., 2010). Examples of such phenological mismatches are known from a wide range of ecosystems, mainly in the temperate and arctic regions (Visser & Holleman, 2001;Winder & Schindler, 2004;Post & Forchhammer, 2008). However, our knowledge on the possible consequences of phenological mismatches on ecological interactions is still limited (Hegland et al., 2009;Miller-Rushing et al., 2010). Some studies on phenological mismatch assessed a few interacting species at two or more trophic levels (Doi, Gordo
& Katano, 2008; Both et al., 2009;Evans et al., 2013; Kudo & Ida, 2013), while others examined whole ecological networks and related the change in network structure with climate warming (Burkle, Marlin & Knight, 2013) or quantified the rate of phenological change in many interacting species across different ecosystems (Thackeray et al., 2010). The consequences of mismatch in multiple interactions within a given community, however, are still largely unexplored.
Considerable attention has been devoted to mutualistic plant–pollinator networks, since earlier simulations predicted pollinator extinctions due to mismatch with food plants (Memmott et al., 2007). A recent review (Forrest, 2015) of the relationship between phenological changes and plant–pollinator interactions found that apart from a few examples of negative consequences of mismatch between plants and pollinators (Thomson, 2010;Kudo & Ida, 2013), rates of phenological advance related to global warming seem broadly consistent between generalist plants and insect pollinators at large spatial scales (Bartomeus et al., 2011;Iler et al., 2013;Ovaskainen et al., 2013). This consistency is likely due to the fact that insects and the plants they pollinate may use similar environmental cues to time their spring emergence (Forrest & Thomson, 2011), and that plant–pollinator interactions are quite flexible (Petanidou et al., 2008;Benadi et al., 2014).Rafferty & Ives (2011)manipulated the phenology of 14 plant species and found no temporal mismatches between flowering onset and pollinator visitation for most of them. Burkle, Marlin
& Knight (2013) attributed a large proportion of lost plant–bee interactions in their pollination network to phenological mismatch, but could not determine whether the apparent mismatches were a cause or a consequence of pollinator declines.
Hitherto, a few studies have been able to uncover the consequences of phenological shifts for species and their trophic interactions (Rafferty et al., 2013). For example, recent phenological asynchrony between egg-hatching of the winter moth (Operophtera brumata L.) and bud burst of oak trees (Quercus robur L.) due to their differential response to increased spring temperature lead to natural selection, and the winter moth rapidly adapted to this environmental change resulting in recovery of synchrony (Van Asch et al., 2007).
Mutualistic interactions can also be disrupted when climate response is different between species. When plant phenology was experimentally manipulated, advanced flowering of Sinapis arvensis(L.) caused a decline in flower-visiting pollinators, but an increase of seed set (Parsche, Fründ & Tscharntke, 2011), while both advanced and delayed treatments led to very low reproduction of a spring ephemeralClaytonia lanceolataPursh due to either frost damage or low pollinator visitation (Gezon, Inouye & Irwin, 2016). Nevertheless, all these studies were limited to one type of interaction, a few interacting species and/or two guilds. For future research, the importance of studies that scale up from pairwise species interactions to communities and ecosystems involving multiple trophic levels using experimental approaches has been emphasized (Rafferty et al., 2013).
In Europe, the apple (Malus x domestica) is one of the most important insect-pollinated crop plants, accounting for 16% of the EU’s total economic gains attributed to insect pollination (Leonhardt et al., 2013). Apple orchards can harbor rich arthropod communities that largely contribute to the biodiversity and functioning of agro-ecosystems (Rosa García
& Miñarro, 2014), while crop yield and quality strongly depend on ecosystem services, particularly pollination (Klein et al., 2007;Garratt et al., 2014) and pest control (Cross et al., 2015). We aimed to unravel the possible consequences of climate-induced phenological shift of apple on the abundance and diversity of arthropods at multiple trophic levels.
Therefore, we manipulated the phenology of young potted apple trees in a greenhouse or a cold store and repeatedly sampled arthropod communities after transferring the trees into organic apple orchards. In this way we imitated a ’worst-case scenario’ (sensuRafferty et al., 2013), i.e., when climate-induced phenological shift of apple trees to earlier dates was much larger (Advanced scenario) or smaller (Delayed scenario) than that of arthropods, and thus phenological asynchrony was maximized. In the temperate zone, climate change usually advances spring phenology (Schwartz, Ahas & Aasa, 2006), so our Delayed scenario imitated a situation when phenology of apple trees advances to much lower degree than the phenology of arthropods. Primarily, we were interested in the response of arthropod abundance and diversity to this experimentally induced phenological asynchrony.
We hypothesized that: (i) pollinator abundance, diversity and species composition on manipulated trees will be different from the control trees (Rafferty & Ives, 2011;Parsche, Fründ & Tscharntke, 2011;Gezon, Inouye & Irwin, 2016); (ii) responses of herbivores will correlate with their degree of specialization to apple (measured as degree of monophagy), since more specialized interactions are expected to be more vulnerable to phenological mismatches (Memmott et al., 2007;Van Asch & Visser, 2007;Miller-Rushing et al., 2010);
(iii) natural enemies as secondary consumers may be either less or even more affected than herbivores, depending on the response of their prey (herbivores) and how strongly they are coupled to them.
MATERIALS & METHODS
Experimental design and sampling
We manipulated the phenology of potted, 3 year old apple trees (n=182, cv. Resi,∼2.5 m height,∼3 cm trunk diameter) by keeping them either in a greenhouse (advanced
Table 1 Apple tree phenology in each of the five treatments.
Treatment Abbreviation Number of trees
Date of planting outdoors
Peak flowering, pollinator sampling
Days of flowering
Advanced1 A1 31 17.04.2013 19–20.04.2013 6
Advanced2 A2 31 19.04.2013 24–25.04.2013 6
Control C 42 05.04.2013 2–3.05.2013 5
Delayed1 D1 39 30.04.2013 17–19.05.2013 6
Delayed2 D2 39 07.05.2013 7–8.06.2013 7
treatments), a cold store (delayed treatments), or outdoors (control) from March 2013.
Before flowering, trees were buried outdoors with their pot in five treatments during April and May (Advanced1, Advanced2, Control, Delayed1, and Delayed2. SeeTable 1).
The experiment was conducted in three organic apple orchards in Eastern Hungary (see geographical locations inData S1). Within the three orchards, we designated altogether eight blocks (3+3+2) and we distributed the experimental apple trees among them in a way that each block contained more or less similar numbers of trees from all treatment groups. During flowering, branches of apple trees were placed out in water canisters in all blocks to enable cross-pollination for the experimental trees. For information on the flowering periods of apple cultivars that occurred in the study orchards seeTable S1.
Phenology of apple trees was documented by photographs and dates of onset of main phenological phases (bud burst; onset, peak, end of flowering) were also recorded. Five randomly selected leaves were collected from each experimental tree on 18 July and leaf size was calculated from scanned digital images (O’Neal, Landis & Isaacs, 2002) using ImageJ 1.49 (Schneider, Rasband & Eliceiri, 2012) and Adobe Photoshop 8.0 (Adobe Systems, San Jose, CA, USA) software. Ripe apple fruits were collected from all experimental trees in August. Total shoot growth was measured on three randomly chosen annual shoots per tree on 22 Nov.
Pollinators were sampled on each tree twice, on two subsequent days between 9:00 a.m.
and 4:00 p.m. under favourable weather conditions (>20◦C, wind speed≤3 on Beaufort scale) during peak flowering of each treatment group. At both occasions, we counted the flowers and observed the pollinators landing on the flowers on each tree for 15 min. All trees were sampled by two persons at one time. European honey bees (Apis melliferaL.) and bumble bees (Bombusspp.) (Hymenoptera: Apidae) were identified without capturing, while solitary wild bees (i.e., other wild bees thanBombusspp. including some semi-social species; Hymenoptera: Apoidea) and hoverflies (Diptera: Syrphidae) were captured by insect nets and preserved in 70% ethanol for later identification.
Green apple aphids (Aphis pomide Geer) (Hemiptera: Aphididae) were sampled three times during the summer (14 & 27 June, 12 July). Each time the shoots were counted and the proportion of young, still growing shoots was estimated on each tree. Then three growing shoots and three non-growing (old) shoots were randomly selected and aphids were counted on them. Other herbivores and natural enemies were sampled by beating the whole canopy of each tree for 15 s with a 70-cm-long stick, collecting the fallen arthropods in a 35-cm-radius beating funnel and preserving them in 50% ethanol for later identification.
Sampling was repeated once a week from 24 April until 18 July. Buds infected by the apple blossom weevil (Anthonomus pomorumL.) (Coleoptera: Curculionidae) were counted on all trees one week after peak flowering. These ‘capped buds’ have a rusty colour, never open and stay on the tree for a while.
Data preparation
We analyzed the effects of treatments on some characteristics of apple trees, and abundance, diversity and species composition of arthropods. Apple tree flower numbers from the two pollinator sampling occasions were averaged for each tree and square root transformed, while leaf size and shoot growth were not transformed. The number of ripe apples was divided by the number of flowers for each tree to calculate fruit set. Abundance of honey bees, wild bees (incl. bumble bees) and hoverflies from the two sampling occasions was summed for each tree. Based on the shoot and aphid counts, aphid abundance was estimated for each tree at each sampling event and then log(x+1)-transformed. Both the proportion of growing shoots and aphid abundance showed a sharp decline through the three sampling occasions in all treatments and the mean of the three samples was used for analysis.
Since the number of arthropods per tree per beating event was very low, we pooled the data of all samples between 8 May and 18 July for each tree. Thus we pooled the same number of samples (n=11) for all treatment groups. From herbivores, we used data of apple blossom weevil, pear lace bug (Stephanitis pyri(Fabr.)) (Hemiptera: Tingidae) and all other phytophagous bugs (Hemiptera: Heteroptera). The highest number of adults of A. pomorumwas found in late April, so we pooled the samples from 24 April to 18 July for this species. Only its occurrence was analyzed as this species occurred in only one orchard, where it was absent on∼75% of the trees.A. pomorumoccurrence was zero on Delayed1 trees, so we omitted this treatment group from the analysis. Buds infected byA. pomorum were found only on advanced and control trees in the same orchard. Number of capped buds was log(x+1)-transformed.
In order to account for natural enemies, we used the abundance of aphidophagous beetles (Coleoptera: Coccinellidae), zoophagous (incl. zoo-phytophagous) bugs (Hemiptera:
Heteroptera) and spiders (Araneae). For spider abundance, juvenile and adult spiders were all counted, while diversity and species composition analyses were based on only adult spider specimens that were possible to identify at species level. We identified sufficient number of species to analyze species composition and diversity in four taxonomic groups: wild bees (incl. bumble bees), phytophagous true bugs (excludingS. pyridue to its overwhelming abundance), aphidophagous beetles and spiders.
Data analysis
We used generalized linear mixed effects models (GLMM) with treatment as the fixed effect and block ID as a random factor. Response variables were the abundance, in some cases the occurrence of arthropods, flower number, leaf area, shoot growth, fruit set and the number of buds infected byA. pomorum(see ‘Data preparation’). For some response variables, continuous variables as additional fixed terms were included in the GLMM. In
such cases, we also tested if the interaction between treatment and the continuous variable was significant. Such continuous variables were: the number of flowers for pollinator abundance; the proportion of growing shoots for aphid abundance; aphid abundance for the abundance of aphidophagous beetles and zoophagous bugs; abundance ofS. pyrifor the abundance of spiders. We hypothesized that these covariates represent the main food sources of the corresponding arthropod groups and thus would influence their abundance.
Moreover, the inclusion of these covariates ensured that we could separate the effects of altered phenology and altered physiology of apple trees caused by our experimental treatment. Continuous covariates were centered. When more than one fixed term was involved, we performed an AICc-based model selection (Burnham & Anderson, 2002) and results of the model with the lowest AICc value are reported.
For occurrence data, we used a binomial error distribution, otherwise we applied the most appropriate error structure based on AICc values and diagnostic plots. Abundance of S. pyriwas zero on∼36% of apple trees and showed a right-skewed distribution on the rest of them so we fitted a model to the log-transformed non-zero abundances with a quasi-Poisson error structure. Quasi-Poisson error structure was used also for fruit set and number of capped buds (Table S1). Zero-inflated models were used if it improved model fit (Zuur et al., 2009).
For the community-level analysis, we calculated and plotted Rényi’s diversity profile for each treatment. Common diversity indices are special cases of Rényi diversity (Hill, 1973), and one community can be regarded as more diverse than another only if its Rényi diversities are all higher (i.e., their diversity profiles do not intersect) (Tóthmérész, 1995). We also conducted two separate redundancy analyses (RDA) with constraint variablesorchard andtreatment. Species matrix was transformed with the Hellinger method to improve the effectiveness of these analyses in representing ecological relationships (Legendre &
Gallagher, 2001), and significance of the constraint term was tested by a permutation test (104permutations). A non-metric multidimensional scaling (NMDS) with Bray–Curtis distances was applied to visualize similarity among treatments in each orchard. All analyses were made using packages glmmADMB (Skaug et al., 2015), lme4 (Bates et al., 2015), MuMIn (Barton, 2014) and vegan (Oksanen et al., 2017) of R 3.4.3 statistical software (R Core Team, 2017). The dataset and the R code used for the analysis are in (Data S2&
Data S3).
RESULTS
Tree phenology and pollination success
Trees kept in the greenhouse had their flowering advanced by 6–9 days, while flowering of cool stored trees was delayed by 16–38 days compared to the control ones. Flowering period lasted for 5–7 days in all treatments (Table 1). Number of flowers was higher on control trees than in all other treatments, but there was no difference among the other treatment groups (Fig. 1A). Leaf size was larger on advanced trees and smaller on delayed trees than on control ones (Fig. 1B), while total shoot growth was not affected by treatment (Fig. 1C).
Sufficient number of fruits for statistical analysis was harvested in only one orchard. Here
Figure 1 Apple tree condition in each of the five experimental treatments.(A) Number of flowers. (B) Leaf size. (C) Shoot growth. (D) Fruit set (assessed in one orchard only,n=62). Grey boxes represent treatments significantly different from the control. (A) box spacing is proportional to the time elapsed be- tween peak flowering in each treatment.
Full-size DOI: 10.7717/peerj.5269/fig-1
fruit set did not differ between advanced and control trees, but delayed trees responded with lower reproductive success (Fig. 1D,Table 2&Table S2).
Pollinators
Flower number of apple trees had a positive effect on the abundance of all pollinator groups, but its interaction with treatment was not significant (Table 2&Table S2). This means that the relationship between flower number and pollinator abundance had the same strength in each treatment. In other words, pollinator abundance was best explained by treatment effect plus the effect of flower number. However, since the number of flowers was not equal among treatment groups (see above), model estimates on treatment effects should be interpreted as if flower number were the same in all treatments. Model estimates of honey bee abundance were higher on delayed trees and Advanced2 trees than on control ones. Observed honey bee abundance was not higher on Advanced2 trees than on control ones (Fig. 2), but the model estimated that it would be higher if the number of flowers were equal in these two groups. Hoverfly abundance was also higher on delayed trees than on control ones. Abundance of wild bees was higher on Advanced1, Delayed1 and Delayed2 trees than on control ones (Fig. 2) (Table 2&Table S2). To compare with other studies, we also calculated and plotted the visitation rate as the number of pollinators/15 min/1,000 flowers in each treatment group (Fig. S1).
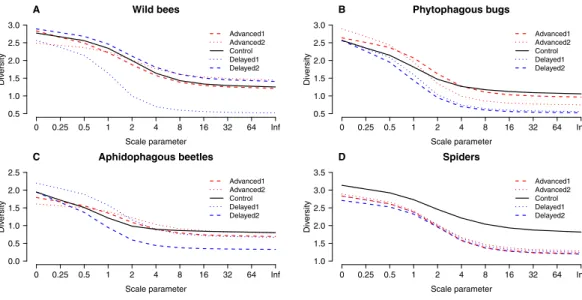
Altogether 39 wild bee species were observed on the apple trees (Table S3). Diversity was higher on Delayed2 trees than on control and Advanced1 trees, while diversity on Delayed1 trees was lower than on all aforementioned treatments (Fig. 3A). A few species (Andrena haemorrhoaFabr.,A. variansKirby,Lasioglossum calceatumScopoli,Osmia cornutaLatr.) occurred in high abundances on Advanced1 trees, but in much lower abundances in all other treatments, resulting in the significantly higher abundance on Advanced1 trees. RDA revealed thattreatment had an effect on species composition of wild bee assemblages and it
Table 2 Parameter estimates (SE) of the best models for each response variable.Control was the reference level of treatment in all models, sig- nificant terms are bold. Red upward and blue downward arrows indicate that the response variable was significantly higher or lower, respectively, in the given treatment than in the control group. SeeTable S2for full model outputs. Diversity was compared using Rényi’s diversity profiles (Fig. 3), thus no parameter estimates are available. Arrows indicate that diversity profiles were below (blue) or above (red) that of the control group.
Advanced1 Advanced2 Delayed1 Delayed2
Flower number −6.35 (0.64)↓ −5.64 (0.63)↓ −5.71 (0.59)↓ −5.63 (0.59)↓
Fruit set −0.04 (0.42) −0.03 (0.41) −2.95 (1.27)↓ −1.18 (0.58)↓
Leaf area 5.7 (0.67)↑ 3.2 (0.67)↑ −2.4 (0.63)↓ −2.8 (0.63)↓
Tree condition
Shoot growth 0.38 (2.70) −3.8 (2.70) −1.66 (2.53) −0.44 (2.53)
Honey bee abundancea −0.34 (0.23) 0.47 (0.17)↑ 1.13 (0.15)↑ 1.89 (0.14)↑ Hoverfly abundancea −0.20 (0.48) −0.02 (0.43) 1.46 (0.31)↑ 2.46 (0.29)↑ Pollinators
Wild bee abundancea 2.03 (0.23)↑ 0.16 (0.29) 0.81 (0.24)↑ 0.67 (0.26)↑ A. pomorumoccurrence −1.67 (0.96) −1.67 (0.96) ↓b −1.99 (0.94)↓ A. pomoruminfected buds −1.09 (0.49)↓ −0.13 (0.35) ↓b ↓b
Aphid abundancea 0.43 (0.30) 0.15 (0.34) 0.77 (0.19)↑ −1.32 (0.29)↑
S. pyri abundance −0.15 (0.11) 0.04 (0.11) −0.26 (0.11)↓ −0.33 (0.11)↓ Herbivores
Phytophagous bug abundance −0.42 (0.24) 0.01 (0.22) −0.29 (0.22) −0.22 (0.21) Aphidophagous beetle abundancea −0.15 (0.23) −0.54 (0.26)↓ 0.36 (0.26) 0.99 (0.26)↑ Zoophagous bug abundance 0.84 (0.57) 0.73 (0.57) 1.72 (0.51)↑ 1.74 (0.51)↑ Natural enemies
Spider abundancea −0.16 (0.14) −0.104 (0.14) −0.09 (0.13) −0.57 (0.15)↓
Wild bees ↓ ↑
Phytophagous bugs ↓ ↓
Aphidophagous beetles ↓
Diversity
Spiders ↓ ↓ ↓ ↓
Notes.
aIndicates that an additional covariate also had significant effect on the response variable (number of flowers for pollinators, PGS for aphids and prey abundance for natural ene- mies; see text).
bIndicates that the response variable in a given treatment was zero on all trees.
explained 12.3% of total variation, whileorchardexplained only 3.4% (Table S4). Samples of treatment groups were separated on the NMDS plot (Fig. S2).
Herbivores
Both the occurrence of A. pomorumand the number of capped buds were lower in all treatments than in control. The difference was significant on Delayed2 trees (occurrence) (Fig. 4A), and on Advanced1 trees (capped buds) (Table 2). We found an interaction between phenological treatment and proportion of young growing shoots (PGS) in their effects on aphid (A. pomi) abundance, as it was positively related to PGS in the delayed, but not in the other treatments (Fig. 4B&Fig. S3,Table 2&Table S2). However, both PGS and aphid abundance were higher on delayed trees. According to this model, the higher aphid abundance on delayed trees is a consequence of the higher PGS on them. Non-zero abundance ofS. pyriwas lower on delayed trees than on control ones (Fig. 4C). Finally,
0 10 20 30 40 50
Ab undance
A1A2 C D1 D2 Honey bee
April May June
A
0 2 4 6 8 10 12 14
A1A2 C D1 D2 Hoverflies
April May June
B
0 5 10 15 20
A1A2 C D1 D2 Wild bees
April May June
C
Figure 2 Abundance of pollinators in each of the five experimental treatments.Box spacing is propor- tional to the time elapsed between peak flowering in each treatment. Grey boxes represent those treat- ments where parameter estimates were significantly different from the control, based on the best models that included the number of flowers as well (see text). Note that this does not mean that pollinator abun- dance was significantly different in these treatments. Dashed lines indicate the beginning and end of May.
(A) Abundance of honey bees. (B) Abundance of hoverflies. (C) Abundance of wild bees.
Full-size DOI: 10.7717/peerj.5269/fig-2
the abundance of phytophagous bugs was unaffected by treatment of apple trees (Table 2
&Table S2).
A total of 30 phytophagous bug species (excludingS. pyri) were identified in the samples (Table S3). Phytophagous bug diversity was lower on delayed than on control and advanced trees (Fig. 3B). RDA revealed no effect oftreatment on species composition, whileorchard had a significant effect and explained 11.2% of the total variation (Table S4,Fig. S2).
Natural enemies
Abundance of aphidophagous beetles was higher on Delayed2 trees and lower on Advanced2 trees than on control ones (Fig. 4D). Beetle abundance was negatively related to aphid abundance (Table 2&Table S2,Fig. S4).Harmonia axyridisPallas (harlequin ladybird) was the dominant species (56% of all aphidophagous beetles). When its data were analyzed separately, we found higher abundance ofH. axyridison Delayed2 trees than on control ones, while abundance of all other species was unaffected by treatment (Fig. S5). Abundance of zoophagous true bugs was higher on delayed trees than on control ones (Fig. 4E), but aphid abundance had no effect on it. Spider abundance was lower on Delayed2 trees than on control trees if only treatment was included as a predictor (Fig. 4F). However, in the best model the abundance ofS. pyriwas also included as a covariate, and its interaction with treatment was significant: spider abundance increased with the abundance ofS. pyri in Advanced2 and Control treatments (Table 2&Table S2,Fig. S6).
Scale parameter
Diversity
Advanced1 Advanced2 Control Delayed1 Delayed2
0 0.25 0.5 1 2 4 8 16 32 64 Inf
0.5 1.0 1.5 2.0 2.5 3.0
A Wild bees
Scale parameter
Diversity
Advanced1 Advanced2 Control Delayed1 Delayed2
0 0.25 0.5 1 2 4 8 16 32 64 Inf
0.5 1.0 1.5 2.0 2.5 3.0
B Phytophagous bugs
Scale parameter
Diversity
Advanced1 Advanced2 Control Delayed1 Delayed2
0 0.25 0.5 1 2 4 8 16 32 64 Inf
0.0 0.5 1.0 1.5 2.0 2.5
C Aphidophagous beetles
Scale parameter
Diversity
Advanced1 Advanced2 Control Delayed1 Delayed2
0 0.25 0.5 1 2 4 8 16 32 64 Inf
1.0 1.5 2.0 2.5 3.0 3.5
D Spiders
Figure 3 ‘‘Rényi’’ diversity profiles of wild bees (A), phytophagous bugs (B), aphidophagous beetles (C) and spiders (D) in each of the five experimental treatments along the scale parameter (A).a=0:
log(species richness);a=1: Shannon–Wiener index;a=2: Simpson index.
Full-size DOI: 10.7717/peerj.5269/fig-3
Figure 4 Abundance/occurrence (mean±SE) of herbivores (A–C) and natural enemies (D–F) in each of the five experimental treatments. Grey bars/boxes represent treatments significantly different from the control. Red dots on (B) show mean proportion of growing shoots. (A)A. pomorumwas found in one or- chard only (n=47). (C) only non-zero data are shown (n=116).
Full-size DOI: 10.7717/peerj.5269/fig-4
A total of 12 aphidophagous beetle and 40 spider species were identified in the samples (Table S3). Diversity of aphidophagous beetles tended to be lower on Delayed2 trees than on control and Delayed1 trees (Fig. 3C). Higher abundance and lower diversity on Delayed2 trees was due to the outstanding number ofH. axyridis.Treatment had a significant effect on species composition, but it explained only 4.13% of total variation, while orchard was not significant. Diversity of spiders was lower in all treatments than on control trees
(Fig. 3D). Species composition was not affected bytreatment, whileorchardexplained only 3.5% of total variance (Table S4,Fig. S2).
DISCUSSION
Tree condition and pollinators
Food availability is an important factor that governs the activity and population density of pollinating species (Westphal, Steffan-Dewenter & Tscharntke, 2003;Steffan-Dewenter
& Schiele, 2008). This is also illustrated by the increase of pollinator abundance with the number of apple flowers in our study. Altered flower abundance and flowering time and non-efficient flower-visitation due to climate change are therefore among the most important potential threats to fruit set of apple trees. In our experiment, control trees had on average about three times more flowers than treated ones indicating that altered temperature implied a physiological stress and/or changed the resource allocation within a tree (Bos et al., 2007).
The earliest flowering trees were mostly visited by wild bees, while honey bees and hoverflies occurred in lower numbers. The outstanding number of wild bees on Advanced1 trees in mid-April was due to a few dominant species that start foraging at lower temperatures in early spring (Torchio, 1991). These species might have accumulated on early-flowering apple trees, due to the lack of alternative floral resources in the landscape (Moise & Henry, 2010). Later on the abundance of honey bees and hoverflies showed an increase during the season that might provide suitable flower visitation for the delayed apple tree flowers too. Flowering of the control trees coincided with that of all other apple trees in the orchards that may have caused a dilution effect as pollinators must have been strongly attracted by other trees as well (Mitchell et al., 2009;Kovács-Hostyánszki et al., 2013;Riedinger et al., 2014).
Species composition of wild bee assemblages visiting the apple trees profoundly changed during the ∼7 weeks of the flowering period of manipulated trees. Earliest flowering trees were visited by a few dominant species, but assemblages on trees flowering later were more even and diverse. These correspond to the results of Rafferty & Ives (2012) who manipulated the phenology of two perennial forbs and observed changes in species composition of flower-visiting wild bees during five weeks of flowering. We can also conclude that high diversity of wild bees can ensure phenological synchrony with apple tree flowering due to complementarity among bee species’ activity periods and to differential responses among bee species to warming (Bartomeus et al., 2013). Wild bees, however, can have an outstanding importance in apple tree pollination in the case of advanced flowering, while honey bees and hoverflies may ensure efficient pollination in the case of the delayed scenario.
Efficient flower visitation mainly by wild bees on the advanced apple trees was verified by their similar fruit set to control trees. However, absolute number and total biomass of the fruits were higher on control trees (Fig. S7), which suggests that the manipulated trees might have allocated their resources to survival rather than to reproduction (Barboza, Parker &
Hume, 2009). Fruit set was lower on delayed trees than in other treatments. Possibly,
delayed trees were not limited by pollinators, but rather late transfer from cold store to the gardens delayed their development causing a higher fruit abortion (Bos et al., 2007).
Recent studies suggest that pollination success of apple trees responds positively to species richness of wild bees (Mallinger & Gratton, 2015;Földesi et al., 2016). If we use visitation frequency as a surrogate of pollination service (Vazquez, Morris & Jordano, 2005) then we can conclude that trees with manipulated phenology were not limited by pollinator availability. However, in agricultural landscapes with less semi-natural habitats the number of wild bees can be very low and apple pollination may fully depend on honey bees (Garibaldi et al., 2011;Burkle, Marlin & Knight, 2013). In such cases, apple trees with an advanced phenology may lack sufficient pollination, and climate change could have profound effect on apple yield. Thus our results confirm that biodiversity can be crucial for the longer-term resilience of ecosystem services (Oliver et al., 2015).
Herbivores
The specialist A. pomorumwas almost absent and caused no damage on delayed trees, and it caused less damage on Advanced1 trees than on control ones. This beetle lays eggs in the flower buds, so its phenology must be highly synchronized with that of apple trees. The phenological shift of apple trees had the most adverse effects on this species among the herbivores assessed in our experiment. Aphids prefer the high water and sugar content of growing plant shoots (Stoeckli, Mody & Dorn, 2008) and population size of the less-specialized oligophagous aphid,A. pomican rapidly increase by each generation usually reaching a peak in June—early July in apple orchards (Markó et al., 2013;Nagy, Cross &
Markó, 2013). In our study,A. pomishowed peak abundance in mid-June, when delayed trees were still in their early and intensive growing phase providing a highly favorable food source. Total shoot growth of apple trees was similar, but its timing was very different among treatments, and it was beneficial for aphids in the delayed treatments. We note that not all aphid colonies were identified to species level in the study. We identified a random subsample of the aphids and the vast majority of them wereA. pomi. Moreover,A. pomiis usually the dominantAphisspecies (>80%) and much more abundant thanA. spiraecola (Patch) in apple orchards in Hungary (Borbély et al., 2017). The even less specialized bug S. pyri, which is an oligophagous pest of apple feeding on Rosaceae (Wachmann, Melber
& Deckert, 2006), was less abundant on delayed than on control trees, which resulted from the absence of the first generation (in May) from trees with delayed phenology (Fig. S8). Finally, the absolutely unspecific herbivore group of phytophagous bugs was unaffected by the phenology of apple trees. These results together support the theoretical expectations that predict a positive correlation between the degree of specialization of ecological interactions and their sensitivity to phenological mismatches (Memmott et al., 2007;Miller-Rushing et al., 2010). From the perspective of resource-consumer dynamics, the highly diverse responses of oligophagous and generalist herbivores that we found to the altered phenology of apple trees are in line with recent theoretical models predicting that changes in phenology alone can lead to qualitatively different dynamics of consumers according to their life-history (Bewick et al., 2016).
Natural enemies
Natural enemies and their prey pests in agro-ecosystems provide an example of predator–
prey relationships between primary and secondary consumers. In our study, abundances of natural enemies were affected by apple tree phenology and also related to prey abundances.
Although we found some bottom-up effects of prey abundance, these were quite weak and natural enemies were more affected by the phenology of apple trees. For example, ladybirds were coupled to aphids, but also affected by apple tree phenology. The two delayed treatments resulted in similarly high aphid abundances, but Delayed1 trees were not visited by higher number of ladybirds than control trees, while Delayed2 trees were strongly invaded byH. axyridis. This is probably because peak aphid abundance on Delayed2 trees coincided with the emergence of the first generation ofH. axyridis(Honek et al., 2018). The higher number of zoophagous bugs on delayed trees and the lack of statistical relationship with aphid abundance are likely due to the fact that the most dominant zoo-phytophagous mullein bugCampylomma verbasci(Meyer-Dür) (∼60% of all zoophagous true bugs) occurred much before the aphid peak (in late May) and occupied mainly the delayed trees.
Finally, spider abundance in two treatment groups was related to the abundance ofS. pyri which is probably an important prey of spiders (Bogya, Markó & Szinetár, 2000). Thus spiders were presumably indirectly affected by the phenological shift of apple trees via altered prey abundance, but only on control trees and Advanced2 trees the phenology of which was the least shifted compared to control trees. In delayed treatments, with much larger shifts, the effect of prey abundance was negligible. Due to the delayed phenology of these trees, spiders avoided them in May when their abundance usually shows a peak (Markó et al., 2009) (Fig. S8).
CONCLUSIONS
Our results indicate that spatio-temporal variation in environmental conditions may play an important, taxon-specific role in the responses to climate-induced phenological asynchrony. For instance, wild bees showed virtually no spatial variation in their responses to the phenological shift of apple (Table S2), but they exhibited a profound change in species composition during the ∼7 weeks long flowering period. In contrast, a large amount of variation in herbivore abundance was explained by the random term indicating a high spatial variation, i.e., large differences both between and within orchards. Species composition of bees and aphidophagous beetles, which are relatively mobile, was rather affected by the phenology of apple trees, while in case of less mobile phytophagous bugs and spiders, variation was higher between orchards than between treatments. These suggest that responses to climate-induced phenological changes of interacting species can be scale-dependent.
We also highlight that species diversity was higher on manipulated trees than on control ones in only one case, otherwise the phenological shift of apple trees always led to lower (or similar) species diversity. The causes of altered diversity are taxon-specific. In case of spiders and phytophagous bugs both the abundance and species richness were higher on the control trees and only a subset of those species were found on manipulated trees. For wild
bees and aphidophagous beetles, the dominance of one or a few species on manipulated trees reduced diversity. We conclude that altered phenology of apple trees led to a few winners—many losers situation: it was beneficial for a few arthropod species, but rather unfavorable for most of them.
In general, both the abundance and diversity of arthropods were more strongly affected by delayed than by advanced phenology of apple trees. This may be a consequence of larger shifts in the phenology of delayed compared to advanced trees, as we accounted for altered tree physiology in our analyses. The larger phenological shift of delayed trees was due to the fact that cold store extended the dormancy of apple trees unexpectedly long. Delayed2 trees stayed only one week longer in the cold store than Delayed1 trees, but they needed ca. 30 days from planting until peak flowering, while Delayed1 trees needed only 16 days.
We admit that such large phenological mismatches are slightly unrealistic in the current scenarios of climate change, so the results on delayed trees should be interpreted cautiously.
Arthropod abundance was either lower or higher, while diversity was rather similar or lower on the manipulated apple trees than on control ones. In line with our hypotheses, species composition of pollinator assemblages differed among treatment groups, and the most specialized herbivore was negatively affected by all treatments, while less specialized herbivores were affected (either positively or negatively) by only the more shifted delayed treatment. Our study present clear evidence that climate-induced phenological mismatch between an orchard crop and multiple groups of arthropods can have diverse effects on abundance, diversity and species composition of arthropods. Consequences of these changes on ecosystem services should be addressed by further research.
ACKNOWLEDGEMENTS
We are indebted to Zsolt Józan and Balázs Keresztes for the identification of bees and spiders, respectively. We are grateful to the farmers for cooperation and to Lídia Homolya for her assistance in the laboratory work. We used free softwares: ImageJ, LibreOffice, R, RKWard and Xubuntu.
ADDITIONAL INFORMATION AND DECLARATIONS
Funding
This study was supported by the Hungarian Scientific Research Fund OTKA 101940 and
‘Lendület’ project of the Hungarian Academy of Sciences. Anikó Kovács-Hostyánszki (AK- H) was a Bolyai and MTA Postdoctoral Fellow. Virginie Boreux (VB) and Alexandra-Maria Klein (AMK) were supported by BiodivERsA2014-74 ‘‘EcoFruit’’. The funders had no role in study design, data collection and analysis, decision to publish, or preparation of the manuscript.
Grant Disclosures
The following grant information was disclosed by the authors:
Hungarian Scientific Research Fund OTKA: 101940.
Hungarian Academy of Sciences.
EcoFruit: ERsA2014-74.
Competing Interests
The authors declare there are no competing interests.
Author Contributions
• Ádám Kőrösi conceived and designed the experiments, performed the experiments, analyzed the data, prepared figures and/or tables, authored or reviewed drafts of the paper, approved the final draft.
• Viktor Markó conceived and designed the experiments, performed the experiments, analyzed the data, authored or reviewed drafts of the paper, approved the final draft.
• Anikó Kovács-Hostyánszki conceived and designed the experiments, performed the experiments, authored or reviewed drafts of the paper, approved the final draft.
• László Somay and Rita Földesi conceived and designed the experiments, performed the experiments.
• Ákos Varga performed the experiments.
• Zoltán Elek conceived and designed the experiments, performed the experiments, authored or reviewed drafts of the paper.
• Virginie Boreux authored or reviewed drafts of the paper.
• Alexandra-Maria Klein conceived and designed the experiments, analyzed the data, authored or reviewed drafts of the paper, approved the final draft.
• András Báldi conceived and designed the experiments, authored or reviewed drafts of the paper, approved the final draft.
Data Availability
The following information was supplied regarding data availability:
The raw data and R code are provided asSupplemental Files.
Supplemental Information
Supplemental information for this article can be found online athttp://dx.doi.org/10.7717/
peerj.5269#supplemental-information.
REFERENCES
Barboza PS, Parker KL, Hume ID. 2009.Integrative wildlife nutrition. Berlin: Springer.
Bartomeus I, Ascher JS, Wagner D, Danforth BN, Colla S, Kornbluth S, Winfree R. 2011.Climate-associated phenological advances in bee pollinators and bee- pollinated plants.Proceedings of the National Academy Sciences of the United States of America108:20645–20649DOI 10.1073/pnas.1115559108.
Bartomeus I, Park MG, Gibbs J, Danforth BN, Lakso AN, Winfree R. 2013.Biodiversity ensures plant—pollinator phenological synchrony against climate change.Ecology Letters16:1331–1338DOI 10.1111/ele.12170.
Barton K. 2014.MuMIn: multi-model inference. R package version 1.10.5.Available at https:// cran.r-project.org/ package=MuMIn.
Bates D, Maechler M, Bolker B, Walker S. 2015.Fitting linear mixed-effects models using lme4.Journal of Statistical Software67:1–48DOI 10.18637/jss.v067.i01.
Benadi G, Hovestadt T, Poethke H-J, Blüthgen N. 2014.Specialization and phenological synchrony of plant-pollinator interactions along an altitudinal gradient.Journal of Animal Ecology83:639–650DOI 10.1111/1365-2656.12158.
Bewick S, Cantrell RS, Cosner C, Fagan WF. 2016.How resource phenology affects con- sumer population dynamics.American Naturalist187:151–166DOI 10.1086/684432.
Bogya S, Markó V, Szinetár C. 2000.Effect of pest management systems on foliage-and grass-dwelling spider communities in an apple orchard in Hungary.International Journal of Pest Management 46:241–250DOI 10.1080/09670870050206000.
Borbély C, Nagy C, Haltrich A, Markó V. 2017.Species composition and control of green apple aphids (Hemiptera, Aphididae,Aphisspp.) in apple orchards. XV. In:
International scientific conference of bachelor’s and master’s degree students. Section:
Applied Biology, 26th April 2017. Nitra, Slovak Republic. Book of abstracts: p 25.
Bos MM, Veddeler D, Bogdanski AK, Klein A-M, Tscharntke T, Steffan-Dewenter I, Tylianakis J. 2007.Caveats to quantifying ecosystem services: fruit abortion blurs benefits from crop pollination.Ecological Applications17:1841–1849 DOI 10.1890/06-1763.1.
Both C, Van Asch M, Bijlsma RG, Van Den Burg AB, Visser ME. 2009.Climate change and unequal phenological changes across four trophic levels: constraints or adapta- tions?Journal of Animal Ecology78:73–83DOI 10.1111/j.1365-2656.2008.01458.x.
Burkle LA, Marlin JC, Knight TM. 2013.Plant-pollinator interactions over 120 years: loss of species, co-occurrence, and function.Science339:1611–1615 DOI 10.1126/science.1232728.
Burnham KP, Anderson DR. 2002.Model selection and multimodel inference: a practical information-theoretic approach. Second Edition. New York: Springer-Verlag.
Cook BI, Wolkovich EM, Parmesan C. 2012.Divergent responses to spring and winter warming drive community level flowering trends.Proceedings of the National Academy Sciences of the United States of America109:9000–9005 DOI 10.1073/pnas.1118364109.
Cross J, Fountain M, Markó V, Nagy C. 2015.Arthropod ecosystem services in apple orchards and their economic benefits.Ecological Entomology40:82–96 DOI 10.1111/een.12234.
Doi H, Gordo O, Katano I. 2008.Heterogeneous intra-annual climatic changes drive different phenological responses at two trophic levels.Climate Research36:181–190 DOI 10.3354/cr00741.
Donnelly A, Caffarra A, O’Neill BF. 2011.A review of climate-driven mismatches between interdependent phenophases in terrestrial and aquatic ecosystems.Inter- national Journal of Biometeorology55:805–817 DOI 10.1007/s00484-011-0426-5.
Elmqvist T, Folke C, Nyström M, Peterson G, Bengtsson J, Walker B, Norberg J. 2003.
Response diversity, ecosystem change, and resilience.Frontiers in Ecology and the Environment 1:488–494DOI 10.1890/1540-9295.
Evans EW, Carlile NR, Innes MB, Pitigala N. 2013.Warm springs reduce parasitism of the cereal leaf beetle through phenological mismatch.Journal of Applied Entomology 137:383–391DOI 10.1111/jen.12028.
Földesi R, Kovács-Hostyánszki A, Kőrösi Á, Somay L, Elek Z, Markó V, Sárospataki M, Bakos R, Varga Á, Nyisztor K, Báldi A. 2016.Relationships between wild bees, hoverflies and pollination success in apple orchards with different landscape contexts.Agricultural and Forest Entomology18:68–75DOI 10.1111/afe.12135.
Forrest JRK. 2015.Plant-pollinator interactions and phenological change: what can we learn about climate impacts from experiments and observations?Oikos124:4–13 DOI 10.1111/oik.01386.
Forrest JRK, Thomson JD. 2011.An examination of synchrony between insect emergence and flowering in Rocky Mountain meadows.Ecological Monographs 81:469–491DOI 10.1890/10-1885.1.
Garibaldi LA, Steffan-Dewenter I, Kremen C, Morales JM, Bommarco R, Cunningham SA, Carvalheiro LG, Chacoff NP, Dudenhöffer JH, Greenleaf SS, Holzschuh A, Isaacs R, Krewenka K, Mandelik Y, Mayfield MM, Morandin LA, Potts SG, Ricketts TH, Szentgyörgyi H, Viana BF, Westphal C, Winfree R, Klein AM. 2011.Stability of pollination services decreases with isolation from natural areas despite honey bee visits.Ecology Letters14:1062–1072DOI 10.1111/j.1461-0248.2011.01669.x.
Garratt MPD, Breeze TD, Jenner N, Polce C, Biesmeijer JC, Potts SG. 2014.Avoiding a bad apple: insect pollination enhances fruit quality and economic value.Agriculture, Ecosystems and Environment 184:34–40DOI 10.1016/j.agee.2013.10.032.
Gezon ZJ, Inouye DW, Irwin RE. 2016.Phenological change in a spring ephemeral:
implications for pollination and plant reproduction.Global Change Biology 22:1779–1793DOI 10.1111/gcb.13209.
Hegland SJ, Nielsen A, Lázaro A, Bjerknes A-L, Totland O. 2009.How does cli- mate warming affect plant-pollinator interactions?Ecology Letters12:184–195 DOI 10.1111/j.1461-0248.2008.01269.x.
Hill MO. 1973.Diversity and evenness: a unifying notation and its consequences.Ecology 54:427–473DOI 10.2307/1934352.
Honek A, Martinkova Z, Dixon AF, Skuhrovec J, Roy HE, Brabec M, Pekar S.
2018.Life cycle ofHarmonia axyridisin central Europe.BioControl63:241–252 DOI 10.1007/s10526-017-9864-2.
Iler AM, Inouye DW, Høye TT, Miller-Rushing AJ, Burkle LA, Johnston EB. 2013.
Maintenance of temporal synchrony between syrphid flies and floral resources despite differential phenological responses to climate.Global Change Biology 19:2348–2359DOI 10.1111/gcb.12246.
Intergovernmental Panel on Climate Change (IPCC). 2014. Climate change 2014:
Synthesis report. In: Core Writing Team, Pachauri RK, Meyer LA, ed.Contribution of working groups I, II and III to the fifth assessment report of the intergovernmental panel on climate change. Geneva: IPCC, 1–151.
Klein A-M, Vaissiere BE, Cane JH, Steffan-Dewenter I, Cunningham SA, Kremen C, Tscharntke T. 2007.Importance of pollinators in changing landscapes for
world crops.Proceedings of the Royal Society B: Biological Sciences274:303–313 DOI 10.1098/rspb.2006.3721.
Kovács-Hostyánszki A, Haenke S, Batáry P, Jauker B, Báldi A, Tscharntke T,
Holzschuh A. 2013.Contrasting effects of mass-flowering crops on bee pollination of hedge plants at different spatial and temporal scales.Ecological Applications 23:1938–1946DOI 10.1890/12-2012.1.
Kudo G, Ida TY. 2013.Early onset of spring increases the phenological mismatch between plants and pollinators.Ecology94:2311–2320DOI 10.1890/12-2003.1.
Legendre P, Gallagher ED. 2001.Ecologically meaningful transformations for ordination of species data.Oecologia129:271–280 DOI 10.1007/s004420100716.
Leonhardt D, Gallai N, Garibaldi LA, Kuhlmann M, Klein A-M. 2013.Economic gain, stability of pollination and bee diversity decrease from southern to northern Europe.
Basic and Applied Ecology14:461–471DOI 10.1016/j.baae.2013.06.003.
Mallinger RE, Gratton C. 2015.Species richness of wild bees, but not the use of managed honeybees, increases fruit set of a pollinator-dependent crop.Journal of Applied Ecology 52:323–330DOI 10.1111/1365-2664.12377.
Markó V, Jenser G, Kondorosy E, Ábrahám L, Balázs K. 2013.Flowers for bet- ter pest control? The effects of apple orchard ground cover management on green apple aphids (Aphis spp.) (Hemiptera: Aphididae), their predators and the canopy insect community.Biocontrol Science and Technology23:126–145 DOI 10.1080/09583157.2012.743972.
Markó V, Keresztes B, Fountain MT, Cross JV. 2009.Prey availability, pesticides and the abundance of orchard spider communities.Biological Control48:115–124 DOI 10.1016/j.biocontrol.2008.10.002.
Memmott J, Craze PG, Waser NM, Price MV. 2007.Global warming and the disruption of plant-pollinator interactions.Ecology Letters10:710–717
DOI 10.1111/j.1461-0248.2007.01061.x.
Miller-Rushing AJ, Høye TT, Inouye DW, Post E. 2010.The effects of phenological mismatches on demography.Philosophical Transactions of the Royal Society B, Biological Sciences365:3177–3186DOI 10.1098/rstb.2010.0148.
Mitchell RJ, Flanagan RJ, Brown BJ, Waser NM, Karron JD. 2009.New frontiers in competition for pollination.Annals of Botany103:1403–1413
DOI 10.1093/aob/mcp062.
Moise ERD, Henry HAL. 2010.Like moths to a street lamp: exaggerated animal densities in plot-level global change field experiments.Oikos119:791–795 DOI 10.1111/j.1600-0706.2009.18343.x.
Nagy C, Cross JV, Markó V. 2013.Sugar feeding of the common black ant,La- sius niger(L.), as a possible indirect method for reducing aphid populations on apple by disturbing ant-aphid mutualism.Biological Control65:24–36 DOI 10.1016/j.biocontrol.2013.01.005.
Oksanen J, Blanchet FG, Friendly M, Kindt R, Legendre P, McGlinn D, Minchin PR, O’Hara RB, Simpson GL, Solymos P, Stevens MHH, Szoecs E, Wagner H. 2017.
vegan: community ecology package. R package version 2.4-4.Available athttps:
// cran.r-project.org/ package=vegan.
Oliver T, Heard MS, Isaac NJB, Roy DB, Procter D, Eigenbrod F, Freckleton R, Hector A, Orme DL, Petchey OL, Proenca V, Raffaelli D, Suttle KB, Mace GM, Martín-López B, Woodcock BA, Bullock JM. 2015.Biodiversity and re- silience of ecosystem functions.Trends in Ecology and Evolution30:673–684 DOI 10.1016/j.tree.2015.08.009.
O’Neal ME, Landis DA, Isaacs R. 2002.An inexpensive, accurate method for measuring leaf area and defoliation through digital image analysis.Journal of Economic Entomol- ogy95:1190–1194DOI 10.1603/0022-0493-95.6.1190.
Ovaskainen O, Skorokhodova S, Yakovleva M, Sukhov A, Kutenkov A, Kutenkova N, Shcherbakov A, Meyke E, Del Mar Delgado M. 2013.Community-level phenolog- ical response to climate change.Proceedings of the National Academy Sciences of the United States of America110:13434–13439DOI 10.1073/pnas.1305533110.
Parsche S, Fründ J, Tscharntke T. 2011.Experimental environmental change and mutualistic vs. antagonistic plant flower—visitor interactions.Perspectives in Plant Ecology, Evolution and Systematics13:27–35DOI 10.1016/j.ppees.2010.12.001.
Petanidou T, Kallimanis AS, Tzanopoulos J, Sgardelis SP, Pantis JD. 2008.Long-term observation of a pollination network: fluctuation in species and interactions, relative invariance of network structure and implications for estimates of specialization.
Ecology Letters11:564–575DOI 10.1111/j.1461-0248.2008.01170.x.
Post E, Forchhammer MC. 2008.Climate change reduces reproductive success of an Arctic herbivore through trophic mismatch.Philosophical Transactions of the Royal Society B, Biological Sciences363:2367–2373DOI 10.1098/rstb.2007.2207.
Primack RB, Ibáñez I, Higuchi I, Lee SD, Miller-Rushing AJ, Wilson AM, Silander JA.
2009.Spatial and interspecific variability in phenological responses to warming tem- peratures.Biological Conservation142:2569–2577DOI 10.1016/j.biocon.2009.06.003.
R Core Team. 2017.R: a language and environment for statistical computing. Vienna: R Foundation for Statistical Computing.Available athttps:// www.R-project.org/. Rafferty NE, CaraDonna PJ, Burkle LA, Iler AM, Bronstein JL. 2013.Phenological
overlap of interacting species in a changing climate: an assessment of available approaches.Ecology and Evolution3:3183–3193DOI 10.1002/ece3.668.
Rafferty NE, Ives AR. 2011.Effects of experimental shifts in flowering phenology on plant-pollinator interactions.Ecology Letters14:69–74
DOI 10.1111/j.1461-0248.2010.01557.x.
Rafferty NE, Ives AR. 2012.Pollinator effectiveness varies with experimental shifts in flowering time.Ecology93:803–814DOI 10.1890/11-0967.1.
Riedinger V, Renner M, Rundlöf M, Steffan-Dewenter I, Holzschuh A. 2014.Early mass-flowering crops mitigate pollinator dilution in late-flowering crops.Landscape Ecology 29:425–435DOI 10.1890/12-2012.1.
Rosa García RR, Miñarro M. 2014.Role of floral resources in the conservation of polli- nator communities in cider-apple orchards.Agriculture, Ecosystems and Environment 183:118–126DOI 10.1016/j.agee.2013.10.017.
Schneider CA, Rasband WS, Eliceiri KW. 2012.NIH Image to ImageJ: 25 years of image analysis.Nature Methods9:671–675DOI 10.1038/nmeth.2089.
Schwartz MD, Ahas R, Aasa A. 2006.Onset of spring starting earlier across the Northern Hemisphere.Global Change Biology12:343–351
DOI 10.1111/j.1365-2486.2005.01097.x.
Skaug H, Fournier D, Bolker B, Magnusson A, Nielsen A. 2015.Generalized linear mixed models using ‘AD Model Builder’. R package version 0.8.2.Available at http:// glmmadmb.r-forge.r-project.org/.
Steffan-Dewenter I, Schiele S. 2008.Do resources or natural enemies drive bee popula- tion dynamics in fragmented habitats?Ecology 89:1421–1432
DOI 10.1890/06-1323.1.
Stenseth NC, Mysterud A. 2002.Climate, changing phenology, and other life-history traits: non-linearity and match-mismatch to the environment.Proceedings of the National Academy Sciences of the United States of America99:13379–13381 DOI 10.1073/pnas.212519399.
Stoeckli S, Mody K, Dorn S. 2008.Aphis pomi(Hemiptera: Aphididae) population devel- opment, shoot characteristics, and antibiosis resistance in different apple genotypes.
Journal of Economic Entomology101:1341–1348 DOI 10.1603/0022-0493.
Thackeray SJ, Sparks TH, Frederiksen M, Burthe S, Bacon PJ, Bell JR, Botham MS, Brereton TM, Bright PW, Carvalho L, Clutton-Brock T, Dawson A, Edwards M, Elliott JM, Harrington R, Johns D, Jones ID, Jones JT, Leech DI, Roy DB, Scott WA, Smith M, Smithers RJ, Winfield IJ, Wanless S. 2010.Trophic level asynchrony in rates of phenological change for marine, freshwater and terrestrial environments.
Global Change Biology 16:3304–3313DOI 10.1111/j.1365-2486.2010.02165.x.
Thomson DJ. 2010.Flowering phenology, fruiting success and progressive deterioration of pollination in an early-flowering geophyte.Philosophical Transactions of the Royal Society B, Biological Sciences365:3189–3199DOI 10.1098/rstb.2010.0115.
Torchio PF. 1991.Bees as crop pollinators and the role of solitary species in changing environments.Acta Horticulturae288:49–61DOI 10.17660/ActaHortic.1991.288.3.
Tóthmérész B. 1995.Comparison of different methods for diversity ordering.Journal of Vegetation Science6:283–290DOI 10.2307/3236223.
Van Asch M, Van Tienderen PH, Holleman LJM, Visser ME. 2007.Predicting adapta- tion of phenology in response to climate change, an insect herbivore example.Global Change Biology 13:1596–1604DOI 10.1111/j.1365-2486.2007.01400.x.
Van Asch M, Visser ME. 2007.Phenology of forest caterpillars and their host trees: the importance of synchrony.Annual Review of Entomology52:37–55 DOI 10.1146/annurev.ento.52.110405.091418.
Vazquez DP, Morris WF, Jordano P. 2005.Interaction frequency as a surrogate for the total effect of animal mutualists on plants.Ecology Letters8:1088–1094 DOI 10.1111/j.1461-0248.2005.00810.x.
Visser ME, Holleman LJM. 2001.Warmer springs disrupt the synchrony of oak and winter moth phenology.Proceedings of the Royal Society B, Biological Sciences 268:289–294DOI 10.1098/rspb.2000.1363.
Wachmann E, Melber A, Deckert J. 2006.Wanzen. Band 1. Dipsocoromorpha, Nepo- morpha, Gerromorpha, Leptopodomorpha, Cimicomorpha (Teil 1). Die Tierwelt Deutschlands. 77. Teil. Keltern: Goecke and Evers, 1–264.
Westphal C, Steffan-Dewenter I, Tscharntke T. 2003.Mass flowering crops en- hance pollinator densities at a landscape scale.Ecology Letters6:961–965 DOI 10.1046/j.1461-0248.2003.00523.x.
Winder M, Schindler DE. 2004.Climate change uncouples trophic interactions in an aquatic ecosystem.Ecology85:2100–2106DOI 10.1890/04-0151.
Zuur AF, Ieno EN, Walker NJ, Saveliev AA, Smith GM. 2009.Mixed effects models and extensions in ecology with R. New York: Springer.