Numerical modeling of airway deposition distribution and health effects of aerosol drugs
Doctoral theses Ágnes Jókay Semmelweis University
Doctoral School of Basic and Translational Medicine
Supervisor: Árpád Farkas, Ph.D
Official reviewers: Gábor Horváth, Ph.D Zsófia Kertész, Ph.D
Head of the Final Examination Committee: Györgyi Rontó, D.Sc
Members of the Final Examination Committee: László Horváth, D.Sc Anikó Bohács, Ph.D
Budapest 2018
1. Introduction
Today the most common therapy for asthma and chronic obstructive pulmonary disease (COPD) is aerosol drug delivery. In inhalation therapy, smaller amounts of drugs are necessary compared to oral therapy, thus the frequency of side effects is also reduced. In addition to treating respiratory diseases, inhaled drug delivery is also gaining ground in treating other diseases or is in an experimental stage (e.g. inhaled insulin in diabetes treatment).
Therapeutic efficacy strongly depends on the drug's airway deposition distribution. In order to ensure that the drugs have the highest possible bioavailability, the appropriate amount and composition of drugs should be delivered to the target area and the amount of drug deposited outside the target area should be minimized.
Numerical modelling, which is non-invasive, fast, cost-effective and makes the analysis of the individual and collective effects of almost any number of factors possible, is a promising way of characterizing the individual specific airway deposition distribution of inhaled aerosol drugs in the near future. Conversely, in vivo human experiments would have significant cost implications, they
1
could not be applied in daily practice because of the risk of radiation exposure, and the resolution of the method would generally not be sufficient to measure local burden.
To optimize individualized drug intake, it is necessary to gain a better understanding of (i) the characteristics of the respiratory tract, (ii) the patient-specific breathing mode, (iii) the characteristics of aerosol drugs, and (iv) the inhalation devices capable of delivering the drugs into the airway, and (v) the airways deposition mechanisms as much as possible. In addition, consideration should be given to whether the patient is able to use correctly the medication device prescribed by the physician. Further useful information is related to pulmonary clearance mechanisms and drug absorption rates.
2. Objectives
The overall aim of my doctoral work is to analyse whether individualized aerosol drug therapies can be carried out in the near future and, if feasible, to develop, implement, test and optimize this method.
2
The specific objectives of my doctoral work are as follows: (i) the description of the dependence of airway aerosol drug deposition on respiratory parameters, (ii) studying the dependence of deposition on particle properties, (iii) determining the directions of drug intake optimization by measurements and numerical modelling, and (iv) demonstrating that there is a need for computer modelling in asthma and COPD therapies.
3. Methods
There were three adult study groups in the study: 17 healthy volunteers (13 men and 4 women) in Group 1, 25 healthy volunteers (14 men and 11 women) in Group 2, and 17 COPD patients (5 men and 12 women) in Group 3.
For the studies, we have chosen one-component (bronchodilator) and two-component (anti-inflammatory and bronchodilator) medicines often used in the treatment of asthma and COPD in Hungary.
3 Spirometry measurements
As the diagnosis of asthma and COPD patients is based inter alia on a respiratory function test, standard breathing data is available at the time of prescribing the drug.
However, standard spirometry measurement in a routine medical investigation does not directly reveal how the individual would deliver spirometry values through a given inhalation device. Therefore, I performed spirometry measurements - standard spirometry (without inhalation devices) and through inhalation devices - using the DD-301/sh Piston Spirometer in Study Group 1 and 2 (in Group 3 measurements were performed by colleagues of the SE Pulmonology Clinics).
Determination of individualized emitted doses, particle size distributions, mass median aerodynamic diameters (MMAD) and inhaled air volumes (IVC) Based on in vitro measurement results from the literature, the emitted dose and the drug’s particle size distribution of dry powder inhalers (DPI) depend on the inhalation flow rate. Therefore, I have collected from the cited literature
4
the emitted dose values and particle size distributions measured at different flow rates for the active substances of the studied drugs. Since these relationships are only known to a few flow rates, but patients' flow rate values in reality show a continuous spectrum, I have fitted functions to the existing data. Using these functions, I have determined the emitted dose and the particle size distribution for each individual and device in Study Group 2.
In the case of DPIs, MMAD of the emitted particles depend on the inhalation force, which is characterized by the peak inspiratory flow (PIF). In the literature, the relationship between MMAD and PIF is known for some drugs. The particle size does not directly depend on PIF0
measured in the standard spirometry test, but on PIF realized via the device, therefore, based on literature data, I first determined a mathematical relationship between PIF and PIF0 and then calculated the individualized MMAD of the studied drugs in Study Group 1.
One of the most important input data of the Stochastic Lung Model that accounts for the calculation of airway deposition distribution of aerosol drugs is inhaled volume.
5
For the calculations inhaled volume (IVC) measured via the inhalation device was required. Therefore, I determined the relationship between spirometry inspiratory vital capacity (IVC0) and IVC recorded via the use of device by function fitting. Using the functions, I calculated individual and device specific inhaled volumes.
Validation of the numerical model with measurement results
I have investigated the suitability of the Stochastic Lung Model to determine the airway deposition distribution of aerosol drugs. To this end, I compared the simulation results with in vivo scintigraphic lung deposition data available in the literature, measured under similar conditions. In addition, I compared the simulation results with in vitro particle deposition results also. For in vitro experiments I have reconstructed 3D realistic airway geometries based on CT recordings, which enabled measurements to be made after 3D printing.
6
Patient tailored medicine and device selection
With the help of the validated Stochastic Lung Model, I calculated the regional and airway generation number specific deposited fractions and deposition densities for each individual for all drug-devices’ active substances they inhaled. For calculations, I used measured spirometry data and individual size distributions.
I compared the deposition distribution’s results of the various drugs to each individual and analysed which medicine is the most favourable for a given individual based on the deposition distribution.
4. Results
Determination of individualized emitted doses and particle size distributions
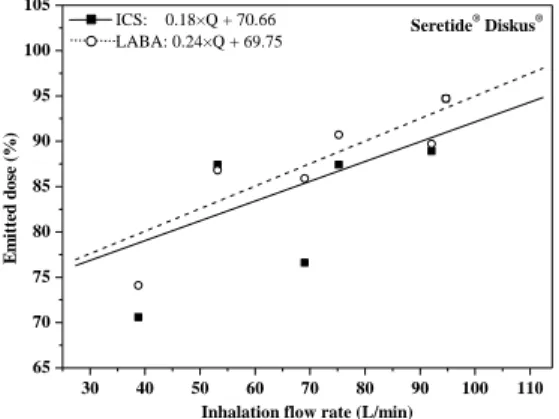
I calculated individual emitted dose and size fraction values for the active substances of three combined drugs (Seretide® Diskus®, Symbicort® Turbuhaler®, Foster® NEXThaler®) (Study Group 2). Figure 1 shows the curves fitted to the emitted dose values of the anti-inflammatory (ICS, inhaled corticosteroids) and bronchodilator (LABA,
7
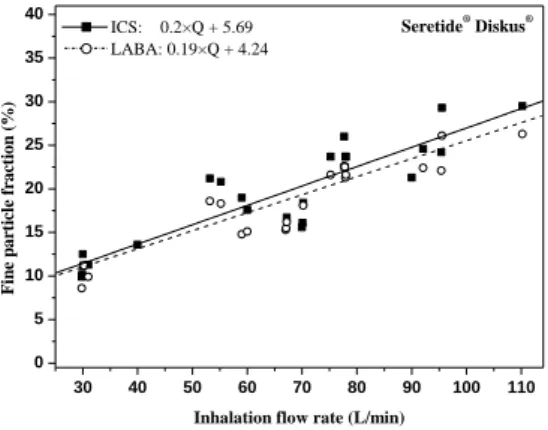
long-acting β2 receptor agonist) active ingredients of Seretide® Diskus®, while Figure 2 demonstrates the fitted curves on fine particle fraction (fraction of particles smaller than 5 microns) values. The mathematical relationships between the inhalation flow rate (Q) and the emitted dose as well as the Q and size fractions can be written as a*Q+b, where a and b are fitting parameters.
From the fitted curves, based on the individual flow rate, we can calculate the individual-specific emitted dose and size fraction values.
Figure 1: The relationship between the emitted dose and inhalation flow rate to the two active ingredients of
Seretide® Diskus®
30 40 50 60 70 80 90 100 110
65 70 75 80 85 90 95 100 105
Seretide® Diskus®
Emitted dose (%)
Inhalation flow rate (L/min) ICS: 0.18×Q + 70.66
LABA: 0.24×Q + 69.75
8
Figure 2: Fine particle fraction as a function of inhalation flow rate to the two active ingredients of
Seretide® Diskus®
Determination of individualized MMAD values
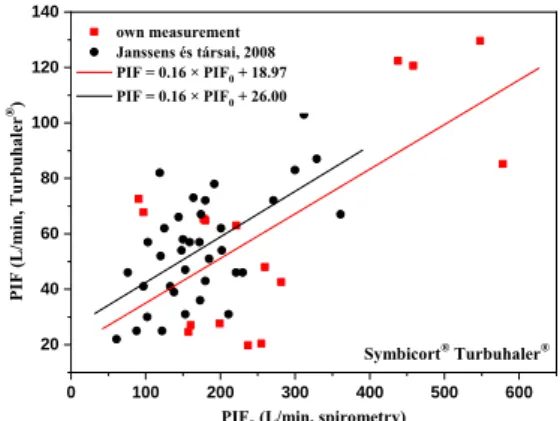
Since MMAD depends on the peak inspiratory flow (PIF) realized through the device and not the standard spirometric peak inspiratory flow (PIF0), I first determined the PIF-PIF0 relationships. These relationships are shown in Figure 3 for a number of individuals (Study Group 1) in a selected device (Turbuhaler®), including literary data.
30 40 50 60 70 80 90 100 110
0 5 10 15 20 25 30 35
40 Seretide® Diskus®
Fine particle fraction (%)
Inhalation flow rate (L/min) ICS: 0.2×Q + 5.69
LABA: 0.19×Q + 4.24
9
Figure 3: Relationship between peak inspiratory flow measured under standard spirometry (PIF0) and during
inhalation through device (PIF)
In addition to the determination of MMAD, the formula shown in the figure reveals if the given patient cannot properly activate a dry powder inhaler, i.e. reach the specific minimum flow rate for an inhaler providing the appropriate dose and size distribution.
Based on the PIF values derived from the measured PIF0
(see Figure 3) and the PIF-MMAD correlations known in the art, it can be determined what MMAD is characteristic for a given patient when inhaling a drug. Table 1 shows MMAD values for two drugs for 5 selected individuals (Study Group 1).
0 100 200 300 400 500 600
20 40 60 80 100 120 140
Symbicort® Turbuhaler® PIF (L/min, Turbuhaler®)
PIF0 (L/min, spirometry) own measurement
Janssens és társai, 2008 PIF = 0.16 × PIF0 + 18.97 PIF = 0.16 × PIF0 + 26.00
10
Table 1: Calculated individual and drug-specific MMAD values
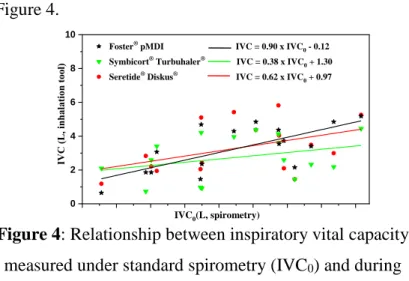
Determination of relationships between standard spirometric inspiratory vital capacity (IVC0) and inhaled volume measured during the inhalation through device (IVC)
Due to the resistance of the DPI devices, the measured breathing parameter values strongly depend on whether the individual inhales the drug through the device or without the device. The average inspiratory vital capacity (IVC0) measured during standard spirometry (Study Group 2) was 4.12±1.18 L, and the average of inhaled volumes (IVC) performed through the three devices were 3.17±1.42 L (NEXThaler®), 3.54±1.27 L (Turbuhaler®) and 4.52±1.62 L (Diskus®). The IVC0-IVC mathematical relationships between the corresponding parameter values
11
measured without and through the device are shown in Figure 4.
Figure 4: Relationship between inspiratory vital capacity measured under standard spirometry (IVC0) and during
inhalation device (IVC) (Study Group 1)
The measured breathing parameters and size distributions determined above constituted the input data of the Stochastic Lung Model.
Results of the validation of the deposition model I compared the in vivo scintigraphic data with the calculation’s results obtained with the Stochastic Lung Model. The calculated values showed a good match with the experimental data in all measured ranges.
0 2 4 6 8 10
Foster® pMDI IVC = 0.90 x IVC0 - 0.12 Symbicort® Turbuhaler® IVC = 0.38 x IVC0 + 1.30 Seretide® Diskus® IVC = 0.62 x IVC0 + 0.97
IVC (L, inhalation tool)
IVC0(L, spirometry)
12
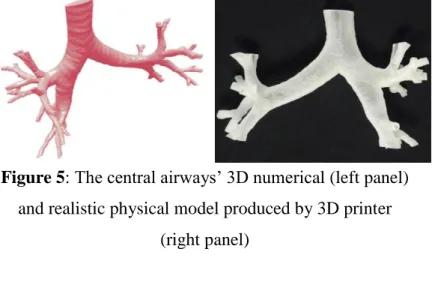
I created the realistic 3D numerical geometry of the upper and central airways, and realistic 3D models were created by 3D printers in which in vitro measurements were carried out (Figure 5). The analysis revealed that the results of the in vitro measurements are in good match with the results of the simulation.
Figure 5: The central airways’ 3D numerical (left panel) and realistic physical model produced by 3D printer
(right panel)
Results of the deposition calculations obtained with the Stochastic Lung Model: patient tailored drug and device selection
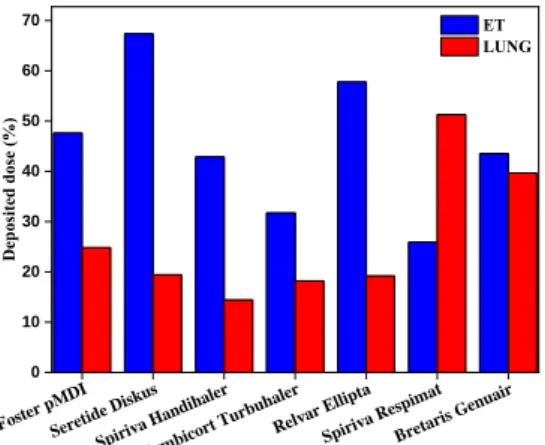
Figure 6 shows the doses of seven different inhaled drugs deposited in the lung and extrathoracic region for a selected COPD patient. Four of the seven drugs are combined medications (Foster® pMDI, Seretide® Diskus®,
13
Symbicort® Turbuhaler®, Relvar® Ellipta®), and three of them are bronchodilators (Spiriva® Handihaler®, Spiriva® Respimat®, Bretaris® Genuair®). As an example for the selected patient, Foster® would be the best choice among the combined medications if the goal is to achieve the highest lung deposition, while Spiriva® Respimat® would be the best choice from the bronchodilators. It should be noted that for another patient other drug-device pair could be a better choice. There is no “one size fits all” solution, but there are good solutions customized for the needs of the individual patients.
Figure 6: Deposited doses of seven drugs in the upper airways and lungs in the case of a COPD patient.
Foster pMDI Seretide Diskus
Spiriva Handihaler Symbi
cort Turbuhaler Relvar Ellipta
Spiriva Respimat Bretaris Genu
air 0
10 20 30 40 50 60 70
Deposited dose (%)
ET LUNG
14
5. Conclusions
On basis of the work completed and the results, I have formulated the following scientific theses:
1. Based on the standard spirometry measurements and spirometry measurements through inhalation devices I have derived mathematical functions which allow us to estimate the expected breathing parameter values from the standard spirometric data of a given patient in the case of a given inhaler.
2. I have elaborated a new method, which enables us to decide whether a patient is able to generate a sufficiently high inhalation force through a given inhaler based on their standard spirometric data.
3. Based on my measurements I found that the flow resistance of the device highly influences the value of the inhaled volume and flow rate and that the emitted dose and the particle size distribution also depend on the inhalation flow rate in the case of dry powder inhalers. The degree of dependence is device-specific, therefore I determined mathematical relationships for each of the devices studied, giving the emitted dose and
15
particle size distribution. The amount of the inhaled drug into the airways and the size distribution of the particles can thus be determined at any inhalation flow rate that enables more accurate calculation of the airway deposition distributions.
4. I calculated the patient tailored regional and airway generation number specific deposited dose distribution and deposition density distribution of numerous, currently used aerosol drugs in the case of 17 patients with the help of the Stochastic Lung Model both in the target area and outside the target area. For each patient I examined which drug has the highest deposition in the target area. I have determined how much improvement is reachable in terms of target site drug deposition when a patient inhales the drug yielding the highest lung deposition compared to the drug resulting in the lowest lung deposition (1.1–2.7-times increase for ICS + LABA combined drugs, 2.6–3.6-times increase for LAMA bronchodilators).
16
5. This newly developed method makes it possible to design and optimise individualized aerosol drug intake in case of asthmatic and COPD patients for the first time based on standard spirometry measurements. In order to reach this aim, applying the procedures developed here, mathematical functions mentioned in the first thesis point should be derived for each drug in the market, and then using these functions and the Stochastic Lung Model, the individualized aerosol drug therapy and optimization can be achieved.
6. Publications
Publications related to the dissertation topic:
1. Jókay Á, Farkas Á, Füri P, Horváth A, Tomisa G, Balásházy I. (2016) Computer modeling of airway deposition distribution of Foster® NEXThaler® and Seretide® Diskus® dry powder combination drugs. Eur J Pharm Sci, 88: 210–218.
2. Farkas Á, Jókay Á, Balásházy I, Füri P, Müller V, Tomisa G, Horváth A. (2016) Numerical simulation of emitted particle characteristics and airway deposition
17
distribution of Symbicort® Turbuhaler® dry powder fixed combination aerosol drug. Eur J Pharm Sci, 93:
371–379.
3. Horváth A, Jókay Á, Farkas Á, Tomisa G. (2016) The characteristics of diagnosis, patient care and education of asthma and COPD patients from the perspective of the actors in the Hungarian healthcare system. J Public Health, 24: 21–29.
4. Kontz K, Tomisa G, Szénási G, Farkas Á, Jókay Á, Horváth A. (2016) Asztmás és COPD-s betegek ellátásának jellemzői a magyar egészségügyben. Med Thorac, 69: 243–251.
5. Farkas Á, Jókay Á, Füri P, Balásházy I, Müller V, Odler B, Horváth A. (2015) Computer modelling as a tool in characterization and optimization of aerosol drug delivery. Aerosol Air Qual Res, 15: 2466–2474.
6. Jókay Á, Farkas Á, Füri P, Balásházy I, Horváth A, Müller V. (2015) Az asztma kezelésében néhány gyakran használt kombinált aeroszol gyógyszer (ICS- LABA) légúti kiülepedéseloszlásának numerikus modellezése. Med Thorac, 68: 46–57.
18
Publications not related to the dissertation topic:
1. Füri P, Hofmann W, Jókay Á, Balásházy I, Moustafa M, Czitrovszky B, Kudela G, Farkas Á. (2017) Comparison of airway deposition distributions of particles in healthy and diseased workers in an Egyptian industrial site. Inhal Toxicol, 4: 147-159.
2. Bense L, Eklund G, Jorulf H, Farkas Á, Eden- Strindberg J, Gennser M, Jókay Á, Krebsz Á. (2015) Pulmonary gas conducting interstitial pathway. Acta Radiol Open, 4.
3. Jókay Á, Bégány Á, Emri G. (2008) Az UV index jelentősége a fényvédelemben. Bőrgyógyászati és Venerológiai Szemle, 84: 151–3.